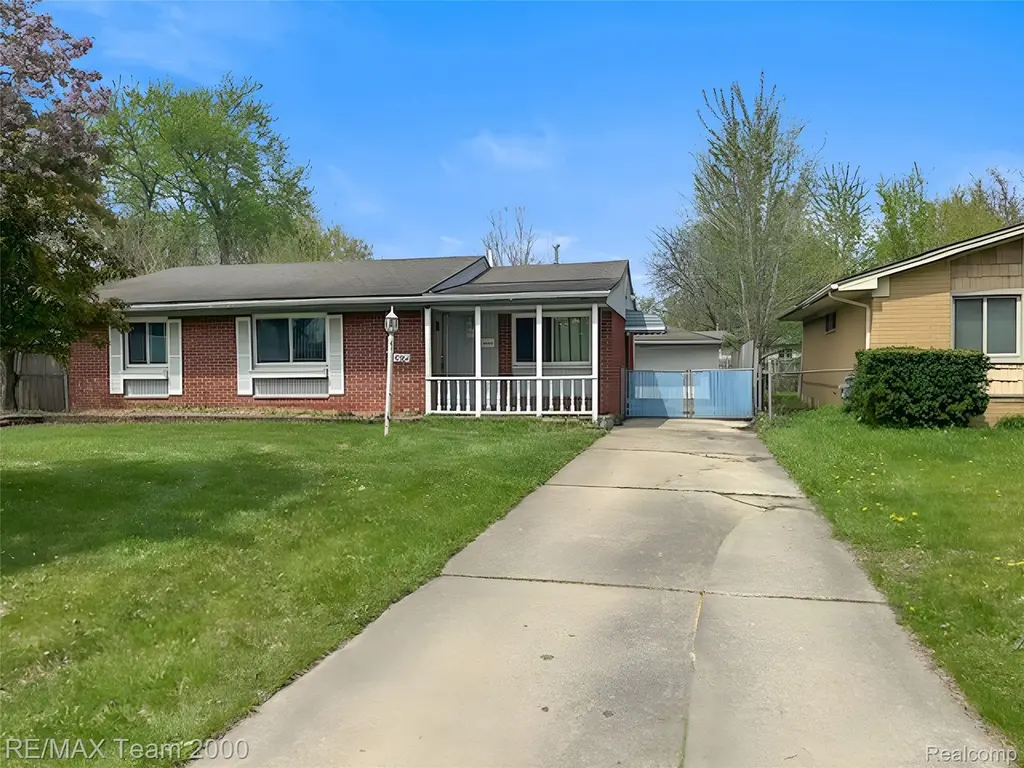
42054 Lincoln St · Van Buren, MI
Flood risk 1/10 · Minimal
- FEMA flood zone
- X (unshaded)
- Chance of flooding over 30 yrs
- 0.0%
- Est. flood insurance / yr
- $507 – $1,088
Fire risk 3/10 · Minor
- Est. fire insurance / yr
- $784 – $1,456
Heat risk 3/10 · Minor
- Hot days now (above 98°F)
- 7 days/yr
- Hot days in 30 yrs
- 15 days/yr
Wind risk 2/10 · Minimal
- Chance of severe wind over 30 yrs
- —
Air-quality risk 2/10 · Minimal
- Unhealthy air days now
- 1 days/yr
- Unhealthy air days in 30 yrs
- 2 days/yr
Risk factors via First Street. Map © Google.
Why this score? — see what drove the C+ grade
The composite is a weighted blend of 9 inputs, each scored 0–100. Each bar is that input's sub-score; the figure is the points it added to the 100-point composite (weight × sub-score).
- Cash flow +22.2/30.0
- ARV discount +15.0/15.0
- DSCR +7.1/10.0
- 1% rule +6.7/10.0
- Rent growth +3.4/5.0
- Schools +3.3/10.0
- Livability +2.5/5.0
- Condition / age +2.5/5.0
- Appreciation +0.0/10.0
$149,900
🖨 Deal sheet 📄 Offer letter ✓ Due diligence
Listing remarks MLS
Welcome to 42054 Lincoln Street in Van Buren Township! This 3-bedroom, 1.5-bath ranch offers 1,356 square feet of living space on a spacious 60' x 120' lot and presents an excellent opportunity for buyers looking to build equity and make a home their own. The functional ranch floor plan features a comfortable living area, spacious kitchen, and three generously sized bedrooms, all on one convenient level. A detached 2-car garage provides ample parking and storage space, while the large backyard offers plenty of room for outdoor entertaining, gardening, or future improvements. Whether you're a first-time homebuyer, investor, or someone looking for a project with potential, this property offers a solid opportunity in a convenient Van Buren Township location close to shopping, dining, parks, schools, and major freeways. Bring your vision and creativity this home is ready for its next chapter!
Key facts
- Large backyard
- Spacious kitchen
- 7,405 sq ft lot
Tags
Property features AI
Finance
- Other: Paved road access; Lot roughly 60 x 120 (0.17 acres); Subdivision: VAN BUREN ESTATES
- Financial info: No investment or income details provided
- HOA & community: No HOA information provided
Exterior
- Parking: Detached garage with direct access; 2 garage spaces
- Security: No security features listed
- Utilities: Public water; Public sewer
- Home design: Single-family residence; One-level home; Ground-level entry with steps; Brick construction; Asphalt roof; Faces not specified
- Construction: Brick exterior; Asphalt roof; Crawl space foundation; Built year not provided
- Exterior features: Covered porch; Covered patio; Exterior lighting; Back yard fencing (fenced)
Interior
- Kitchen: No kitchen appliance list provided
- Bedrooms: Total of 6 rooms (bedroom count not specified)
- Flooring: No flooring details provided
- Bathrooms: 1 full bathroom; 1 half bathroom
- Heating & cooling: Forced air heating; Natural gas heating; No central cooling
- Interior features: Gas water heater; Crawl space basement
- Laundry & utility: No laundry appliances listed
Neighborhood map
What this means for you Summary
Snapshot
- This is a 3-bed/1.5-bath single-family listed at $150k.
Deal economics
- At list price, monthly cash flow is $244 ($3k/yr) — positive.
- The deal already cash-flows at list — no discount required.
- Meets the 1% rule at list price ($2k rent vs $150k).
- Recommended offer: $148k (1.5% below list) — sets the bar for market timing.
Location & tenants
- Location reads: area grade C — affects rentability + tenant quality, not the cash-flow math above.
- Van Buren Public Schools (suburban): math 33% / reading 43% proficiency, ranked #228 of 540 in MI (top 42%) — families likely to look elsewhere, expect single-tenant / working-renter base with shorter leases.
- Market conditions: Rents rising (+3.6%/yr); 216 active listings in the ZIP; 3 comparable units currently listed for rent nearby; rentals leasing fast (median 2d on market — plan ~1-2 weeks tenant-placement turnaround); solid renter incomes; 2,639 units permitted in Wayne County in 2024 (1,216 in 5+ unit buildings).
Forward outlook
- Local home prices are declining (-3.0%/yr); year-one equity from $1k of loan paydown is wiped out by about $4k of value loss. Plan a longer hold.
- Wayne County population projected at -17% by 2050 — secular population decline; favor cash flow + early exit over multi-decade hold.
Negotiation context
- It's been on market 15 days — a 2% lower offer ($148k) is reasonable based on typical stale-listing flexibility.
- 4 sale attempts with the ask held roughly flat each time — persistent listings suggest the price (not the market) is what's stuck; bring a comps-based counter.
Questions for the listing agent
- Built in 1970 — when were the roof, HVAC, electrical panel, plumbing, and water heater last replaced?
- Is there a deadline driving the sale (1031 exchange, divorce, estate, relocation)? That informs how much negotiation room exists.
- What's the average days-on-market for RENTAL listings here right now (not sales)? A rising rental-DOM trend means longer vacancies and softer asking-rent achievability than the comps imply.
- What's the recent tenant-quality profile in this submarket — average credit score on applications, eviction rate, late-payment / NSF rate, and stable-employment percentage? A property-management company in the area should have these aggregated.
- How much new for-sale + rental construction is in the pipeline within 1–3 miles? Heavy new supply typically softens prices + rents 12–24 months out; constrained supply supports both.
Investment metrics
- 1% rule
- 1.17% ✓
- Cap rate
- 8.25%
- Cash-on-cash
- 6.97%
- DSCR
- 1.31
- GRM
- 7.1
CMA / ARV
- ARV (on-the-fly)
- $245,436
- Comps found
- 12
Show comp detail 12 sales within ~0.75 mi
| Address | Dist | Beds/Ba | Sqft | Sold | Price | $/sf | Match |
|---|---|---|---|---|---|---|---|
| 11137 Jackson St | 0.06mi | 3/1.0 | 1,163 (-14%) | 1mo | $230,000 | $198 | 70 |
| 42107 Lincoln St | 0.06mi | 3/1.0 | 1,163 (-14%) | 2mo | $227,900 | $196 | 70 |
| 10705 Van Buren St | 0.22mi | 3/1.5 | 1,199 (-12%) | 3mo | $227,000 | $189 | 68 |
| 10819 Buchanan St | 0.17mi | 3/1.0 | 1,163 (-14%) | 0mo | $235,000 | $202 | 66 |
| 41527 Hamlin St | 0.54mi | 3/1.0 | 1,380 (+2%) | 7mo | $198,800 | $144 | 64 |
| 10955 Buchanan St | 0.09mi | 3/2.0 | 1,527 (+13%) | 18mo | $166,000 | $109 | 58 |
| 9952 Kennedy St | 0.50mi | 3/1.0 | 1,430 (+6%) | 9mo | $235,000 | $164 | 58 |
| 9985 Jackson Ln | 0.45mi | 3/1.0 | 1,470 (+8%) | 8mo | $260,000 | $177 | 57 |
| 9626 Hamilton St | 0.73mi | 3/1.0 | 1,380 (+2%) | 13mo | $250,000 | $181 | 50 |
| 9675 Jackson St | 0.73mi | 4/1.5 (+1) | 1,353 (-0%) | 13mo | $265,000 | $196 | 49 |
| 42000 Arthur St | 0.29mi | 4/1.0 (+1) | 1,163 (-14%) | 16mo | $185,000 | $159 | 42 |
| 9870 Fairbanks St | 0.59mi | 3/2.0 | 1,530 (+13%) | 17mo | $232,000 | $152 | 35 |
Match score weights: distance 35% · size 25% · config 20% · recency 20%. Top-matched comps best support the ARV.
Projected returns pro-forma
-3.0% appreciation · 3.64% rent growth · sell at horizon
- IRR
- -4.8%
- Equity multiple
- 0.82×
- Total profit
- $-7,531
- Equity at exit
- $22,351
- IRR
- 5.8%
- Equity multiple
- 1.44×
- Total profit
- $18,532
- Equity at exit
- $12,961
Cash invested: $41,972 (down + closing). Projections, not guarantees.
Landlord ↔ Tenant lean methodology
- Overall (STATE)
- 62 Landlord-Friendly
- State Michigan
- 62 Landlord-Friendly · EVEN
- County
- — inherits STATE
- City
- — inherits STATE
ZIP-level market 48111
- Rents YoY
- 3.6%
- Active inventory
- 216
- Price-to-rent
- 7.1×
Monthly cashflow live
- Estimated rent
- $1,752 medium interval (Pro) →
- Mortgage (P&I)
- −$786
- Tax from tax record
- −$292 /mo · $3,499/yr
- Insurance
- −$62
- HOA
- −$0
- Vacancy / Maint / Mgmt
- −$368
- Net cashflow
- $244
Break-even live
UW: 25.0% down · 7.5% · 30yr · 1.5% tax · 5.0% vac · 8.0% maint · 8.0% mgmt
Financing live
Cash to close
- Down payment
- $37,475
- Closing costs
- $4,497
- Reserves months
- —
- Total cash needed
- —
Loan-product check · same deal, 3 products live
Conventional
25% down · 7.5% · 30yr
- Down + closing
- —
- Monthly P&I
- —
- Monthly cashflow
- —
- DSCR
- —
- Eligible?
- —
Personal DTI + credit; lowest rate.
DSCR
20% down · 8.5% · 30yr
- Down + closing
- —
- Monthly P&I
- —
- Monthly cashflow
- —
- DSCR
- —
- Eligible?
- —
No personal income docs; deal must DSCR.
Hard money
10% down · 12.0% · 12mo
- Down + closing
- —
- Monthly P&I
- —
- Monthly cashflow
- —
- DSCR
- —
- Eligible?
- —
Short-term bridge; refi at stabilization.
Rent comps 3 comps
| Address | Beds | Baths | Sqft | Rent | $/sqft | DOM | Units | Dist |
|---|---|---|---|---|---|---|---|---|
| 10910 Independence Ln Belleville, MI | 1.0–2.0 | 1.0 | 925 | $1,524 | $1.65 | 2d | 20 | 0.36mi |
| 10830 Oak Ln Belleville, MI | 1.0–2.0 | 1.0 | 820 | $1,536 | $1.87 | 2d | 45 | 0.53mi |
| 9916 Kennedy St Van Buren Township, MI | 4.0 | 1.5 | 1199 | $2,200 | $1.83 | 2d | 1 | 0.55mi |
Listing history 10 events
-
2026-06-18days on market $149,900 Active 15 DOM
-
2026-06-17days on market $149,900 Active 14 DOM
-
2026-06-16days on market $149,900 Active 13 DOM
-
2026-06-15days on market $149,900 Active 12 DOM
-
2026-06-13days on market $149,900 Active 10 DOM
-
2026-06-09days on market $149,900 Active 6 DOM
-
2026-06-08days on market $149,900 Active 5 DOM
-
2026-06-07days on market $149,900 Active 4 DOM
-
2026-06-04remarks 699-char remark
-
2026-06-04$149,900 Active 1 DOM
ⓘ Source: listings_history table (triggers on properties + properties_extension) + one-shot
backfill from property_details.listing_events for pre-trigger history.
Tax reassessment forecast MI · Partial reset (capped growth)
- Current annual tax
- $3,499 · $292/mo
- Projected year-2 tax
- $3,499 · $292/mo
- Expected delta
- $0/yr ($0/mo · 0.0%)
ⓘ Screening estimate from a state-policy table — verify with the county assessor before closing.
Climate risk First Street
- Flood 1/10 Low FEMA zone X (unshaded) · 0% chance over 30 yrs
- Wildfire 3/10 Moderate
- Heat 3/10 Moderate 7 d/yr ≥98°F today · 15 d/yr by 30 yrs out
- Wind 2/10 Low
- Air quality 2/10 Low 1 unhealthy d/yr today · 2 by 30 yrs out
Nearby sold comps map
Loading sold comps map…
Walkable amenities ~0.75 mi
Loading nearby amenities…
Taxation est. · year 1
- Rental income
- $21,023
- − Mortgage interest
- −$8,397
- − Property taxes
- −$3,499
- − Insurance
- −$750
- − Repairs & maintenance
- −$1,682
- − Management
- −$1,682
- − Depreciation
- −$4,361
- Taxable income
- $654
- Est. tax owed @ 24.0%
- −$157
- After-tax cash flow
- $2,770/yr
For passive investors: Depreciation is non-cash, so a rental often shows a tax loss while cash-flowing — sheltering income. Rental losses are passive: they offset passive income freely, and up to $25,000/yr can offset ordinary (W-2) income if you actively participate and your MAGI is under $100k (phasing out to $0 by $150k); unused losses carry forward. On sale, claimed depreciation is recaptured at up to 25%, and gains may owe capital-gains tax (a 1031 exchange can defer both). Figures are a year-1 estimate at your 24.0% rate — not tax advice; consult a CPA.
Schools (NCES district)
- District
- Van Buren Public Schools
- NCES district ID
- 2634560
- Math proficiency
- 33% ▲ 6.00%
- Reading proficiency
- 43% ▲ 6.00%
- Median HH income
- $54,166
- Composite
- 33.2/100
- National rank
- #5533
- State rank
- #228 of 540 in MI
Livability — Van Buren
No livability data for this city. (Only ~50 U.S. cities are tracked.)
Census & demographics
- County
- Wayne County · 1,562,939 people
- Metro
- Detroit-Warren-Dearborn, MI
- Population (ZIP)
- 44,709
- Household income
- $76,595
- Rent vs Own
- Severe rent burden
- 1200.0
Population outlook (Wayne County) Hauer SSP2
- Today (2025)
- 1,675,273 people
- By 2030
- 1,620,300 · -3.3%
- By 2040
- 1,502,341 · -10.3%
- By 2050
- 1,384,039 · -17.4%
- By 2075
- 1,124,592 · -32.9%
- By 2100
- 881,193 · -47.4%
Race, ethnicity, and origin ACS 2023
- Neighborhood character
- Predominantly White (66%)
- Race & ethnicity
- White 66% Black 22% Two or more races 7% Hispanic / Latino 4% Asian 2%
- Common ancestry
- Romanian 8% Lithuanian 3% Slovak 3%
- Foreign-born
- 4% · Canada
- Languages at home
- 95% English-only · Spanish 1% Other Indo-European 1% Arabic 1%
Political lean MEDSL · Wayne
- 2024 margin
- Strong D (+29.0) · D 62.7% · R 33.7% · Other 3.6%
- 2008→2024 swing
- -20.5pp toward R · 2008: 49.5pp · 2024: 29.0pp
- All cycles
- 2024: D+29.0 2020: D+38.1 2016: D+37.3 2012: D+46.9 2008: D+49.5
Not yet ingested
- Civics
- —
Market trends
- HPI YoY
- ▼ -238.11%
- Current HPI
- 236.4458
- Rent YoY
- ▲ 3.64%
- Metro
- Detroit-Warren-Dearborn, MI
- State GDP YoY
- ▲ 1.37%
- F500 in state
- 28
Industry mix (Fortune 500 HQ in MI)
| Industry | F500 HQs | Revenue |
|---|---|---|
| Automotive Parts | 3 | $48B |
|
||
| Automotive | 2 | $372B |
|
||
| Chemicals | 1 | $45B |
|
||
| Automotive Retail | 1 | $29B |
|
||
| Healthcare / Medical Devices | 1 | $23B |
|
||
| Automotive Technology | 1 | $20B |
|
||
Price history
+13.6% since first listed9 events — show timeline
- 2026-06-03 Listed $149,900 REALCOMP
- 2026-06-03 Listed $149,900 MiRealSource-MiMLS
- 2025-12-18 Listing Removed — REALCOMP
- 2025-12-18 Listing Removed — MiRealSource-MiMLS
- 2025-09-18 Price Changed $199,900 MiRealSource-MiMLS
- 2025-09-18 Price Changed $199,900 REALCOMP
- 2025-08-12 Listed $205,000 REALCOMP
- 2025-08-12 Listed $205,000 MiRealSource-MiMLS
- 2017-09-28 Sold (Public Records) $132,000 Public Records
Property tax history
+9.0%/yrLatest (2025): $3,499 · +116.5% YoY. Source: county tax records.
Cash-flow waterfall
monthlySold comps — $/sqft
last 12 mo · ≤1 miLoading sold comps…