 🏷️ Likely Rental
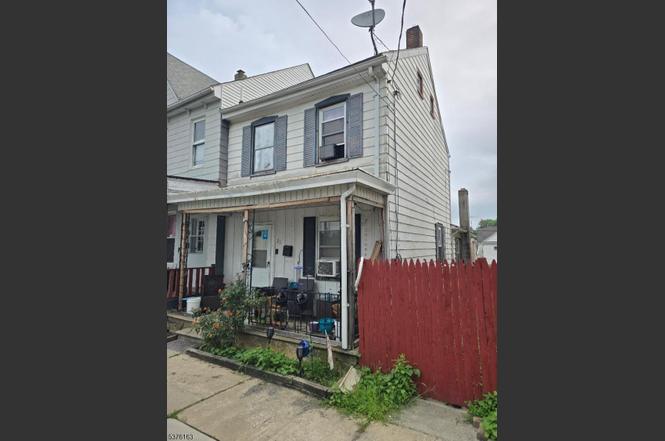
21 Railroad Ave · Phillipsburg, NJ
Flood risk 1/10 · Minimal
- FEMA flood zone
- X (unshaded)
- Chance of flooding over 30 yrs
- 0.0%
- Est. flood insurance / yr
- $507 – $1,088
Fire risk 1/10 · Minimal
- Est. fire insurance / yr
- $526 – $976
Heat risk 5/10 · Moderate
- Hot days now (above 100°F)
- 7 days/yr
- Hot days in 30 yrs
- 15 days/yr
Wind risk 4/10 · Minor
- Chance of severe wind over 30 yrs
- 15.0%
Air-quality risk 3/10 · Minor
- Unhealthy air days now
- 3 days/yr
- Unhealthy air days in 30 yrs
- 5 days/yr
Risk factors via First Street. Map © Google.
Why this score? — see what drove the B+ grade
The composite is a weighted blend of 9 inputs, each scored 0–100. Each bar is that input's sub-score; the figure is the points it added to the 100-point composite (weight × sub-score).
- Cash flow +27.8/30.0
- ARV discount +15.0/15.0
- DSCR +9.8/10.0
- 1% rule +8.1/10.0
- Appreciation +5.0/10.0
- Livability +3.8/5.0
- Rent growth +2.5/5.0
- Condition / age +2.5/5.0
- Schools +2.3/10.0
$159,900
🖨 Deal sheet (PDF) 📄 Offer letter ✓ Due diligence
Listing remarks
Spacious 3-bedroom end-of-row home in Phillipsburg with bonus finished attic for additional living space or storage. 1 full bath. Home is livable and has a long-term tenant currently under market rent, but tenant is aware and prepared for a rent increase. Property needs TLC and cosmetic updates, but all mechanicals are in good working order. Features include a fenced backyard, 2-car off-street parking via rear alley, a welcoming front porch, and location on a quiet one-way street. Not a distress sale, but property is being sold as-is. Great opportunity for investors or buyers looking to add value with some updates.
Key facts
- Finished attic
- Front porch
- Quiet one-way street
Tags
Neighborhood map
What this means for you Summary
Snapshot
- This is a 3-bed/1.0-bath single-family listed at $160k.
Deal economics
- At list price, monthly cash flow is $487 ($6k/yr) — positive.
- The deal already cash-flows at list — no discount required.
- Meets the 1% rule at list price ($2k rent vs $160k).
- Recommended offer: $141k (12.0% below list) — sets the bar for market timing.
- Cap rate 9.9% vs local median 4.9% in Phillipsburg — top-decile yield for the area; either an underpriced asset or a hidden risk that comps aren't pricing in. Stress-test before assuming the spread holds.
Location & tenants
- Location reads 76/100 on livability (#135 in NJ, #3,552 nationally) — a middle-class / working-renter tenant base. Strengths: housing A+, health & safety A+, cost of living A; Watch: commute F.
- Phillipsburg School District (suburban): math 17% / reading 37% proficiency, ranked #381 of 472 in NJ (top 81%) — low school quality limits family demand, transient renter base, plan for 1-2y turnover.
- Zoned schools: Phillipsburg Elementary School (math 10% / reading 26%, grade F, #1,049 of 1,303 statewide, top 81%, 595 students, 75% FRL); Phillipsburg Middle School (math 10% / reading 35%, grade F, #379 of 431 statewide, top 89%, 664 students, 70% FRL); Phillipsburg High School (math 27% / reading 51%, grade F, #197 of 399 statewide, top 51%, 1,794 students, 32% FRL) — zoned schools at 59% FRL track the district average.
- Market conditions: 4 active listings in the ZIP; 33 comparable units currently listed for rent nearby; rentals at typical pace (median 23d on market — plan ~3-4 weeks tenant-placement turnaround); 630 units permitted in Warren County in 2024 (315 in 5+ unit buildings).
Forward outlook
- In year one you build about $6k of equity ($1k loan paydown + $5k appreciation (3.0% local appreciation)).
- Warren County population projected at -10% by 2050 — secular population decline; favor cash flow + early exit over multi-decade hold.
- At projected returns (3.0% appreciation + 3.0% rent growth), your $45k cash investment doubles in ~4 years — after that, you're playing with house money.
- By year 6, paydown + projected appreciation supports a ~$31k cash-out refi (75% LTV) — recoverable capital for the next deal without selling this one.
Negotiation context
- It's been on market 191 days — a 12% lower offer ($141k) is reasonable based on typical stale-listing flexibility.
- Current owner paid $68k; list at $160k implies a 136% gain — meaningful room to come down on a strong offer.
Risks & watch-outs
- Watch-outs: built in 1900 — expect roof / HVAC / electrical / plumbing capex.
- Climate carrying-cost: extreme-heat days projected 7→15/yr by 2055 (HVAC capex compounding) — expect insurance premiums to compound above CPI over the hold.
Questions for the listing agent
- It's been on market 191 days. Have you received any prior offers? Is the seller open to a 12% concession, seller financing, or rate buy-down credit?
- Built in 1900 — when were the roof, HVAC, electrical panel, plumbing, and water heater last replaced?
- Why hasn't it sold? Are there any deal-killer items the seller is aware of (foundation, flood, title, zoning, code violations)?
- Is there a deadline driving the sale (1031 exchange, divorce, estate, relocation)? That informs how much negotiation room exists.
- What's the average days-on-market for RENTAL listings here right now (not sales)? A rising rental-DOM trend means longer vacancies and softer asking-rent achievability than the comps imply.
- What's the recent tenant-quality profile in this submarket — average credit score on applications, eviction rate, late-payment / NSF rate, and stable-employment percentage? A property-management company in the area should have these aggregated.
- How much new for-sale + rental construction is in the pipeline within 1–3 miles? Heavy new supply typically softens prices + rents 12–24 months out; constrained supply supports both.
Investment metrics
- 1% rule
- 1.31% ✓
- Cap rate
- 9.94%
- Cash-on-cash
- 13.04%
- DSCR
- 1.58
- GRM
- 6.4
CMA / ARV
- ARV (on-the-fly)
- $248,024
- Comps found
- 3
Show comp detail 3 sales within ~0.75 mi
| Address | Dist | Beds/Ba | Sqft | Sold | Price | $/sf | Match |
|---|---|---|---|---|---|---|---|
| 280 Bates St | 0.35mi | 3/1.5 | 1,168 (-3%) | 8mo | $292,000 | $250 | 70 |
| 350 Firth St | 0.09mi | 2/1.0 (-1) | 1,162 (-4%) | 24mo | $150,000 | $129 | 65 |
| 76 Glen Ave | 0.31mi | 4/1.0 (+1) | 1,262 (+5%) | 12mo | $259,900 | $206 | 62 |
Match score weights: distance 35% · size 25% · config 20% · recency 20%. Top-matched comps best support the ARV.
Projected returns pro-forma
3.0% appreciation · 3.0% rent growth · sell at horizon
- IRR
- 19.7%
- Equity multiple
- 2.12×
- Total profit
- $50,320
- Equity at exit
- $71,898
- IRR
- 21.0%
- Equity multiple
- 4.03×
- Total profit
- $135,831
- Equity at exit
- $110,803
Cash invested: $44,772 (down + closing). Projections, not guarantees.
Landlord ↔ Tenant lean methodology
- Overall (STATE)
- 21 Tenant-Leaning
- State New Jersey
- 21 Tenant-Leaning · D+6
- County
- — inherits STATE
- City
- — inherits STATE
ZIP-level market 08865-3211
- Active inventory
- 4
- Price-to-rent
- 6.4×
Monthly cashflow live
- Estimated rent
- $2,096 high interval (Pro) →
- Mortgage (P&I)
- −$839
- Tax from tax record
- −$264 /mo · $3,170/yr
- Insurance
- −$67
- HOA
- −$0
- Vacancy / Maint / Mgmt
- −$440
- Net cashflow
- $487
Break-even live
Sensitivity live
| Price | -10% $577 | -5% $532 | +0% $487 | +5% $441 | +10% $396 |
|---|---|---|---|---|---|
| Rent | -10% $321 | -5% $404 | +0% $487 | +5% $569 | +10% $652 |
| Rate | -1.0pp $567 | -0.5pp $527 | base $487 | +0.5pp $445 | +1.0pp $403 |
UW: 25.0% down · 7.5% · 30yr · 1.5% tax · 5.0% vac · 8.0% maint · 8.0% mgmt
Financing live
Cash to close
- Down payment
- $39,975
- Closing costs
- $4,797
- Reserves months
- —
- Total cash needed
- —
Loan-product check · same deal, 3 products live
Conventional
25% down · 7.5% · 30yr
- Down + closing
- —
- Monthly P&I
- —
- Monthly cashflow
- —
- DSCR
- —
- Eligible?
- —
Personal DTI + credit; lowest rate.
DSCR
20% down · 8.5% · 30yr
- Down + closing
- —
- Monthly P&I
- —
- Monthly cashflow
- —
- DSCR
- —
- Eligible?
- —
No personal income docs; deal must DSCR.
Hard money
10% down · 12.0% · 12mo
- Down + closing
- —
- Monthly P&I
- —
- Monthly cashflow
- —
- DSCR
- —
- Eligible?
- —
Short-term bridge; refi at stabilization.
Rent comps 33 comps
| Address | Beds | Baths | Sqft | Rent | $/sqft | DOM | Units | Dist |
|---|---|---|---|---|---|---|---|---|
| 270 Bates St Phillipsburg, NJ | 2.0 | 1.0 | 1368 | $2,100 | $1.54 | 25d | 1 | 0.34mi |
| 1 Sitgreaves St Unit 3B Phillipsburg, NJ | 2.0 | 1.0 | 900 | $1,650 | $1.83 | 25d | 1 | 0.48mi |
| 1 Sitgreaves St Unit 3B Phillipsburg, NJ | 2.0 | 1.0 | 900 | $1,600 | $1.78 | 4d | 1 | 0.48mi |
| 210 Washington St Phillipsburg, NJ | 4.0 | 1.5 | 1000 | $2,300 | $2.30 | 4d | 1 | 0.48mi |
| 461 Heckman St Phillipsburg, NJ | 1.0–2.0 | 1.0 | 690 | $2,095 | $3.03 | 0d | 6 | 0.54mi |
| 152 S Main St Phillipsburg, NJ | 2.0 | 1.0 | 900 | $1,650 | $1.83 | 25d | 1 | 0.65mi |
| 355 Thomas St Phillipsburg, NJ | 3.0 | 1.5 | 1400 | $2,250 | $1.61 | 12d | 1 | 0.69mi |
| 689 Sayre Ave Phillipsburg, NJ | 4.0 | 1.5 | 1376 | $2,200 | $1.60 | 4d | 1 | 0.70mi |
| 75 S Main St Phillipsburg, NJ | 1.0–2.0 | 1.0–2.0 | 847 | $2,239 | $2.64 | 4d | 4 | 0.71mi |
| 43-45 S Main St Unit 3 Phillipsburg, NJ | 3.0 | 2.0 | 1200 | $2,200 | $1.83 | 25d | 1 | 0.73mi |
| 100 Northampton St Easton, PA | 1.0–2.0 | 1.0–2.0 | 995 | $3,650 | $3.67 | 4d | 6 | 0.92mi |
| 49 N Delaware Dr Unit 3rd Floor Easton, PA | 2.0 | 1.0 | 1500 | $2,495 | $1.66 | 20d | 1 | 0.93mi |
| 11 S 2nd St Unit 10 Easton, PA | 2.0 | 1.0 | 800 | $1,500 | $1.88 | 45d | 1 | 1.02mi |
| 214 Spring Garden St Unit 2B Easton, PA | 2.0 | 1.0 | 1250 | $2,995 | $2.40 | 22d | 1 | 1.05mi |
| 201 Cattell St Unit 5 Easton, PA | 3.0 | 1.0 | 800 | $1,600 | $2.00 | 4d | 1 | 1.06mi |
| 215 Cattell St Unit 2nd Floor Easton, PA | 2.0 | 1.0 | 1000 | $1,600 | $1.60 | 25d | 1 | 1.07mi |
| 218 Cattell St Unit B Easton, PA | 2.0 | 1.0 | 800 | $1,600 | $2.00 | 45d | 1 | 1.09mi |
| 226 Vista Dr Easton, PA | 3.0 | 1.5 | 1358 | $2,195 | $1.62 | 4d | 1 | 1.09mi |
| 330 Northampton St Unit 205 Easton, PA | 2.0 | 2.0 | 1088 | $1,750 | $1.61 | 25d | 1 | 1.18mi |
| 330 Northampton St Easton, PA | 2.0 | 2.0 | 1088 | $1,750 | $1.61 | 45d | 1 | 1.18mi |
| 140 S 4th St Easton, PA | 2.0 | 1.0–2.0 | 841 | $2,460 | $2.93 | 4d | 106 | 1.22mi |
| 417 McCartney St Unit 1 Easton, PA | 2.0 | 1.0 | 750 | $1,750 | $2.33 | 45d | 1 | 1.22mi |
| 513 Spruce St Easton, PA | 2.0 | 1.0 | 850 | $1,600 | $1.88 | 45d | 1 | 1.35mi |
| 40 S 6th St Easton, PA | 1.0–2.0 | 1.0–2.0 | 1156 | $3,000 | $2.59 | 15d | 11 | 1.37mi |
| 601 Northampton St Unit 202 Easton, PA | 2.0 | 1.0 | 750 | $1,795 | $2.39 | 15d | 1 | 1.40mi |
| 601 Northampton St Unit 402 Easton, PA | 2.0 | 1.0 | 750 | $1,795 | $2.39 | 45d | 1 | 1.40mi |
| 700 Hamilton St Unit 2 Easton, PA | 4.0 | 2.0 | 1050 | $2,000 | $1.90 | 4d | 1 | 1.42mi |
| 142 S Union St Easton, PA | 3.0 | 2.0 | 1300 | $1,895 | $1.46 | 45d | 1 | 1.43mi |
| 623 Walnut St Unit A2 Easton, PA | 2.0 | 2.0 | 1500 | $2,250 | $1.50 | 25d | 1 | 1.45mi |
| 623 Walnut St Unit C2 Easton, PA | 2.0 | 2.5 | 1500 | $2,300 | $1.53 | 45d | 1 | 1.45mi |
| 199 Cedar Park Blvd Easton, PA | 1.0–3.0 | 1.0–4.0 | 1410 | $3,077 | $2.18 | 0d | 9 | 1.46mi |
| 276 W Saint Joseph St Easton, PA | 3.0 | 1.5 | 1315 | $1,700 | $1.29 | 45d | 1 | 1.46mi |
| 839 McCartney St Unit 2nd Floor Easton, PA | 3.0 | 1.0 | 828 | $1,700 | $2.05 | 4d | 1 | 1.47mi |
Listing history 6 events
-
2026-02-11status Under Contract
-
2025-11-13price $159,900
-
2025-09-03price $179,900
-
2025-08-04$200,000 Active
-
2022-07-06soldstatus $67,800
-
2001-11-09soldstatus $60,000
ⓘ Source: listings_history table (triggers on properties + properties_extension) + one-shot
backfill from property_details.listing_events for pre-trigger history.
Tax reassessment forecast NJ · Partial reset (capped growth)
- Current annual tax
- $3,170 · $264/mo
- Projected year-2 tax
- $3,576 · $298/mo
- Expected delta
- +$406/yr (+$34/mo · 12.8%)
ⓘ Screening estimate from a state-policy table — verify with the county assessor before closing.
Climate risk First Street
- Flood 1/10 Low FEMA zone X (unshaded) · 0% chance over 30 yrs
- Wildfire 1/10 Low
- Heat 5/10 Major 7 d/yr ≥100°F today · 15 d/yr by 30 yrs out
- Wind 4/10 Moderate 15% chance of damaging wind over 30 yrs
- Air quality 3/10 Moderate 3 unhealthy d/yr today · 5 by 30 yrs out
Nearby sold comps map
Loading sold comps map…
Walkable amenities ~0.75 mi
Loading nearby amenities…
Taxation est. · year 1
- Rental income
- $25,152
- − Mortgage interest
- −$8,957
- − Property taxes
- −$3,170
- − Insurance
- −$800
- − Repairs & maintenance
- −$2,012
- − Management
- −$2,012
- − Depreciation
- −$4,652
- Taxable income
- $3,550
- Est. tax owed @ 24.0%
- −$852
- After-tax cash flow
- $4,986/yr
For passive investors: Depreciation is non-cash, so a rental often shows a tax loss while cash-flowing — sheltering income. Rental losses are passive: they offset passive income freely, and up to $25,000/yr can offset ordinary (W-2) income if you actively participate and your MAGI is under $100k (phasing out to $0 by $150k); unused losses carry forward. On sale, claimed depreciation is recaptured at up to 25%, and gains may owe capital-gains tax (a 1031 exchange can defer both). Figures are a year-1 estimate at your 24.0% rate — not tax advice; consult a CPA.
Schools (NCES district)
- District
- Phillipsburg School District
- NCES district ID
- 3412960
- Math proficiency
- 17% ▼ -15.00%
- Reading proficiency
- 37% ▼ -9.00%
- Median HH income
- $45,364
- Composite
- 23.2/100
- National rank
- #7943
- State rank
- #381 of 472 in NJ
Livability — Phillipsburg
- Score
- 76/100
- State rank
- #135
- US rank
- #3552
Category grades
Schools grade is shown separately in the Schools card above.
Census & demographics
- Census place
- Phillipsburg, NJ
Population outlook (Warren County) Hauer SSP2
- Today (2025)
- 105,498 people
- By 2030
- 103,974 · -1.4%
- By 2040
- 99,748 · -5.5%
- By 2050
- 94,535 · -10.4%
- By 2075
- 87,220 · -17.3%
- By 2100
- 80,421 · -23.8%
Not yet ingested
- Political lean
- —
- Race & ethnicity
- —
- Common origin
- —
- Civics
- —
Market trends
- HPI YoY
- —
- Current HPI
- —
- Rent YoY
- —
- Metro
- —
- State GDP YoY
- ▲ 2.05%
- F500 in state
- 34
Industry mix (Fortune 500 HQ in NJ)
| Industry | F500 HQs | Revenue |
|---|---|---|
| Consumer Goods | 3 | $31B |
|
||
| Pharmaceuticals | 2 | $153B |
|
||
| Technology | 2 | $21B |
|
||
| Insurance | 2 | $20B |
|
||
| Healthcare | 2 | $19B |
|
||
| Financial Services | 1 | $70B |
|
||
Price history
+166.5% since first listed6 events — show timeline
- 2026-02-11 Pending — GSMLS
- 2025-11-13 Price Changed $159,900 GSMLS
- 2025-09-03 Price Changed $179,900 GSMLS
- 2025-08-04 Listed $200,000 GSMLS
- 2022-07-06 Sold (Public Records) $67,800 Public Records
- 2001-11-09 Sold (Public Records) $60,000 Public Records
Property tax history
+1.7%/yrLatest (2025): $3,170 · +2.9% YoY. Source: county tax records.
Cash-flow waterfall
monthlySold comps — $/sqft
last 12 mo · ≤1 miLoading sold comps…