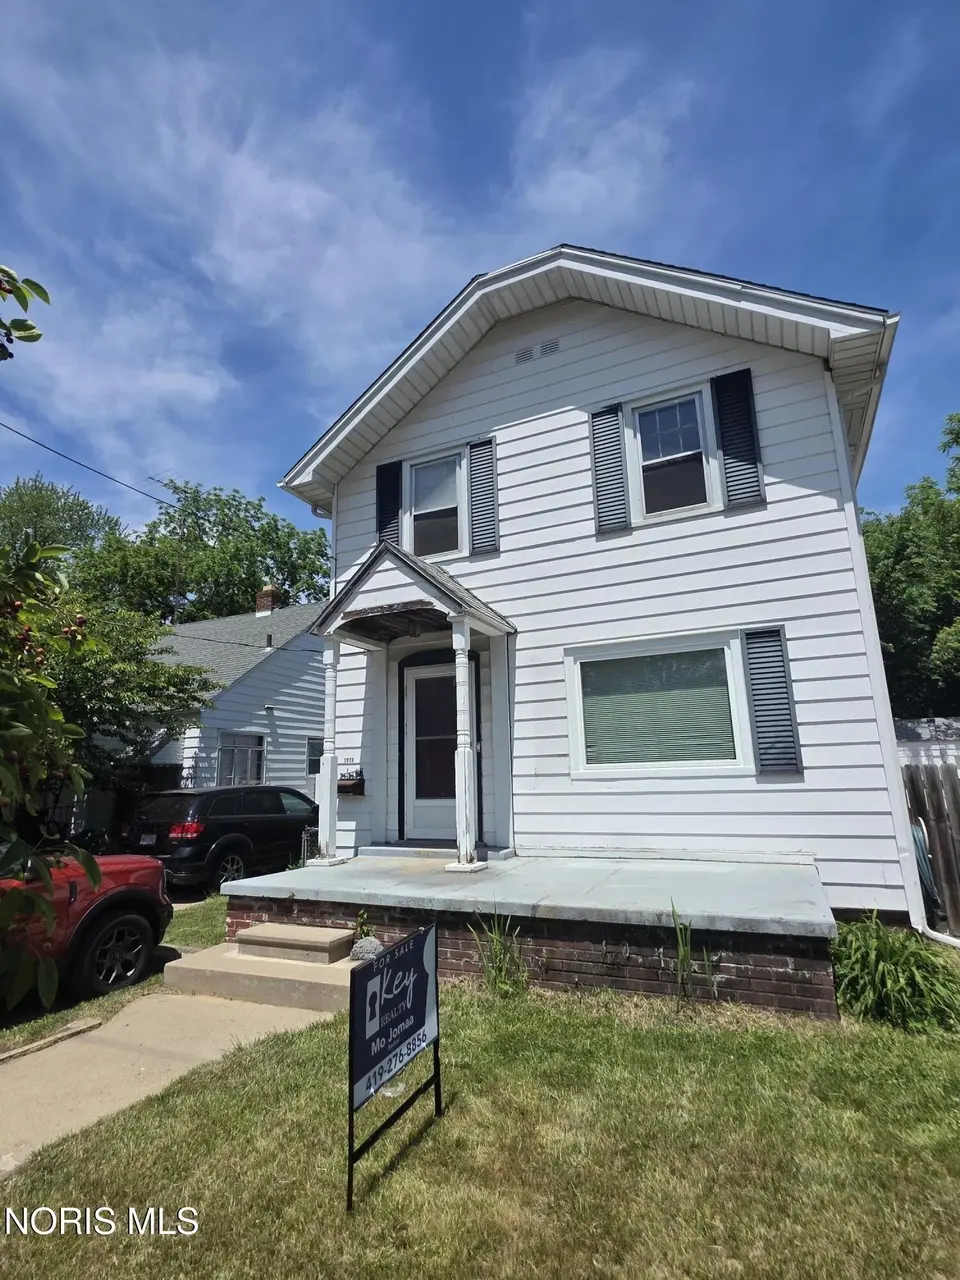
1916 Berdan Ave · Toledo, OH
Flood risk 6/10 · Moderate
- FEMA flood zone
- X (unshaded)
- Chance of flooding over 30 yrs
- 0.72%
- Est. flood insurance / yr
- $473 – $860
Fire risk 1/10 · Minimal
- Est. fire insurance / yr
- $713 – $1,323
Heat risk 3/10 · Minor
- Hot days now (above 101°F)
- 7 days/yr
- Hot days in 30 yrs
- 16 days/yr
Wind risk 2/10 · Minimal
- Chance of severe wind over 30 yrs
- —
Air-quality risk 2/10 · Minimal
- Unhealthy air days now
- 1 days/yr
- Unhealthy air days in 30 yrs
- 3 days/yr
Risk factors via First Street. Map © Google.
Why this score? — see what drove the B- grade
The composite is a weighted blend of 9 inputs, each scored 0–100. Each bar is that input's sub-score; the figure is the points it added to the 100-point composite (weight × sub-score).
- Cash flow +25.5/30.0
- ARV discount +15.0/15.0
- DSCR +8.5/10.0
- 1% rule +6.6/10.0
- Rent growth +3.3/5.0
- Livability +3.3/5.0
- Condition / age +2.5/5.0
- Schools +1.6/10.0
- Appreciation +0.0/10.0
$106,800
🖨 Deal sheet (PDF) 📄 Offer letter ✓ Due diligence
Listing remarks
Charming starter home or excellent investment opportunity! This property features beautiful hardwood floors throughout and plenty of potential to make it your own with personal updates and renovations. Spacious basement offers additional room to finish for extra living space, recreation, or storage. Enjoy the large yard and ample storage with the detached car garage. A great opportunity with solid bones and endless possibilities!
Key facts
- Large yard
- Spacious basement
- Hardwood floors
Tags
Property features AI
Finance
- Other: Living area approximately 1,257; Lot about 0.07 acre (3,100 sq ft)
Exterior
- Parking: Detached garage (1 garage space); Driveway; Additional parking (6 parking spaces total)
- Utilities: Public water; Public sewer; Cable available
- Home design: Single-family residence; Two-story home; No attached units; No common walls
- Construction: Vinyl siding exterior; Shingle roof
- Exterior features: Shingle roof; Vinyl siding; Side lot parcel included
Interior
- Kitchen: Electric oven; Gas range connection; Refrigerator
- Bedrooms: Three upper-level bedrooms (approx. 10x8, 8x6, 8x6)
- Flooring: Wood flooring
- Bathrooms: One full bathroom; One half bathroom (1.5 total)
- Heating & cooling: Forced-air heating; Central air conditioning
- Interior features: Ceiling fans; Cove ceilings; Crown molding; Has basement; 8 total rooms
- Laundry & utility: Washer and dryer; Laundry located in basement
Neighborhood map
What this means for you Summary
Snapshot
- This is a 3-bed/1.5-bath single-family listed at $107k.
Deal economics
- At list price, monthly cash flow is $250 ($3k/yr) — positive.
- The deal already cash-flows at list — no discount required.
- Meets the 1% rule at list price ($1k rent vs $107k).
- Recommended offer: $105k (1.5% below list) — sets the bar for market timing.
- Cap rate 9.1% vs local median 7.5% in Toledo — meaningfully above typical; check what's discounted (condition, days-on-market, listing class) to confirm the premium yield is real.
Location & tenants
- Location reads 66/100 on livability (#645 in OH) — a middle-class / working-renter tenant base. Strengths: cost of living A+, housing A+, health & safety A+; Watch: amenities C-, crime F, commute F.
- Toledo City (urban): math 15% / reading 24% proficiency, ranked #634 of 656 in OH (top 97%) — low school quality limits family demand, transient renter base, plan for 1-2y turnover; 72% free/reduced lunch — lower-income household profile, screen leases tightly.
- Zoned schools: Deveaux Elementary School (math 13% / reading 16%, grade F, #1,400 of 1,584 statewide, top 90%, 475 students, 0% FRL); Start High School (math 11% / reading 33%, grade F, #672 of 781 statewide, top 86%, 1,242 students, 50% FRL) — zoned schools average 25% FRL vs 72% district-wide (47 pts lower); this property's tenant base skews higher-income than the district average.
- Market conditions: Rents rising (+3.3%/yr); 118 active listings in the ZIP; 40 comparable units currently listed for rent nearby; rentals at typical pace (median 25d on market — plan ~3-4 weeks tenant-placement turnaround); 45% of comp listings sitting > 30 days — soft ceiling on asking rent; 415 units permitted in Lucas County in 2024 (122 in 5+ unit buildings).
Forward outlook
- Local home prices are declining (-3.0%/yr); year-one equity from $738 of loan paydown is wiped out by about $3k of value loss. Plan a longer hold.
- Lucas County population projected at -16% by 2050 — secular population decline; favor cash flow + early exit over multi-decade hold.
Negotiation context
- It's been on market 17 days — a 2% lower offer ($105k) is reasonable based on typical stale-listing flexibility.
- 2 sale attempts since 11y ago with the ask held roughly flat each time — persistent listings suggest the price (not the market) is what's stuck; bring a comps-based counter.
- Current owner paid $42k; list at $107k implies a 154% gain — meaningful room to come down on a strong offer.
Risks & watch-outs
- Watch-outs: built in 1926 — expect roof / HVAC / electrical / plumbing capex.
- Climate carrying-cost: major flood risk — expect insurance premiums to compound above CPI over the hold.
Questions for the listing agent
- Built in 1926 — when were the roof, HVAC, electrical panel, plumbing, and water heater last replaced?
- Is there a deadline driving the sale (1031 exchange, divorce, estate, relocation)? That informs how much negotiation room exists.
- Schools are D-rated, which usually means shorter tenancies and higher turnover. Who's the typical renter profile here, and what's been the actual vacancy rate?
- Crime grade is F in this area — have there been break-ins, vandalism, or insurance claims at this property in the last 3 years? What carrier currently insures it and at what premium?
- What's the average days-on-market for RENTAL listings here right now (not sales)? A rising rental-DOM trend means longer vacancies and softer asking-rent achievability than the comps imply.
- What's the recent tenant-quality profile in this submarket — average credit score on applications, eviction rate, late-payment / NSF rate, and stable-employment percentage? A property-management company in the area should have these aggregated.
- How much new for-sale + rental construction is in the pipeline within 1–3 miles? Heavy new supply typically softens prices + rents 12–24 months out; constrained supply supports both.
Investment metrics
- 1% rule
- 1.16% ✓
- Cap rate
- 9.10%
- Cash-on-cash
- 10.01%
- DSCR
- 1.45
- GRM
- 7.2
CMA / ARV
- ARV (on-the-fly)
- $148,326
- Comps found
- 12
Show comp detail 12 sales within ~0.75 mi
| Address | Dist | Beds/Ba | Sqft | Sold | Price | $/sf | Match |
|---|---|---|---|---|---|---|---|
| 3664 Sherbrooke Rd | 0.39mi | 3/1.0 | 1,255 (-0%) | 1mo | $149,000 | $119 | 79 |
| 1936 Mansfield St | 0.22mi | 3/1.0 | 1,168 (-7%) | 1mo | $79,900 | $68 | 75 |
| 3424 Saint Bernard Dr | 0.53mi | 3/1.5 | 1,281 (+2%) | 1mo | $154,400 | $121 | 71 |
| 1805 Tremainsville Rd | 0.37mi | 3/1.5 | 1,152 (-8%) | 1mo | $92,000 | $80 | 68 |
| 3725 Kershaw Ave | 0.60mi | 3/1.5 | 1,225 (-2%) | 1mo | $145,000 | $118 | 67 |
| 2014 Barrows St | 0.13mi | 3/1.0 | 1,069 (-15%) | 1mo | $110,000 | $103 | 66 |
| 1822 Wychwood St | 0.39mi | 3/1.0 | 1,162 (-8%) | 2mo | $84,000 | $72 | 66 |
| 3818 Sherbrooke Rd | 0.25mi | 3/1.0 | 1,409 (+12%) | 1mo | $180,704 | $128 | 66 |
| 3656 Anderson Pkwy | 0.64mi | 3/1.0 | 1,180 (-6%) | 2mo | $167,000 | $142 | 56 |
| 3621 Sherbrooke Rd | 0.48mi | 3/2.0 | 1,119 (-11%) | 2mo | $92,500 | $83 | 56 |
| 3515 Watson Ave | 0.66mi | 3/2.0 | 1,157 (-8%) | 1mo | $150,000 | $130 | 54 |
| 1811 Giant St | 0.67mi | 3/1.0 | 1,069 (-15%) | 1mo | $70,000 | $65 | 41 |
Match score weights: distance 35% · size 25% · config 20% · recency 20%. Top-matched comps best support the ARV.
Projected returns pro-forma
-3.0% appreciation · 3.3% rent growth · sell at horizon
- IRR
- -0.9%
- Equity multiple
- 0.97×
- Total profit
- $-1,029
- Equity at exit
- $15,924
- IRR
- 9.1%
- Equity multiple
- 1.71×
- Total profit
- $21,159
- Equity at exit
- $9,234
Cash invested: $29,904 (down + closing). Projections, not guarantees.
Landlord ↔ Tenant lean methodology
- Overall (STATE)
- 73 Landlord-Friendly
- State Ohio
- 73 Landlord-Friendly · R+6
- County
- — inherits STATE
- City
- — inherits STATE
ZIP-level market 43613
- Home prices YoY
- -20.7%
- Rents YoY
- 3.3%
- Active inventory
- 118
- Price-to-rent
- 7.2×
Monthly cashflow live
- Estimated rent
- $1,236 high interval (Pro) →
- Mortgage (P&I)
- −$560
- Tax from tax record
- −$122 /mo · $1,466/yr
- Insurance
- −$44
- HOA
- −$0
- Vacancy / Maint / Mgmt
- −$260
- Net cashflow
- $250
Break-even live
Sensitivity live
| Price | -10% $310 | -5% $280 | +0% $250 | +5% $219 | +10% $189 |
|---|---|---|---|---|---|
| Rent | -10% $152 | -5% $201 | +0% $250 | +5% $298 | +10% $347 |
| Rate | -1.0pp $303 | -0.5pp $277 | base $250 | +0.5pp $222 | +1.0pp $194 |
UW: 25.0% down · 7.5% · 30yr · 1.5% tax · 5.0% vac · 8.0% maint · 8.0% mgmt
Financing live
Cash to close
- Down payment
- $26,700
- Closing costs
- $3,204
- Reserves months
- —
- Total cash needed
- —
Loan-product check · same deal, 3 products live
Conventional
25% down · 7.5% · 30yr
- Down + closing
- —
- Monthly P&I
- —
- Monthly cashflow
- —
- DSCR
- —
- Eligible?
- —
Personal DTI + credit; lowest rate.
DSCR
20% down · 8.5% · 30yr
- Down + closing
- —
- Monthly P&I
- —
- Monthly cashflow
- —
- DSCR
- —
- Eligible?
- —
No personal income docs; deal must DSCR.
Hard money
10% down · 12.0% · 12mo
- Down + closing
- —
- Monthly P&I
- —
- Monthly cashflow
- —
- DSCR
- —
- Eligible?
- —
Short-term bridge; refi at stabilization.
Rent comps 40 comps
| Address | Beds | Baths | Sqft | Rent | $/sqft | DOM | Units | Dist |
|---|---|---|---|---|---|---|---|---|
| 3683 Upton Ave Toledo, OH | 3.0 | 1.0 | 1119 | $1,100 | $0.98 | 45d | 1 | 0.14mi |
| 1846 Loxley Rd Toledo, OH | 2.0 | 1.0 | 876 | $900 | $1.03 | 45d | 1 | 0.19mi |
| 1731 Mansfield Rd Toledo, OH | 3.0 | 1.0 | 1138 | $1,195 | $1.05 | 25d | 1 | 0.33mi |
| 2301 Portsmouth Ave Toledo, OH | 4.0 | 1.0 | 1335 | $1,395 | $1.04 | 25d | 1 | 0.48mi |
| 1489 Berdan Ave Toledo, OH | 3.0 | 1.0 | 1068 | $1,250 | $1.17 | 45d | 1 | 0.55mi |
| 4315 Garden Park Dr Toledo, OH | 3.0 | 1.0 | 1268 | $1,423 | $1.12 | 25d | 1 | 0.58mi |
| 4038 Lyman Ave Toledo, OH | 3.0 | 1.0 | 1175 | $1,395 | $1.19 | 45d | 1 | 0.62mi |
| 1477 W Sylvania Ave Toledo, OH | 3.0 | 1.0 | 1570 | $1,250 | $0.80 | 45d | 1 | 0.63mi |
| 1838 Giant St Toledo, OH | 3.0 | 1.0 | 962 | $1,200 | $1.25 | 15d | 1 | 0.65mi |
| 1718 Giant St Toledo, OH | 3.0 | 1.0 | 1080 | $1,395 | $1.29 | 15d | 1 | 0.69mi |
| 1804 Bigelow St Toledo, OH | 3.0 | 1.0 | 995 | $937 | $0.94 | 45d | 1 | 0.71mi |
| 4120 Parrakeet Ave Toledo, OH | 3.0 | 2.0 | 1410 | $1,450 | $1.03 | 45d | 1 | 0.72mi |
| 3606 Revere Dr Toledo, OH | 4.0 | 1.0 | 1320 | $1,500 | $1.14 | 45d | 1 | 0.72mi |
| 3713 Hazelhurst Ave Toledo, OH | 3.0 | 1.5 | 1352 | $1,700 | $1.26 | 45d | 1 | 0.74mi |
| 3430 Anderson Pkwy Toledo, OH | 3.0 | 2.0 | 1372 | $1,650 | $1.20 | 25d | 1 | 0.75mi |
| 3644 Harley Rd Toledo, OH | 2.0 | 1.0 | 1025 | $975 | $0.95 | 25d | 1 | 0.77mi |
| 3805 Hoiles Ave Toledo, OH | 3.0 | 1.0 | 1370 | $1,025 | $0.75 | 25d | 1 | 0.81mi |
| 3725 Hoiles Ave Toledo, OH | 3.0 | 1.0 | 1180 | $1,245 | $1.06 | 25d | 1 | 0.81mi |
| 4223 Birchall Rd Toledo, OH | 3.0 | 1.0 | 1338 | $1,395 | $1.04 | 25d | 1 | 0.85mi |
| 3716 Rushland Ave Unit NA Toledo, OH | 3.0 | 1.5 | 1559 | $1,650 | $1.06 | 15d | 1 | 0.89mi |
| 1573 Jermain Dr Toledo, OH | 3.0 | 1.0 | 1254 | $1,195 | $0.95 | 15d | 1 | 0.93mi |
| 3915 Willys Pkwy Unit 3915 Toledo, OH | 3.0 | 1.0 | 1080 | $800 | $0.74 | 22d | 1 | 0.94mi |
| 3541 Willys Pkwy Toledo, OH | 3.0 | 1.0 | 1113 | $1,400 | $1.26 | 45d | 1 | 0.95mi |
| 3835 Monroe St Toledo, OH | 2.0 | 1.0 | 1002 | $950 | $0.95 | 45d | 1 | 0.99mi |
| 4614 Commonwealth Ave Toledo, OH | 3.0 | 1.5 | 1459 | $1,295 | $0.89 | 15d | 1 | 1.00mi |
| 3803 Monroe St Toledo, OH | 2.0 | 1.0 | 942 | $850 | $0.90 | 45d | 1 | 1.03mi |
| 3948 Grantley Rd Toledo, OH | 4.0 | 1.5 | 1600 | $1,500 | $0.94 | 25d | 1 | 1.12mi |
| 4138 N Lockwood Ave Toledo, OH | 2.0 | 1.0 | 1300 | $1,050 | $0.81 | 25d | 1 | 1.12mi |
| 2734 Powhattan Pkwy Toledo, OH | 2.0 | 1.0 | 1144 | $900 | $0.79 | 45d | 1 | 1.19mi |
| 3615 Berkeley Dr Toledo, OH | 3.0 | 1.0 | 1096 | $1,400 | $1.28 | 15d | 1 | 1.20mi |
| 1014 Berdan Ave Toledo, OH | 3.0 | 1.0 | 1215 | $1,200 | $0.99 | 45d | 1 | 1.24mi |
| 4158 Mayfield Dr Toledo, OH | 2.0 | 1.0 | 960 | $850 | $0.89 | 15d | 1 | 1.24mi |
| 4030 Elmhurst Rd Apt 2 Toledo, OH | 2.0 | 1.0 | 875 | $900 | $1.03 | 45d | 1 | 1.26mi |
| 1338 Crestwood Rd Toledo, OH | 3.0 | 1.0 | 1000 | $1,250 | $1.25 | 15d | 1 | 1.28mi |
| 1016 Mallett St Unit 1 Toledo, OH | 2.0 | 1.0 | 1300 | $900 | $0.69 | 45d | 1 | 1.28mi |
| 1436 Palmetto Ave Toledo, OH | 3.0 | 1.0 | 1678 | $1,400 | $0.83 | 25d | 1 | 1.29mi |
| 4459 N Haven Ave Toledo, OH | 3.0 | 1.0 | 1416 | $1,200 | $0.85 | 15d | 1 | 1.31mi |
| 2632 Algonquin Pkwy Toledo, OH | 3.0 | 1.5 | 1568 | $800 | $0.51 | 25d | 1 | 1.31mi |
| 3121 Cheltenham Rd Toledo, OH | 4.0 | 2.0 | 1691 | $1,800 | $1.06 | 45d | 1 | 1.40mi |
| 2650 Christie St Toledo, OH | 1.0–2.0 | 1.0 | 800 | $849 | $1.06 | 45d | 1 | 1.40mi |
Listing history 12 events
-
2026-06-21days on market $106,800 Active 17 DOM
-
2026-06-18days on market $106,800 Active 14 DOM
-
2026-06-17days on market $106,800 Active 13 DOM
-
2026-06-16days on market $106,800 Active 12 DOM
-
2026-06-15days on market $106,800 Active 11 DOM
-
2026-06-14days on market $106,800 Active 9 DOM
-
2026-06-10days on market $106,800 Active 6 DOM
-
2026-06-09days on market $106,800 Active 5 DOM
-
2026-06-08days on market $106,800 Active 4 DOM
-
2026-06-07days on market $106,800 Active 3 DOM
-
2026-06-05remarks 433-char remark
-
2026-06-05$106,800 Active 1 DOM
ⓘ Source: listings_history table (triggers on properties + properties_extension) + one-shot
backfill from property_details.listing_events for pre-trigger history.
Tax reassessment forecast OH · Partial reset (capped growth)
- Current annual tax
- $1,466 · $122/mo
- Projected year-2 tax
- $1,566 · $131/mo
- Expected delta
- +$100/yr (+$8/mo · 6.8%)
ⓘ Screening estimate from a state-policy table — verify with the county assessor before closing.
Climate risk First Street
- Flood 6/10 Major FEMA zone X (unshaded) · 72% chance over 30 yrs
- Wildfire 1/10 Low
- Heat 3/10 Moderate 7 d/yr ≥101°F today · 16 d/yr by 30 yrs out
- Wind 2/10 Low
- Air quality 2/10 Low 1 unhealthy d/yr today · 3 by 30 yrs out
Nearby sold comps map
Loading sold comps map…
Walkable amenities ~0.75 mi
Loading nearby amenities…
Taxation est. · year 1
- Rental income
- $14,829
- − Mortgage interest
- −$5,982
- − Property taxes
- −$1,466
- − Insurance
- −$534
- − Repairs & maintenance
- −$1,186
- − Management
- −$1,186
- − Depreciation
- −$3,107
- Taxable income
- $1,367
- Est. tax owed @ 24.0%
- −$328
- After-tax cash flow
- $2,666/yr
For passive investors: Depreciation is non-cash, so a rental often shows a tax loss while cash-flowing — sheltering income. Rental losses are passive: they offset passive income freely, and up to $25,000/yr can offset ordinary (W-2) income if you actively participate and your MAGI is under $100k (phasing out to $0 by $150k); unused losses carry forward. On sale, claimed depreciation is recaptured at up to 25%, and gains may owe capital-gains tax (a 1031 exchange can defer both). Figures are a year-1 estimate at your 24.0% rate — not tax advice; consult a CPA.
Schools (NCES district)
- District
- Toledo City
- NCES district ID
- 3904490
- Math proficiency
- 15% ▼ -16.00%
- Reading proficiency
- 24% ▼ -13.00%
- Median HH income
- $32,137
- Composite
- 15.76/100
- National rank
- #9276
- State rank
- #634 of 656 in OH
Livability — Toledo
- Score
- 66/100
- State rank
- #645
- US rank
- #11442
Category grades
Schools grade is shown separately in the Schools card above.
Census & demographics
- Census place
- Toledo, OH
- County
- Lucas County · 380,724 people
- City population
- 280,811
- Metro
- Toledo, OH
- Population (ZIP)
- 30,780
- Household income
- $64,384
- Rent vs Own
- Severe rent burden
- 917.0
Population outlook (Lucas County) Hauer SSP2
- Today (2025)
- 420,751 people
- By 2030
- 410,187 · -2.5%
- By 2040
- 384,019 · -8.7%
- By 2050
- 355,125 · -15.6%
- By 2075
- 291,683 · -30.7%
- By 2100
- 233,670 · -44.5%
Race, ethnicity, and origin ACS 2023
- Neighborhood character
- Predominantly White (71%)
- Race & ethnicity
- White 71% Black 15% Two or more races 10% Hispanic / Latino 7%
- Hispanic origin (detail)
- Mexican 5%
- Common ancestry
- Romanian 9% Lithuanian 3% Slovak 1%
- Foreign-born
- 2% · Canada
- Languages at home
- 95% English-only · Spanish 3% Arabic 1%
Political lean MEDSL · Lucas
- 2024 margin
- D (+12.6) · D 55.8% · R 43.2%
- 2008→2024 swing
- -18.9pp toward R · 2008: 31.4pp · 2024: 12.6pp
- All cycles
- 2024: D+12.6 2020: D+16.8 2016: D+17.4 2012: D+30.4 2008: D+31.4
Not yet ingested
- Civics
- —
Market trends
- HPI YoY
- ▼ -62.37%
- Current HPI
- 239.1345
- Rent YoY
- ▲ 3.30%
- Metro
- Toledo, OH
- State GDP YoY
- ▲ 1.98%
- F500 in state
- 48
Industry mix (Fortune 500 HQ in OH)
| Industry | F500 HQs | Revenue |
|---|---|---|
| Insurance | 3 | $145B |
|
||
| Industrial Machinery | 3 | $49B |
|
||
| Financial Services | 3 | $24B |
|
||
| Consumer Goods | 2 | $93B |
|
||
| Aerospace / Defense | 2 | $47B |
|
||
| Utilities | 2 | $33B |
|
||
Price history
+154.3% since first listed4 events — show timeline
- 2026-06-04 Listed $106,800 NORIS
- 2016-08-25 Listing Removed — NORIS
- 2015-08-25 Listed $54,900 NORIS
- 1991-12-13 Sold (Public Records) $42,000 Public Records
Property tax history
+1.9%/yrLatest (2025): $1,466 · -6.1% YoY. Source: county tax records.
Cash-flow waterfall
monthlySold comps — $/sqft
last 12 mo · ≤1 miLoading sold comps…