121 Washington Ave S #915 · Minneapolis, MN
Flood risk 1/10 · Minimal
- FEMA flood zone
- X (unshaded)
- Chance of flooding over 30 yrs
- 0.0%
- Est. flood insurance / yr
- $507 – $1,088
Fire risk 1/10 · Minimal
- Est. fire insurance / yr
- $888 – $1,650
Heat risk 2/10 · Minimal
- Hot days now (above 99°F)
- 7 days/yr
- Hot days in 30 yrs
- 14 days/yr
Wind risk 2/10 · Minimal
- Chance of severe wind over 30 yrs
- —
Air-quality risk 2/10 · Minimal
- Unhealthy air days now
- 1 days/yr
- Unhealthy air days in 30 yrs
- 1 days/yr
Risk factors via First Street. Map © Google.
Why this score? — see what drove the D- grade
The composite is a weighted blend of 9 inputs, each scored 0–100. Each bar is that input's sub-score; the figure is the points it added to the 100-point composite (weight × sub-score).
- ARV discount +7.5/15.0
- Cash flow +6.7/30.0
- 1% rule +5.8/10.0
- Appreciation +4.8/10.0
- Rent growth +3.9/5.0
- Livability +3.9/5.0
- Schools +3.5/10.0
- Condition / age +2.5/5.0
- DSCR +0.9/10.0
$189,900
🖨 Deal sheet (PDF) 📄 Offer letter ✓ Due diligence
Listing remarks MLS
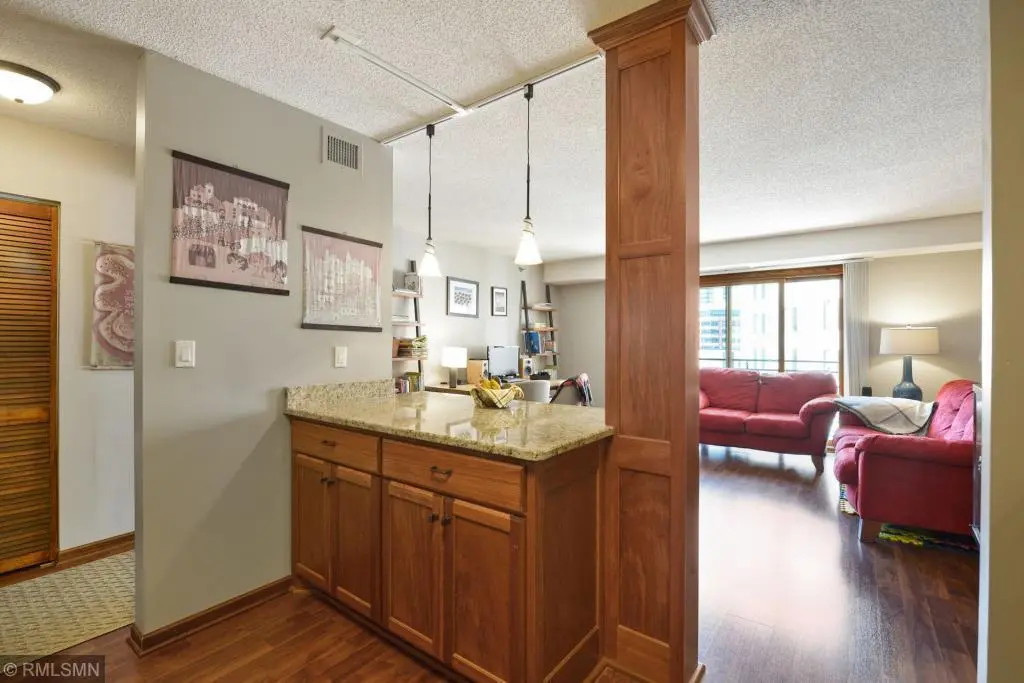
Downtown living at its finest! Be in the heart of the central business district and walk to work, dining, shopping, US Bank Stadium, Target Field and so much more. Enjoy cooking in your fantastic kitchen featuring SS appliances, granite counters, updated hardware and breakfast bar. Large living room leads onto balcony begging for morning coffee with fantastic city skyline views. Don’t forget to enjoy summers at the outdoor pool and deck, year-round fitness center, sauna, and hot tub. Round out your day with a stop in the library or party room. So much is included in association dues including heating, ac, water, sewer, trash, cable, internet, full time security, on-site maintenance staff, and underground heated parking. Skyway connected. You will LOVE living at the Crossings!
Key facts
- $648 HOA
- Garage
- Built 1981
Neighborhood map
What this means for you Summary
Snapshot
- This is a 1-bed/1.0-bath condo listed at $190k.
Deal economics
- At list price, monthly cash flow is $-306 ($-4k/yr) — negative.
- To cash-flow at today's rent, offer at most $136k (28.5% below list).
- Meets the 1% rule at list price ($2k rent vs $190k).
- Recommended offer: $136k (28.5% below list) — sets the bar for cash-flow.
- Cap rate 4.4% vs local median 3.1% in Minneapolis — top-decile yield for the area; either an underpriced asset or a hidden risk that comps aren't pricing in. Stress-test before assuming the spread holds.
Location & tenants
- Location reads 78/100 on livability (#110 in MN, #2,525 nationally) — a middle-class / working-renter tenant base. Strengths: amenities A+, commute A+, housing A+; Watch: cost of living C-, crime F.
- Minneapolis Public School District (urban): math 35% / reading 46% proficiency, ranked #217 of 301 in MN (top 72%) — families likely to look elsewhere, expect single-tenant / working-renter base with shorter leases.
- Market conditions: Rents rising fast (+5.5%/yr); 159 active listings in the ZIP; 40 comparable units currently listed for rent nearby; rentals leasing fast (median 1d on market — plan ~1-2 weeks tenant-placement turnaround); high-income renter base; 4,651 units permitted in Hennepin County in 2024 (2,443 in 5+ unit buildings).
Forward outlook
- In year one you build about $519 of equity ($1k loan paydown + $-794 appreciation (-0.4% local appreciation)).
- Hennepin County population projected at +30% by 2050 — long-run rental-demand tailwind backs the buy-and-hold thesis.
Negotiation context
- Only 12 days on market — expect competitive offers; lowballing is unlikely to land.
- 3 sale attempts since 7y ago with the ask held roughly flat each time — persistent listings suggest the price (not the market) is what's stuck; bring a comps-based counter.
Risks & watch-outs
- Watch-outs: HOA is 32% of rent.
Questions for the listing agent
- What do current leases actually rent for vs. the listed asking? Can we see a recent rent roll and the last 12 months of T-12 income?
- What does the HOA fee cover, when was the last increase, and are there any pending special assessments or reserve-fund shortfalls?
- Any open or pending special assessments — roof, HVAC, plumbing, elevator, façade? What's the per-unit balance and payoff schedule, and is the seller paying it off at close or rolling it to the buyer?
- Is there a deadline driving the sale (1031 exchange, divorce, estate, relocation)? That informs how much negotiation room exists.
- Crime grade is F in this area — have there been break-ins, vandalism, or insurance claims at this property in the last 3 years? What carrier currently insures it and at what premium?
- The area grade is low — what's the realistic commute time and amenity access for the typical tenant pool here? Any planned neighborhood developments (good or bad) we should know about?
- What's the average days-on-market for RENTAL listings here right now (not sales)? A rising rental-DOM trend means longer vacancies and softer asking-rent achievability than the comps imply.
- What's the recent tenant-quality profile in this submarket — average credit score on applications, eviction rate, late-payment / NSF rate, and stable-employment percentage? A property-management company in the area should have these aggregated.
- How much new apartment / multifamily construction is in the pipeline within 1–3 miles? Heavy new supply (>2% of stock underway) typically softens rents 12–24 months out; light construction supports rent growth.
Investment metrics
- 1% rule
- 1.08% ✓
- Cap rate
- 4.36%
- Cash-on-cash
- -6.91%
- DSCR
- 0.69
- GRM
- 7.7
CMA / ARV
No comps found within radius.
Projected returns pro-forma
-0.42% appreciation · 5.49% rent growth · sell at horizon
- IRR
- -9.4%
- Equity multiple
- 0.57×
- Total profit
- $-23,079
- Equity at exit
- $51,202
- IRR
- 0.0%
- Equity multiple
- 1.00×
- Total profit
- $42
- Equity at exit
- $58,487
Cash invested: $53,172 (down + closing). Projections, not guarantees.
Landlord ↔ Tenant lean methodology
- Overall (CITY)
- 34 Tenant-Leaning
- State Minnesota
- 46 Balanced · D+2
- County
- — inherits STATE
- City Minneapolis
- 34 Tenant-Leaning · D+50
ZIP-level market 55401
- Home prices YoY
- -0.2%
- Rents YoY
- 5.5%
- Active inventory
- 159
- Price-to-rent
- 7.7×
Monthly cashflow live
- Estimated rent
- $2,055 high interval (Pro) →
- Mortgage (P&I)
- −$996
- Tax from tax record
- −$206 /mo · $2,477/yr
- Insurance
- −$79
- HOA
- −$648
- Vacancy / Maint / Mgmt
- −$431
- Net cashflow
- $-306
Break-even live
Sensitivity live
| Price | -10% $-199 | -5% $-253 | +0% $-306 | +5% $-360 | +10% $-414 |
|---|---|---|---|---|---|
| Rent | -10% $-469 | -5% $-387 | +0% $-306 | +5% $-225 | +10% $-144 |
| Rate | -1.0pp $-211 | -0.5pp $-258 | base $-306 | +0.5pp $-355 | +1.0pp $-406 |
UW: 25.0% down · 7.5% · 30yr · 1.5% tax · 5.0% vac · 8.0% maint · 8.0% mgmt
Financing live
Cash to close
- Down payment
- $47,475
- Closing costs
- $5,697
- Reserves months
- —
- Total cash needed
- —
Loan-product check · same deal, 3 products live
Conventional
25% down · 7.5% · 30yr
- Down + closing
- —
- Monthly P&I
- —
- Monthly cashflow
- —
- DSCR
- —
- Eligible?
- —
Personal DTI + credit; lowest rate.
DSCR
20% down · 8.5% · 30yr
- Down + closing
- —
- Monthly P&I
- —
- Monthly cashflow
- —
- DSCR
- —
- Eligible?
- —
No personal income docs; deal must DSCR.
Hard money
10% down · 12.0% · 12mo
- Down + closing
- —
- Monthly P&I
- —
- Monthly cashflow
- —
- DSCR
- —
- Eligible?
- —
Short-term bridge; refi at stabilization.
Rent comps 40 comps
| Address | Beds | Baths | Sqft | Rent | $/sqft | DOM | Units | Dist |
|---|---|---|---|---|---|---|---|---|
| 365 Nicollet Mall Minneapolis, MN | 3.0 | 1.0–3.5 | 1656 | $4,354 | $2.63 | 0d | 36 | 0.14mi |
| 400 Marquette Ave Minneapolis, MN | 3.0 | 1.0–2.0 | 1103 | $2,440 | $2.21 | 0d | 11 | 0.16mi |
| 115 2nd Ave S Minneapolis, MN | 1.0 | 1.0 | 508 | $1,371 | $2.70 | 0d | 22 | 0.18mi |
| 111 S Marquette Ave Minneapolis, MN | 1.0–2.0 | 1.0–2.0 | 955 | $1,516 | $1.59 | 0d | 13 | 0.19mi |
| 465 Nicollet Mall Minneapolis, MN | 2.0 | 1.0–3.0 | 1153 | $3,055 | $2.65 | 0d | 14 | 0.19mi |
| 101 S 5th St Minneapolis, MN | 3.0 | 1.0–2.0 | 1249 | $2,289 | $1.83 | 0d | 34 | 0.21mi |
| 270 Hennepin Ave Minneapolis, MN | 3.0 | 1.0–3.0 | 1505 | $4,088 | $2.72 | 0d | 53 | 0.24mi |
| 120 Hennepin Ave Minneapolis, MN | 2.0 | 1.0–2.0 | 960 | $2,590 | $2.70 | 9d | 10 | 0.26mi |
| 511 S 4th St Minneapolis, MN | 2.0 | 1.0–2.0 | 882 | $2,222 | $2.52 | 0d | 11 | 0.29mi |
| 608 2nd Ave S Minneapolis, MN | 1.0–2.0 | 1.0–2.0 | 999 | $1,675 | $1.68 | 0d | 33 | 0.29mi |
| 250 Portland Ave Minneapolis, MN | 1.0–2.0 | 1.0–2.0 | 902 | $1,950 | $2.16 | 0d | 10 | 0.30mi |
| 120 N 2nd St Minneapolis, MN | 1.0–2.0 | 1.0–2.5 | 1039 | $1,591 | $1.53 | 0d | 17 | 0.34mi |
| 225 Portland Ave Minneapolis, MN | 2.0 | 1.0–2.0 | 837 | $2,410 | $2.88 | 0d | 72 | 0.35mi |
| 600 5th Ave S Minneapolis, MN | 1.0–2.0 | 1.0–2.0 | 878 | $1,440 | $1.64 | 0d | 12 | 0.35mi |
| 110 N 1st St Minneapolis, MN | 1.0–2.0 | 1.0–2.0 | 885 | $1,719 | $1.94 | 0d | 21 | 0.36mi |
| 240 Park Ave Minneapolis, MN | 1.0–2.0 | 1.0–2.0 | 1047 | $2,075 | $1.98 | 4d | 2 | 0.38mi |
| 205 Park Ave Minneapolis, MN | 1.0–2.0 | 1.0–2.0 | 859 | $1,829 | $2.13 | 0d | 5 | 0.42mi |
| 650 Portland Ave Minneapolis, MN | 2.0 | 1.0–2.0 | 1104 | $2,825 | $2.56 | 0d | 16 | 0.42mi |
| 700 S 4th St Minneapolis, MN | 2.0 | 1.0–2.0 | 897 | $2,688 | $2.99 | 0d | 25 | 0.44mi |
| 431 S 7th St #2610 Minneapolis, MN | 1.0 | 1.0 | 430 | $1,250 | $2.91 | 25d | 1 | 0.44mi |
| 431 S 7th St Minneapolis, MN | 1.0 | 1.0 | 430 | $1,250 | $2.91 | 12d | 2 | 0.44mi |
| 431 S 7th St Minneapolis, MN | 1.0 | 1.0 | 430 | $1,250 | $2.91 | 45d | 2 | 0.44mi |
| 240 Chicago Ave Minneapolis, MN | 2.0 | 1.0–2.0 | 825 | $2,168 | $2.63 | 0d | 14 | 0.46mi |
| 316 N 2nd St Minneapolis, MN | 1.0–2.0 | 1.0–2.0 | 795 | $1,417 | $1.78 | 0d | 8 | 0.49mi |
| 811 Washington Ave S Minneapolis, MN | 1.0–2.0 | 1.0–2.0 | 862 | $1,660 | $1.93 | 21d | 9 | 0.50mi |
| 90 S 9th St Minneapolis, MN | 2.0 | 1.0 | 823 | $1,650 | $2.00 | 0d | 4 | 0.50mi |
| 337 N Washington Ave Minneapolis, MN | 2.0 | 1.0–2.0 | 796 | $2,114 | $2.65 | 3d | 30 | 0.52mi |
| 360 1st St N Minneapolis, MN | 1.0–2.0 | 1.0–2.0 | 889 | $1,835 | $2.06 | 0d | 10 | 0.53mi |
| 615 S 8th St Minneapolis, MN | 2.0 | 1.0–2.5 | 1252 | $3,675 | $2.94 | 0d | 49 | 0.54mi |
| 401 N 1st St Minneapolis, MN | — | 1.0 | 531 | $1,282 | $2.41 | 45d | 1 | 0.57mi |
| 95 S 10th St Minneapolis, MN | 2.0 | 1.0–2.0 | 688 | $1,744 | $2.53 | 3d | 31 | 0.60mi |
| 609 S 9th St #2 Minneapolis, MN | 1.0 | 1.0 | 600 | $1,095 | $1.82 | 45d | 1 | 0.61mi |
| 212 10th Ave S Minneapolis, MN | 3.0 | 1.0–2.5 | 1490 | $4,242 | $2.85 | 3d | 10 | 0.61mi |
| 360 N 5th Ave Minneapolis, MN | 2.0 | 1.0–2.5 | 1185 | $4,452 | $3.75 | 0d | 82 | 0.62mi |
| 910 Portland Ave Minneapolis, MN | 1.0 | 1.0 | 392 | $1,056 | $2.69 | 15d | 1 | 0.64mi |
| 528 Washington Ave N Minneapolis, MN | 1.0 | 1.0 | 543 | $2,629 | $4.84 | 0d | 21 | 0.66mi |
| 929 Portland Ave #1408 Minneapolis, MN | 1.0 | 1.0 | 680 | $1,485 | $2.18 | 45d | 1 | 0.66mi |
| 432 N 1st St Minneapolis, MN | 1.0–2.0 | 1.0–2.0 | 1067 | $1,395 | $1.31 | 3d | 6 | 0.67mi |
| 900 Centennial Pl Minneapolis, MN | — | 1.0 | 390 | $825 | $2.12 | 15d | 1 | 0.68mi |
| 1111 3rd Ave S Unit 1511914P Minneapolis, MN | 4.0 | 1.0–2.0 | 1081 | $5,100 | $4.72 | 4d | 2 | 0.70mi |
HOA detail condo
- Monthly dues
- $648 · $7,776/yr
- Likely covers
- watersewertrashinternetcablepoolgymsecurity
- Assessments
- None detected in remarks — confirm with the listing agent.
Listing history 12 events
-
2026-04-07status Pending
-
2026-03-26Contingent - Inspection
-
2026-03-26$189,900
-
2019-07-01soldstatus $220,000
-
2019-06-27soldstatus $220,000 Sold 792-char remark
Show marketing remark (792 chars)
Downtown living at its finest! Be in the heart of the central business district and walk to work, dining, shopping, US Bank Stadium, Target Field and so much more. Enjoy cooking in your fantastic kitchen featuring SS appliances, granite counters, updated hardware and breakfast bar. Large living room leads onto balcony begging for morning coffee with fantastic city skyline views. Don’t forget to enjoy summers at the outdoor pool and deck, year-round fitness center, sauna, and hot tub. Round out your day with a stop in the library or party room. So much is included in association dues including heating, ac, water, sewer, trash, cable, internet, full time security, on-site maintenance staff, and underground heated parking. Skyway connected. You will LOVE living at the Crossings!
-
2019-05-22status Pending 792-char remark
Show marketing remark (792 chars)
Downtown living at its finest! Be in the heart of the central business district and walk to work, dining, shopping, US Bank Stadium, Target Field and so much more. Enjoy cooking in your fantastic kitchen featuring SS appliances, granite counters, updated hardware and breakfast bar. Large living room leads onto balcony begging for morning coffee with fantastic city skyline views. Don’t forget to enjoy summers at the outdoor pool and deck, year-round fitness center, sauna, and hot tub. Round out your day with a stop in the library or party room. So much is included in association dues including heating, ac, water, sewer, trash, cable, internet, full time security, on-site maintenance staff, and underground heated parking. Skyway connected. You will LOVE living at the Crossings!
-
2019-05-13historical Contingent - Inspection 792-char remark
Show marketing remark (792 chars)
Downtown living at its finest! Be in the heart of the central business district and walk to work, dining, shopping, US Bank Stadium, Target Field and so much more. Enjoy cooking in your fantastic kitchen featuring SS appliances, granite counters, updated hardware and breakfast bar. Large living room leads onto balcony begging for morning coffee with fantastic city skyline views. Don’t forget to enjoy summers at the outdoor pool and deck, year-round fitness center, sauna, and hot tub. Round out your day with a stop in the library or party room. So much is included in association dues including heating, ac, water, sewer, trash, cable, internet, full time security, on-site maintenance staff, and underground heated parking. Skyway connected. You will LOVE living at the Crossings!
-
2019-05-10price $224,900 792-char remark
Show marketing remark (792 chars)
Downtown living at its finest! Be in the heart of the central business district and walk to work, dining, shopping, US Bank Stadium, Target Field and so much more. Enjoy cooking in your fantastic kitchen featuring SS appliances, granite counters, updated hardware and breakfast bar. Large living room leads onto balcony begging for morning coffee with fantastic city skyline views. Don’t forget to enjoy summers at the outdoor pool and deck, year-round fitness center, sauna, and hot tub. Round out your day with a stop in the library or party room. So much is included in association dues including heating, ac, water, sewer, trash, cable, internet, full time security, on-site maintenance staff, and underground heated parking. Skyway connected. You will LOVE living at the Crossings!
-
2019-04-24$227,900 Active 792-char remark
Show marketing remark (792 chars)
Downtown living at its finest! Be in the heart of the central business district and walk to work, dining, shopping, US Bank Stadium, Target Field and so much more. Enjoy cooking in your fantastic kitchen featuring SS appliances, granite counters, updated hardware and breakfast bar. Large living room leads onto balcony begging for morning coffee with fantastic city skyline views. Don’t forget to enjoy summers at the outdoor pool and deck, year-round fitness center, sauna, and hot tub. Round out your day with a stop in the library or party room. So much is included in association dues including heating, ac, water, sewer, trash, cable, internet, full time security, on-site maintenance staff, and underground heated parking. Skyway connected. You will LOVE living at the Crossings!
-
2013-09-11soldstatus $60,121
-
1996-05-02soldstatus $62,500
-
1993-05-28soldstatus $56,125
ⓘ Source: listings_history table (triggers on properties + properties_extension) + one-shot
backfill from property_details.listing_events for pre-trigger history.
Tax reassessment forecast MN · Partial reset (capped growth)
- Current annual tax
- $2,477 · $206/mo
- Projected year-2 tax
- $2,477 · $206/mo
- Expected delta
- $0/yr ($0/mo · 0.0%)
ⓘ Screening estimate from a state-policy table — verify with the county assessor before closing.
Climate risk First Street
- Flood 1/10 Low FEMA zone X (unshaded) · 0% chance over 30 yrs
- Wildfire 1/10 Low
- Heat 2/10 Low 7 d/yr ≥99°F today · 14 d/yr by 30 yrs out
- Wind 2/10 Low
- Air quality 2/10 Low 1 unhealthy d/yr today · 1 by 30 yrs out
Nearby sold comps map
Loading sold comps map…
Walkable amenities ~0.75 mi
Loading nearby amenities…
Taxation est. · year 1
- Rental income
- $24,656
- − Mortgage interest
- −$10,637
- − Property taxes
- −$2,477
- − Insurance
- −$950
- − Repairs & maintenance
- −$1,972
- − Management
- −$1,972
- − HOA
- −$7,776
- − Depreciation
- −$5,524
- Taxable loss
- −$6,654
- Est. tax savings @ 24.0%
- +$1,597
- After-tax cash flow
- $-2,078/yr
For passive investors: Depreciation is non-cash, so a rental often shows a tax loss while cash-flowing — sheltering income. Rental losses are passive: they offset passive income freely, and up to $25,000/yr can offset ordinary (W-2) income if you actively participate and your MAGI is under $100k (phasing out to $0 by $150k); unused losses carry forward. On sale, claimed depreciation is recaptured at up to 25%, and gains may owe capital-gains tax (a 1031 exchange can defer both). Figures are a year-1 estimate at your 24.0% rate — not tax advice; consult a CPA.
Schools (NCES district)
- District
- Minneapolis Public School District
- NCES district ID
- 2721240
- Math proficiency
- 35% ▼ -7.00%
- Reading proficiency
- 46% ▼ -1.00%
- Median HH income
- $50,521
- Composite
- 34.92/100
- National rank
- #5067
- State rank
- #217 of 301 in MN
Livability — Minneapolis
- Score
- 78/100
- State rank
- #110
- US rank
- #2525
Category grades
Schools grade is shown separately in the Schools card above.
Census & demographics
- Census place
- Minneapolis, MN
- County
- Hennepin County · 1,150,272 people
- City population
- 417,555
- Metro
- Minneapolis-St. Paul-Bloomington, MN-WI
- Population (ZIP)
- 11,816
- Household income
- $113,522
- Rent vs Own
- Severe rent burden
- 610.0
Population outlook (Hennepin County) Hauer SSP2
- Today (2025)
- 1,405,227 people
- By 2030
- 1,492,650 · +6.2%
- By 2040
- 1,660,157 · +18.1%
- By 2050
- 1,823,498 · +29.8%
- By 2075
- 2,221,283 · +58.1%
- By 2100
- 2,509,976 · +78.6%
Race, ethnicity, and origin ACS 2023
- Neighborhood character
- Predominantly White (75%)
- Race & ethnicity
- White 75% Asian 9% Hispanic / Latino 8% Two or more races 6% Black 5%
- Hispanic origin (detail)
- Mexican 4%
- Common ancestry
- Portuguese 10% Romanian 7% Lithuanian 5%
- Foreign-born
- 13% · Canada, China, South Korea
- Languages at home
- 86% English-only · Spanish 6% Other Indo-European 3% Chinese 2%
Political lean MEDSL · Hennepin
- 2024 margin
- Solid D (+42.6) · D 70.2% · R 27.5% · Other 2.3%
- 2008→2024 swing
- +14.0pp toward D · 2008: 28.6pp · 2024: 42.6pp
- All cycles
- 2024: D+42.6 2020: D+43.2 2016: D+35.3 2012: D+27.1 2008: D+28.6
Not yet ingested
- Civics
- —
Market trends
- HPI YoY
- ▼ -0.42%
- Current HPI
- 233.936
- Rent YoY
- ▲ 5.49%
- Metro
- Minneapolis-St. Paul-Bloomington, MN-WI
- State GDP YoY
- ▲ 2.41%
- F500 in state
- 34
Industry mix (Fortune 500 HQ in MN)
| Industry | F500 HQs | Revenue |
|---|---|---|
| Healthcare | 2 | $407B |
|
||
| Retail | 2 | $150B |
|
||
| Consumer Goods | 2 | $32B |
|
||
| Industrial Machinery | 2 | $6B |
|
||
| Agriculture | 1 | $40B |
|
||
| Healthcare / Medical Devices | 1 | $32B |
|
||
Price history
+238.4% since first listed12 events — show timeline
- 2026-04-07 Pending — NORTHSTARMLS as Distributed by MLS Grid
- 2026-03-26 Listed — NORTHSTARMLS as Distributed by MLS Grid
- 2026-03-26 Listed $189,900 NORTHSTARMLS as Distributed by MLS Grid
- 2019-07-01 Sold (Public Records) $220,000 Public Records
- 2019-06-27 Sold (MLS) $220,000 NORTHSTARMLS as Distributed by MLS Grid
- 2019-05-22 Pending — NORTHSTARMLS as Distributed by MLS Grid
- 2019-05-13 Contingent — NORTHSTARMLS as Distributed by MLS Grid
- 2019-05-10 Price Changed $224,900 NORTHSTARMLS as Distributed by MLS Grid
- 2019-04-24 Listed $227,900 NORTHSTARMLS as Distributed by MLS Grid
- 2013-09-11 Sold (Public Records) $60,121 Public Records
- 1996-05-02 Sold (Public Records) $62,500 Public Records
- 1993-05-28 Sold (Public Records) $56,125 Public Records
Property tax history
+1.2%/yrLatest (2025): $2,477 · -1.4% YoY. Source: county tax records.
Cash-flow waterfall
monthlySold comps — $/sqft
last 12 mo · ≤1 miLoading sold comps…