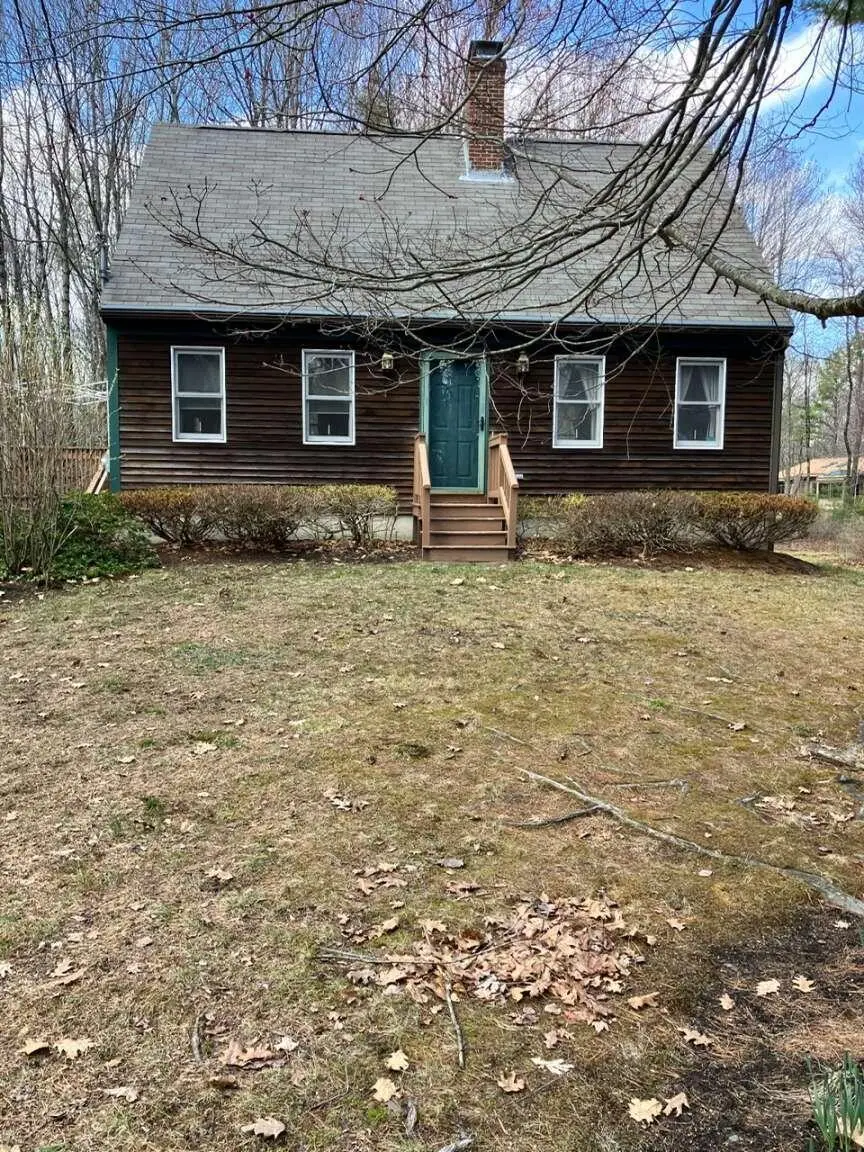
1070 Coles Hill Rd · Wells, ME
Flood risk No data
- FEMA flood zone
- —
- Chance of flooding over 30 yrs
- —
- Est. flood insurance / yr
- —
Fire risk No data
- Est. fire insurance / yr
- —
Heat risk No data
- Hot days now (above threshold)
- —
- Hot days in 30 yrs
- —
Wind risk No data
- Chance of severe wind over 30 yrs
- —
Air-quality risk No data
- Unhealthy air days now
- —
- Unhealthy air days in 30 yrs
- —
Risk factors via First Street. Map © Google.
Why this score? — see what drove the D- grade
The composite is a weighted blend of 9 inputs, each scored 0–100. Each bar is that input's sub-score; the figure is the points it added to the 100-point composite (weight × sub-score).
- ARV discount +13.6/15.0
- Schools +7.6/10.0
- Cash flow +7.0/30.0
- Rent growth +2.5/5.0
- Livability +2.5/5.0
- Condition / age +2.5/5.0
- DSCR +1.2/10.0
- 1% rule +0.8/10.0
- Appreciation +0.0/10.0
$599,000
🖨 Deal sheet (PDF) 📄 Offer letter ✓ Due diligence
Listing remarks
Beautiful Wells Maine. Enjoy both coastal and country living, simple charm best describes this raised colonial cape set on 2.3 acre pine lot. 460.51 street frontage. Zoned rural. This meticulously kept 3 bedroom, 2 full bath, living room, dining room and kitchen with a backyard deck is only minutes to I-95, schools, beaches, shopping, Amtrack. Short walk to golf course and trout fishing. Fresh local seasonal farmstands around the corner. Center brick fireplace, solid pine doors, private water and sewer. Custom window treatments, baseboard oil heat, Spacious detached 2 car garage, in-law apt. possibility. No Condo fees or HOA's ------Motivated Seller----------
Key facts
- Raised colonial cape
- 2.3 acre pine lot
- Zoned rural
Tags
Property features AI
Exterior
- Parking: Attached garage with 2 spaces; Additional paved parking for 5–10 vehicles; 2-car vehicle storage
- Utilities: Private well water; Private sewer; Circuit breaker electric service; Water heater: tank, tied to heating system; 90% efficient furnace
- Home design: Single family residence; Built in 1991
- Construction: Wood frame with clapboard siding and asbestos components; Shingle roof; 1991 construction
- Exterior features: Deck; Neighborhood setting; Level and wooded lot; Near public transit; Paved road access
Interior
- Kitchen: Eat-in kitchen; Kitchen island; Dishwasher; Electric range; Refrigerator
- Bedrooms: Primary bedroom on second level with full bath; Three additional bedrooms on second level
- Flooring: Carpet; Vinyl
- Bathrooms: Two full bathrooms
- Heating & cooling: Baseboard heating; Forced air heating
- Interior features: Eight total rooms; Interior entry to unfinished basement; Accessibility features with 32–36 inch doors and 36–48 inch halls; Wood-burning fireplace (formal living room)
- Laundry & utility: Washer; Dryer
Neighborhood map
What this means for you Summary
Snapshot
- This is a 3-bed/2.0-bath single-family listed at $599k.
Deal economics
- At list price, monthly cash flow is $-883 ($-11k/yr) — negative.
- To cash-flow at today's rent, offer at most $443k (26.0% below list).
- To meet the 1% rule (rent ≥ 1% of price), the offer needs to be $348k (42.0% below list).
- Recommended offer: $348k (42.0% below list) — sets the bar for 1% rule.
Location & tenants
- Location reads: area grade D — affects rentability + tenant quality, not the cash-flow math above.
- Wells-Ogunquit CSD (rural): math 87% / reading 90% proficiency, ranked #32 of 112 in ME (top 29%) — strong family-tenant draw, lease renewals of 3-5y typical; only 17% free/reduced lunch — higher-income household profile.
- Zoned schools: Wells Elementary School (math 87% / reading 91%, grade A+, #73 of 294 statewide, top 25%, 551 students, 15% FRL); Wells Junior High School (math 86% / reading 90%, grade A+, #27 of 85 statewide, top 31%, 441 students, 19% FRL); Wells High School (math 98% / reading 92%, grade A+, #18 of 108 statewide, top 22%, 415 students, 10% FRL) — zoned schools at 15% FRL track the district average.
- Market conditions: 272 active listings in the ZIP; 1,386 units permitted in York County in 2024 (338 in 5+ unit buildings).
Forward outlook
- Local home prices are declining (-3.0%/yr); year-one equity from $4k of loan paydown is wiped out by about $18k of value loss. Plan a longer hold.
Negotiation context
- It's been on market 65 days — a 6% lower offer ($563k) is reasonable based on typical stale-listing flexibility.
- 2 sale attempts since 13y ago; this cycle's ask has dropped $196k (25%) from the opening price — seller is motivated, your offer sets the floor, not the list.
Questions for the listing agent
- What do current leases actually rent for vs. the listed asking? Can we see a recent rent roll and the last 12 months of T-12 income?
- It's been on market 65 days. Have you received any prior offers? Is the seller open to a 42% concession, seller financing, or rate buy-down credit?
- Why hasn't it sold? Are there any deal-killer items the seller is aware of (foundation, flood, title, zoning, code violations)?
- Is there a deadline driving the sale (1031 exchange, divorce, estate, relocation)? That informs how much negotiation room exists.
- The area grade is low — what's the realistic commute time and amenity access for the typical tenant pool here? Any planned neighborhood developments (good or bad) we should know about?
- What's the average days-on-market for RENTAL listings here right now (not sales)? A rising rental-DOM trend means longer vacancies and softer asking-rent achievability than the comps imply.
- What's the recent tenant-quality profile in this submarket — average credit score on applications, eviction rate, late-payment / NSF rate, and stable-employment percentage? A property-management company in the area should have these aggregated.
- How much new for-sale + rental construction is in the pipeline within 1–3 miles? Heavy new supply typically softens prices + rents 12–24 months out; constrained supply supports both.
Investment metrics
- 1% rule
- 0.58% ✗
- Cap rate
- 4.52%
- Cash-on-cash
- -6.32%
- DSCR
- 0.72
- GRM
- 14.4
CMA / ARV
- ARV (median comp)
- $692,208
- List price
- $599,000
- Delta
- -13.47%
- Verdict
- UNDERPRICED
- Comps
- 10 within 1.0 mi
Projected returns pro-forma
-3.0% appreciation · 3.0% rent growth · sell at horizon
- IRR
- -27.3%
- Equity multiple
- 0.08×
- Total profit
- $-153,560
- Equity at exit
- $89,313
- IRR
- -25.5%
- Equity multiple
- -0.24×
- Total profit
- $-207,191
- Equity at exit
- $51,791
Cash invested: $167,720 (down + closing). Projections, not guarantees.
Landlord ↔ Tenant lean methodology
- Overall (STATE)
- 41 Moderately Tenant-Leaning
- State Maine
- 41 Moderately Tenant-Leaning · D+2
- County
- — inherits STATE
- City
- — inherits STATE
ZIP-level market 04090
- Home prices YoY
- -20.0%
- Active inventory
- 272
- Price-to-rent
- 14.4×
Monthly cashflow live
- Estimated rent
- $3,475 medium interval (Pro) →
- Mortgage (P&I)
- −$3,141
- Tax from tax record
- −$238 /mo · $2,850/yr
- Insurance
- −$250
- HOA
- −$0
- Vacancy / Maint / Mgmt
- −$730
- Net cashflow
- $-883
Break-even live
Sensitivity live
| Price | -10% $-544 | -5% $-713 | +0% $-883 | +5% $-1,052 | +10% $-1,222 |
|---|---|---|---|---|---|
| Rent | -10% $-1,157 | -5% $-1,020 | +0% $-883 | +5% $-746 | +10% $-608 |
| Rate | -1.0pp $-581 | -0.5pp $-731 | base $-883 | +0.5pp $-1,038 | +1.0pp $-1,196 |
UW: 25.0% down · 7.5% · 30yr · 1.5% tax · 5.0% vac · 8.0% maint · 8.0% mgmt
Financing live
Cash to close
- Down payment
- $149,750
- Closing costs
- $17,970
- Reserves months
- —
- Total cash needed
- —
Loan-product check · same deal, 3 products live
Conventional
25% down · 7.5% · 30yr
- Down + closing
- —
- Monthly P&I
- —
- Monthly cashflow
- —
- DSCR
- —
- Eligible?
- —
Personal DTI + credit; lowest rate.
DSCR
20% down · 8.5% · 30yr
- Down + closing
- —
- Monthly P&I
- —
- Monthly cashflow
- —
- DSCR
- —
- Eligible?
- —
No personal income docs; deal must DSCR.
Hard money
10% down · 12.0% · 12mo
- Down + closing
- —
- Monthly P&I
- —
- Monthly cashflow
- —
- DSCR
- —
- Eligible?
- —
Short-term bridge; refi at stabilization.
Listing history 20 events
-
2026-06-22days on market $599,000 Active 65 DOM
-
2026-06-18days on market $599,000 Active 62 DOM
-
2026-06-17days on market $599,000 Active 61 DOM
-
2026-06-16days on market $599,000 Active 60 DOM
-
2026-06-15price $599,000 Active 59 DOM
-
2026-06-15days on market $649,000 Active 59 DOM
-
2026-06-14days on market $649,000 Active 57 DOM
-
2026-06-13days on market $649,000 Active 56 DOM
-
2026-06-10days on market $649,000 Active 54 DOM
-
2026-06-09remarks 667-char remark
-
2026-06-09days on market $649,000 Active 53 DOM
-
2026-06-08days on market $649,000 Active 52 DOM
-
2026-06-07days on market $649,000 Active 51 DOM
-
2026-06-05days on market $649,000 Active 48 DOM
-
2026-06-03days on market $649,000 Active 47 DOM
-
2026-06-02days on market $649,000 Active 46 DOM
-
2026-06-01days on market $649,000 Active 45 DOM
-
2026-05-31days on market $649,000 Active 44 DOM
-
2026-05-30days on market $649,000 Active 43 DOM
-
2026-04-17$795,000 Active 629-char remark
ⓘ Source: listings_history table (triggers on properties + properties_extension) + one-shot
backfill from property_details.listing_events for pre-trigger history.
Tax reassessment forecast ME · Partial reset (capped growth)
- Current annual tax
- $2,850 · $238/mo
- Projected year-2 tax
- $5,498 · $458/mo
- Expected delta
- +$2,648/yr (+$221/mo · 92.9%)
ⓘ Screening estimate from a state-policy table — verify with the county assessor before closing.
Nearby sold comps map
Loading sold comps map…
Walkable amenities ~0.75 mi
Loading nearby amenities…
Taxation est. · year 1
- Rental income
- $41,702
- − Mortgage interest
- −$33,553
- − Property taxes
- −$2,850
- − Insurance
- −$2,995
- − Repairs & maintenance
- −$3,336
- − Management
- −$3,336
- − Depreciation
- −$17,425
- Taxable loss
- −$21,794
- Est. tax savings @ 24.0%
- +$5,231
- After-tax cash flow
- $-5,365/yr
For passive investors: Depreciation is non-cash, so a rental often shows a tax loss while cash-flowing — sheltering income. Rental losses are passive: they offset passive income freely, and up to $25,000/yr can offset ordinary (W-2) income if you actively participate and your MAGI is under $100k (phasing out to $0 by $150k); unused losses carry forward. On sale, claimed depreciation is recaptured at up to 25%, and gains may owe capital-gains tax (a 1031 exchange can defer both). Figures are a year-1 estimate at your 24.0% rate — not tax advice; consult a CPA.
Schools (NCES district)
- District
- Wells-Ogunquit CSD
- NCES district ID
- 2313490
- Math proficiency
- 87% ▲ 42.00%
- Reading proficiency
- 90% ▲ 26.00%
- Median HH income
- $61,341
- Composite
- 75.79/100
- National rank
- #125
- State rank
- #32 of 112 in ME
Livability — Wells
No livability data for this city. (Only ~50 U.S. cities are tracked.)
Census & demographics
- Population (ZIP)
- 11,544
Population outlook (York County) Hauer SSP2
- Today (2025)
- 209,961 people
- By 2030
- 212,816 · +1.4%
- By 2040
- 214,360 · +2.1%
- By 2050
- 210,350 · +0.2%
- By 2075
- 201,686 · -3.9%
- By 2100
- 183,392 · -12.7%
Race, ethnicity, and origin ACS 2023
- Neighborhood character
- Predominantly White (89%)
- Race & ethnicity
- White 89% Two or more races 5% Black 3% Asian 1%
- Common ancestry
- Lithuanian 11% Romanian 3% Slovak 3%
- Foreign-born
- 5% · Canada, China
- Languages at home
- 94% English-only · Other Indo-European 1% French/Haitian/Cajun 1% Other Asian/Pacific 1%
Political lean MEDSL · York
- 2024 margin
- D (+10.5) · D 54.3% · R 43.8% · Other 1.9%
- 2008→2024 swing
- -10.1pp toward R · 2008: 20.5pp · 2024: 10.5pp
- All cycles
- 2024: D+10.5 2020: D+12.6 2016: D+4.8 2012: D+16.4 2008: D+20.5
Not yet ingested
- Civics
- —
Market trends
- HPI YoY
- ▼ -103.52%
- Current HPI
- 413.9951
- Rent YoY
- —
- Metro
- —
- State GDP YoY
- —
- F500 in state
- 0
Price history
+130.5% since first listed5 events — show timeline
- 2026-06-15 Price Changed $599,000 MREIS
- 2026-05-28 Price Changed $649,000 MREIS
- 2026-05-20 Price Changed $725,000 MREIS
- 2026-04-17 Listed $795,000 MREIS
- 2013-07-08 Listed $259,900 MREIS
Property tax history
+3.2%/yrLatest (2025): $2,850 · +6.3% YoY. Source: county tax records.
Cash-flow waterfall
monthlySold comps — $/sqft
last 12 mo · ≤1 miLoading sold comps…