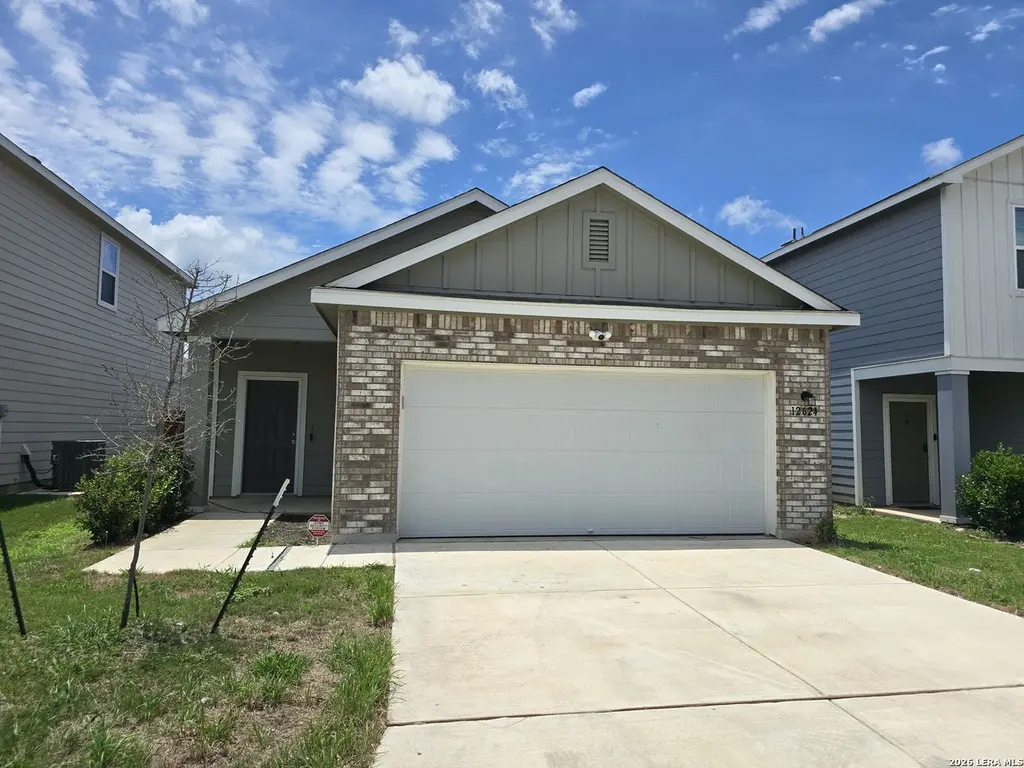
12624 Corona Borealis · San Antonio, TX
Flood risk 1/10 · Minimal
- FEMA flood zone
- X (unshaded)
- Chance of flooding over 30 yrs
- 0.0%
- Est. flood insurance / yr
- $507 – $1,088
Fire risk 6/10 · Moderate
- Est. fire insurance / yr
- $1,222 – $2,270
Heat risk 8/10 · Major
- Hot days now (above 109°F)
- 7 days/yr
- Hot days in 30 yrs
- 22 days/yr
Wind risk 8/10 · Major
- Chance of severe wind over 30 yrs
- 80.0%
Air-quality risk 2/10 · Minimal
- Unhealthy air days now
- 1 days/yr
- Unhealthy air days in 30 yrs
- 1 days/yr
Risk factors via First Street. Map © Google.
Why this score? — see what drove the C- grade
The composite is a weighted blend of 9 inputs, each scored 0–100. Each bar is that input's sub-score; the figure is the points it added to the 100-point composite (weight × sub-score).
- ARV discount +15.0/15.0
- Cash flow +14.6/30.0
- DSCR +4.5/10.0
- Schools +4.4/10.0
- Livability +4.0/5.0
- 1% rule +3.8/10.0
- Condition / age +2.2/5.0
- Rent growth +1.7/5.0
- Appreciation +0.0/10.0
$204,772
🖨 Deal sheet (PDF) 📄 Offer letter ✓ Due diligence
Listing remarks MLS
New Starlight Home under construction. The Kitchen has Granite Countertops, brand new stainless steel appliance, and Electric Range. Meridian is conveniently located off Loop 1604 and Highway 90, you're minutes away from shopping, restaurants, and entertainment in downtown San Antonio.
Key facts
- Open floor plan
- Granite countertops
- Conveniently located
Tags
Property features AI
Finance
- HOA & community: Mandatory HOA; HOA fee $450 annually; Association transfer fee $300; Subdivision: MERIDIAN
Exterior
- Parking: 2-car garage
- Utilities: Water system
- Home design: Pre-owned home; Built by Starlight Homes; Approximately 4 years old
- Construction: Brick and siding exterior; Slab foundation; Composition roof
- Exterior features: Pool (community); Park/playground (community)
Interior
- Kitchen: Eat-in kitchen with island (10 x 8)
- Bedrooms: Master bedroom on lower level (15 x 14); Bedroom 2 (11 x 10); Bedroom 3 (12 x 11)
- Flooring: Carpeting; Vinyl flooring
- Bathrooms: Two full bathrooms; Master bath with shower only (10 x 15)
- Heating & cooling: Central heating (electric); Central air conditioning
- Interior features: Ceiling fans; Eat-in kitchen; Kitchen island; Utility room inside; All window coverings remain
- Laundry & utility: Washer connection; Dryer connection; Utility room inside
Neighborhood map
What this means for you Summary
Snapshot
- This is a 3-bed/2.0-bath single-family listed at $205k. Condition is rated fair.
Deal economics
- At list price, monthly cash flow is $50 ($596/yr) — positive.
- The deal already cash-flows at list — no discount required.
- To meet the 1% rule (rent ≥ 1% of price), the offer needs to be $181k (11.5% below list).
- Recommended offer: $181k (11.5% below list) — sets the bar for 1% rule.
- Cap rate 6.6% vs local median 3.8% in San Antonio — top-decile yield for the area; either an underpriced asset or a hidden risk that comps aren't pricing in. Stress-test before assuming the spread holds.
Location & tenants
- Location reads 80/100 on livability (#31 in TX, #1,616 nationally) — a professional / high-income tenant draw. Strengths: amenities A+, commute A+, cost of living A+; Watch: crime F.
- Medina Valley ISD (rural): math 48% / reading 53% proficiency, ranked #148 of 826 in TX (top 18%) — acceptable for families but not a draw, mixed tenant base, ~2y average lease.
- Zoned schools: Luckey Ranch El (math 47% / reading 50%, grade D, #950 of 4,322 statewide, top 22%, 866 students, 67% FRL); Medina Valley Middle (math 47% / reading 49%, grade C-, #400 of 1,662 statewide, top 24%, 1,029 students, 62% FRL); Medina Valley H S (math 34% / reading 55%, grade F, #652 of 1,632 statewide, top 43%, 2,147 students, 51% FRL).
- Market conditions: Rents falling (-3.0%/yr); 1172 active listings in the ZIP; 40 comparable units currently listed for rent nearby; rentals at typical pace (median 26d on market — plan ~3-4 weeks tenant-placement turnaround); solid renter incomes; 8,308 units permitted in Bexar County in 2024 (2,506 in 5+ unit buildings).
Forward outlook
- Local home prices are declining (-3.0%/yr); year-one equity from $1k of loan paydown is wiped out by about $6k of value loss. Plan a longer hold.
- Bexar County population projected at +50% by 2050 — long-run rental-demand tailwind backs the buy-and-hold thesis.
Negotiation context
- It's been on market 19 days — a 2% lower offer ($202k) is reasonable based on typical stale-listing flexibility.
- 3 sale attempts since 4y ago with the ask held roughly flat each time — persistent listings suggest the price (not the market) is what's stuck; bring a comps-based counter.
Risks & watch-outs
- Climate carrying-cost: severe wind risk, 80% chance of damaging wind over 30y; major wildfire risk; extreme-heat days projected 7→22/yr by 2055 (HVAC capex compounding) — expect insurance premiums to compound above CPI over the hold.
Questions for the listing agent
- Have any recent inspections been done? Can we get a copy of the seller's disclosures and any deferred-maintenance estimates?
- What does the HOA fee cover, when was the last increase, and are there any pending special assessments or reserve-fund shortfalls?
- Is there a deadline driving the sale (1031 exchange, divorce, estate, relocation)? That informs how much negotiation room exists.
- Crime grade is F in this area — have there been break-ins, vandalism, or insurance claims at this property in the last 3 years? What carrier currently insures it and at what premium?
- What's the average days-on-market for RENTAL listings here right now (not sales)? A rising rental-DOM trend means longer vacancies and softer asking-rent achievability than the comps imply.
- What's the recent tenant-quality profile in this submarket — average credit score on applications, eviction rate, late-payment / NSF rate, and stable-employment percentage? A property-management company in the area should have these aggregated.
- How much new for-sale + rental construction is in the pipeline within 1–3 miles? Heavy new supply typically softens prices + rents 12–24 months out; constrained supply supports both.
Investment metrics
- 1% rule
- 0.88% ✗
- Cap rate
- 6.58%
- Cash-on-cash
- 1.04%
- DSCR
- 1.05
- GRM
- 9.4
CMA / ARV
- ARV (on-the-fly)
- $277,144
- Comps found
- 9
Show comp detail 9 sales within ~0.75 mi
| Address | Dist | Beds/Ba | Sqft | Sold | Price | $/sf | Match |
|---|---|---|---|---|---|---|---|
| 12614 Galatea | 0.06mi | 3/2.0 | 1,414 (0%) | 9mo | $216,200 | $153 | 90 |
| 12822 Cygnus | 0.14mi | 3/2.0 | 1,408 (-0%) | 13mo | $235,000 | $167 | 82 |
| 12622 Auriga | 0.22mi | 3/2.0 | 1,454 (+3%) | 21mo | $329,990 | $227 | 68 |
| 4919 Jovian | 0.14mi | 3/2.0 | 1,211 (-14%) | 2mo | $237,000 | $196 | 67 |
| 4607 Serpens | 0.24mi | 3/2.0 | 1,454 (+3%) | 22mo | $314,990 | $217 | 65 |
| 12850 Cygnus | 0.16mi | 3/2.0 | 1,211 (-14%) | 14mo | $230,000 | $190 | 58 |
| 12736 Cygnus | 0.18mi | 3/2.0 | 1,211 (-14%) | 14mo | $240,000 | $198 | 56 |
| 12511 Antilia | 0.16mi | 3/2.0 | 1,212 (-14%) | 15mo | $265,000 | $219 | 56 |
| 5928 Olson Blfs | 0.74mi | 3/2.0 | 1,353 (-4%) | 13mo | $255,000 | $188 | 47 |
Match score weights: distance 35% · size 25% · config 20% · recency 20%. Top-matched comps best support the ARV.
Projected returns pro-forma
-3.0% appreciation · 0.0% rent growth · sell at horizon
- IRR
- -18.0%
- Equity multiple
- 0.38×
- Total profit
- $-35,320
- Equity at exit
- $30,532
- IRR
- -17.2%
- Equity multiple
- 0.18×
- Total profit
- $-47,171
- Equity at exit
- $17,705
Cash invested: $57,336 (down + closing). Projections, not guarantees.
Landlord ↔ Tenant lean methodology
- Overall (STATE)
- 87 Strongly Landlord-Friendly
- State Texas
- 87 Strongly Landlord-Friendly · R+5
- County
- — inherits STATE
- City
- — inherits STATE
ZIP-level market 78245
- Home prices YoY
- -18.5%
- Rents YoY
- -3.0%
- Active inventory
- 1172
- Price-to-rent
- 9.4×
Monthly cashflow live
- Estimated rent
- $1,811 high interval (Pro) →
- Mortgage (P&I)
- −$1,074
- Tax from tax record
- −$184 /mo · $2,210/yr
- Insurance
- −$85
- HOA
- −$38
- Vacancy / Maint / Mgmt
- −$380
- Net cashflow
- $50
Break-even live
Sensitivity live
| Price | -10% $166 | -5% $108 | +0% $50 | +5% $-8 | +10% $-66 |
|---|---|---|---|---|---|
| Rent | -10% $-93 | -5% $-22 | +0% $50 | +5% $121 | +10% $193 |
| Rate | -1.0pp $153 | -0.5pp $102 | base $50 | +0.5pp $-3 | +1.0pp $-57 |
UW: 25.0% down · 7.5% · 30yr · 1.5% tax · 5.0% vac · 8.0% maint · 8.0% mgmt
Financing live
Cash to close
- Down payment
- $51,193
- Closing costs
- $6,143
- Reserves months
- —
- Total cash needed
- —
Loan-product check · same deal, 3 products live
Conventional
25% down · 7.5% · 30yr
- Down + closing
- —
- Monthly P&I
- —
- Monthly cashflow
- —
- DSCR
- —
- Eligible?
- —
Personal DTI + credit; lowest rate.
DSCR
20% down · 8.5% · 30yr
- Down + closing
- —
- Monthly P&I
- —
- Monthly cashflow
- —
- DSCR
- —
- Eligible?
- —
No personal income docs; deal must DSCR.
Hard money
10% down · 12.0% · 12mo
- Down + closing
- —
- Monthly P&I
- —
- Monthly cashflow
- —
- DSCR
- —
- Eligible?
- —
Short-term bridge; refi at stabilization.
Rent comps 40 comps
| Address | Beds | Baths | Sqft | Rent | $/sqft | DOM | Units | Dist |
|---|---|---|---|---|---|---|---|---|
| 12627 Corona Borealis San Antonio, TX | 3.0 | 2.0 | 1408 | $1,680 | $1.19 | 45d | 1 | 0.02mi |
| 13078 Cygnus San Antonio, TX | 4.0 | 1.0–3.0 | 1662 | $2,026 | $1.22 | 0d | 6 | 0.13mi |
| 12510 Galatea San Antonio, TX | 3.0 | 2.0 | 1212 | $1,575 | $1.30 | 19d | 1 | 0.15mi |
| 12515 Antilia San Antonio, TX | 3.0 | 2.0 | 1405 | $1,800 | $1.28 | 12d | 1 | 0.17mi |
| 5010 Jovian San Antonio, TX | 3.0 | 2.0 | 1536 | $2,100 | $1.37 | 6d | 1 | 0.20mi |
| 4615 Serpens San Antonio, TX | 3.0 | 2.5 | 1747 | $1,800 | $1.03 | 25d | 1 | 0.21mi |
| 12530 Larissa San Antonio, TX | 3.0 | 2.0 | 1661 | $2,300 | $1.38 | 25d | 1 | 0.25mi |
| 5565 Mansions Blfs San Antonio, TX | 1.0–4.0 | 1.0–3.0 | 1326 | $1,978 | $1.49 | 0d | 39 | 0.61mi |
| 5525 Mansions Blfs San Antonio, TX | 3.0 | 1.0–2.0 | 869 | $1,613 | $1.86 | 3d | 48 | 0.77mi |
| 12906 Olson Pt San Antonio, TX | 3.0 | 2.0 | 1554 | $1,780 | $1.15 | 19d | 1 | 0.84mi |
| 6023 Macdona Rdg San Antonio, TX | 4.0 | 2.0 | 1474 | $1,695 | $1.15 | 45d | 1 | 0.89mi |
| 12136 U.S. 90 Unit 710 San Antonio, TX | 2.0 | 2.0 | 967 | $1,650 | $1.71 | 0d | 1 | 0.97mi |
| 12136 W US Highway 90 San Antonio, TX | 2.0 | 1.0–2.0 | 867 | $1,580 | $1.82 | 0d | 21 | 0.99mi |
| 11806 Red Pheasant San Antonio, TX | 3.0 | 2.0 | 1252 | $1,550 | $1.24 | 6d | 1 | 1.05mi |
| 5115 Bay Breeze San Antonio, TX | 4.0 | 2.0 | 1512 | $1,849 | $1.22 | 45d | 1 | 1.05mi |
| 5035 Bay Breeze San Antonio, TX | 4.0 | 2.5 | 1834 | $1,950 | $1.06 | 25d | 1 | 1.08mi |
| 11752 Red Pheasant San Antonio, TX | 3.0 | 2.0 | 1246 | $1,595 | $1.28 | 25d | 1 | 1.10mi |
| 5022 Flight Sail San Antonio, TX | 3.0 | 2.0 | 1300 | $1,700 | $1.31 | 25d | 1 | 1.11mi |
| 10834 Quinn Ct San Antonio, TX | 3.0 | 2.5 | 1344 | $1,800 | $1.34 | 45d | 1 | 1.13mi |
| 11735 Midnight Rain San Antonio, TX | 4.0 | 2.0 | 1417 | $1,595 | $1.13 | 22d | 1 | 1.14mi |
| 11732 Red Pheasant San Antonio, TX | 3.0 | 2.5 | 1780 | $1,795 | $1.01 | 25d | 1 | 1.14mi |
| 12141 Pease Riv San Antonio, TX | 3.0 | 2.0 | 1396 | $1,595 | $1.14 | 4d | 1 | 1.14mi |
| 12118 Pease Riv San Antonio, TX | 3.0 | 2.0 | 1540 | $1,850 | $1.20 | 14d | 1 | 1.14mi |
| 10858 Quinn Ct San Antonio, TX | 2.0–5.0 | 2.0–3.5 | 1733 | $2,067 | $1.19 | 0d | 1 | 1.15mi |
| 11727 Black Rose San Antonio, TX | 3.0 | 2.0 | 1316 | $1,595 | $1.21 | 0d | 1 | 1.16mi |
| 10829 Emerick St San Antonio, TX | 3.0 | 2.5 | 1344 | $1,700 | $1.26 | 25d | 1 | 1.16mi |
| 4546 Longhorn Crst San Antonio, TX | 4.0 | 2.0 | 1720 | $2,200 | $1.28 | 0d | 1 | 1.17mi |
| 12126 Sampson Crk San Antonio, TX | 3.0 | 2.0 | 1489 | $1,895 | $1.27 | 25d | 1 | 1.17mi |
| 6436 Kingsley Edge San Antonio, TX | 4.0 | 2.0 | 1703 | $1,800 | $1.06 | 45d | 1 | 1.19mi |
| 12010 Mulberry Crk Unit NA San Antonio, TX | 3.0 | 2.0 | 1296 | $1,850 | $1.43 | 16d | 1 | 1.21mi |
| 6528 Chevler Pass San Antonio, TX | 3.0 | 2.0 | 1455 | $1,345 | $0.92 | 45d | 1 | 1.25mi |
| 11902 Mulberry Crk San Antonio, TX | 3.0 | 2.0 | 1413 | $1,647 | $1.17 | 45d | 1 | 1.27mi |
| 6528 Dodger Vly San Antonio, TX | 4.0 | 2.0 | 1822 | $1,800 | $0.99 | 45d | 1 | 1.27mi |
| 6519 Luckey Sq San Antonio, TX | 3.0 | 2.0 | 1404 | $1,550 | $1.10 | 6d | 1 | 1.28mi |
| 11620 Midnight Rain San Antonio, TX | 3.0 | 2.5 | 1780 | $1,735 | $0.97 | 0d | 1 | 1.29mi |
| 11620 Midnight Rain San Antonio, TX | 3.0 | 2.5 | 1780 | $1,850 | $1.04 | 45d | 1 | 1.29mi |
| 6550 Fledgely Way San Antonio, TX | 3.0 | 2.0 | 1562 | $1,700 | $1.09 | 45d | 1 | 1.30mi |
| 6525 Underwood Way San Antonio, TX | 3.0 | 2.5 | 1525 | $1,649 | $1.08 | 25d | 1 | 1.32mi |
| 3303 Mission Riv San Antonio, TX | 3.0 | 2.0 | 1489 | $1,850 | $1.24 | 45d | 1 | 1.33mi |
| 3232 Onion Crk San Antonio, TX | 3.0 | 2.0 | 1168 | $1,495 | $1.28 | 45d | 1 | 1.34mi |
HOA detail
- Monthly dues
- $38 · $456/yr
- Likely covers
- electric
Listing history 12 events
-
2026-06-21days on market $204,772 Active 19 DOM
-
2026-06-18days on market $204,772 Active 16 DOM
-
2026-06-17days on market $204,772 Active 15 DOM
-
2026-06-16days on market $204,772 Active 14 DOM
-
2026-06-15days on market $204,772 Active 13 DOM
-
2026-06-13statusdays on market $204,772 Active 11 DOM
-
2026-06-09days on market $204,772 New 7 DOM
-
2026-06-08days on market $204,772 New 6 DOM
-
2026-06-07days on market $204,772 New 5 DOM
-
2026-06-04days on market $204,772 New 2 DOM
-
2026-06-02remarks 516-char remark
-
2026-06-02$204,772 New 1 DOM
ⓘ Source: listings_history table (triggers on properties + properties_extension) + one-shot
backfill from property_details.listing_events for pre-trigger history.
Tax reassessment forecast TX · Resets to sale price
- Current annual tax
- $2,210 · $184/mo
- Projected year-2 tax
- $3,747 · $312/mo
- Expected delta
- +$1,538/yr (+$128/mo · 69.6%)
ⓘ Screening estimate from a state-policy table — verify with the county assessor before closing.
Climate risk First Street
- Flood 1/10 Low FEMA zone X (unshaded) · 0% chance over 30 yrs
- Wildfire 6/10 Major
- Heat 8/10 Severe 7 d/yr ≥109°F today · 22 d/yr by 30 yrs out
- Wind 8/10 Severe 80% chance of damaging wind over 30 yrs
- Air quality 2/10 Low 1 unhealthy d/yr today · 1 by 30 yrs out
Nearby sold comps map
Loading sold comps map…
Walkable amenities ~0.75 mi
Loading nearby amenities…
Taxation est. · year 1
- Rental income
- $21,736
- − Mortgage interest
- −$11,470
- − Property taxes
- −$2,210
- − Insurance
- −$1,024
- − Repairs & maintenance
- −$1,739
- − Management
- −$1,739
- − HOA
- −$456
- − Depreciation
- −$5,957
- Taxable loss
- −$2,858
- Est. tax savings @ 24.0%
- +$686
- After-tax cash flow
- $1,282/yr
For passive investors: Depreciation is non-cash, so a rental often shows a tax loss while cash-flowing — sheltering income. Rental losses are passive: they offset passive income freely, and up to $25,000/yr can offset ordinary (W-2) income if you actively participate and your MAGI is under $100k (phasing out to $0 by $150k); unused losses carry forward. On sale, claimed depreciation is recaptured at up to 25%, and gains may owe capital-gains tax (a 1031 exchange can defer both). Figures are a year-1 estimate at your 24.0% rate — not tax advice; consult a CPA.
Condition & rehab AI · 12 photos
This 1-story home requires moderate renovations, focusing on kitchen and bathroom updates, to improve its resale and rental value.
Repairs flagged
- Major Kitchen backsplash — No backsplash visible
- Major Bathroom backsplash — No backsplash visible
- Major Paint — Bare walls in kitchen and bathrooms
Value-add opportunities
- Both Paint kitchen and bathrooms — Fresh paint enhances curb appeal and interior aesthetics
- Both Install backsplash in kitchen and bathrooms — Backsplash adds functionality and visual appeal
Renovation cost estimate screening
| Repair item | Severity | Est. cost |
|---|---|---|
| Kitchen backsplash · No backsplash visible | Major | $15,000–50,000 |
| Bathroom backsplash · No backsplash visible | Major | $15,000–50,000 |
| Paint · Bare walls in kitchen and bathrooms | Major | $15,000–50,000 |
| Total estimated repair cost · 3 items | $45,000–150,000 |
Value-add ROI direction
- Both Paint kitchen and bathrooms — Fresh paint enhances curb appeal and interior aesthetics ↑
- Both Install backsplash in kitchen and bathrooms — Backsplash adds functionality and visual appeal ↑
ⓘ Cost ranges are severity-bucket heuristics (US national rule-of-thumb). Get contractor quotes + a written scope before underwriting a rehab budget.
Schools (NCES district)
- District
- Medina Valley ISD
- NCES district ID
- 4830060
- Math proficiency
- 48% ▼ -9.00%
- Reading proficiency
- 53% ▼ -2.00%
- Median HH income
- $60,596
- Composite
- 44.2/100
- National rank
- #2851
- State rank
- #148 of 826 in TX
Livability — San Antonio
- Score
- 80/100
- State rank
- #31
- US rank
- #1616
Category grades
Schools grade is shown separately in the Schools card above.
Census & demographics
- County
- Bexar County · 1,990,555 people
- City population
- 1,806,925
- Metro
- San Antonio-New Braunfels, TX
- Population (ZIP)
- 96,015
- Household income
- $90,029
- Rent vs Own
- Severe rent burden
- 2466.0
Population outlook (Bexar County) Hauer SSP2
- Today (2025)
- 2,336,851 people
- By 2030
- 2,560,728 · +9.6%
- By 2040
- 3,020,569 · +29.3%
- By 2050
- 3,493,522 · +49.5%
- By 2075
- 4,668,459 · +99.8%
- By 2100
- 5,533,242 · +136.8%
Race, ethnicity, and origin ACS 2023
- Neighborhood character
- Majority Hispanic (64%)
- Race & ethnicity
- Hispanic / Latino 64% Two or more races 27% White 20% Black 9% Asian 2%
- Hispanic origin (detail)
- Mexican 53% Puerto Rican 2%
- Common ancestry
- Slovak 1% Lithuanian 1% Romanian 1%
- Foreign-born
- 9% · Canada, Vietnam
- Languages at home
- 66% English-only · Spanish 30% Arabic 1% Tagalog/Filipino 1%
Political lean MEDSL · Bexar
- 2024 margin
- Lean D (+9.8) · D 54.3% · R 44.6% · Other 1.1%
- 2008→2024 swing
- +4.2pp toward D · 2008: 5.6pp · 2024: 9.8pp
- All cycles
- 2024: D+9.8 2020: D+18.2 2016: D+13.5 2012: D+4.6 2008: D+5.6
Not yet ingested
- Civics
- —
Market trends
- HPI YoY
- ▼ -53.31%
- Current HPI
- 234.7931
- Rent YoY
- ▼ -3.02%
- Metro
- San Antonio-New Braunfels, TX
- State GDP YoY
- ▲ 3.95%
- F500 in state
- 110
Industry mix (Fortune 500 HQ in TX)
| Industry | F500 HQs | Revenue |
|---|---|---|
| Energy | 16 | $1,198B |
|
||
| Technology | 5 | $198B |
|
||
| Engineering / Construction | 4 | $72B |
|
||
| Energy Services | 3 | $60B |
|
||
| Utilities | 3 | $41B |
|
||
| Healthcare | 2 | $330B |
|
||
Price history
-22.7% since first listed13 events — show timeline
- 2026-06-02 Listed $204,772 LERA
- 2024-02-05 Listing Removed — LERA
- 2024-01-26 Price Changed $298,900 LERA
- 2024-01-09 Price Changed $299,000 LERA
- 2023-11-04 Price Changed $299,900 LERA
- 2023-10-18 Price Changed $319,900 LERA
- 2023-09-14 Listed $320,000 LERA
- 2023-09-05 Sold (Public Records) — Public Records
- 2023-02-17 Listing Removed — LERA
- 2023-01-30 Sold (MLS) — LERA
- 2022-12-18 Pending — LERA
- 2022-11-12 Price Changed $259,990 LERA
- 2022-11-11 Listed $264,990 LERA
Property tax history
-36.2%/yrLatest (2025): $2,210 · -56.5% YoY. Source: county tax records.
Cash-flow waterfall
monthlySold comps — $/sqft
last 12 mo · ≤1 miLoading sold comps…