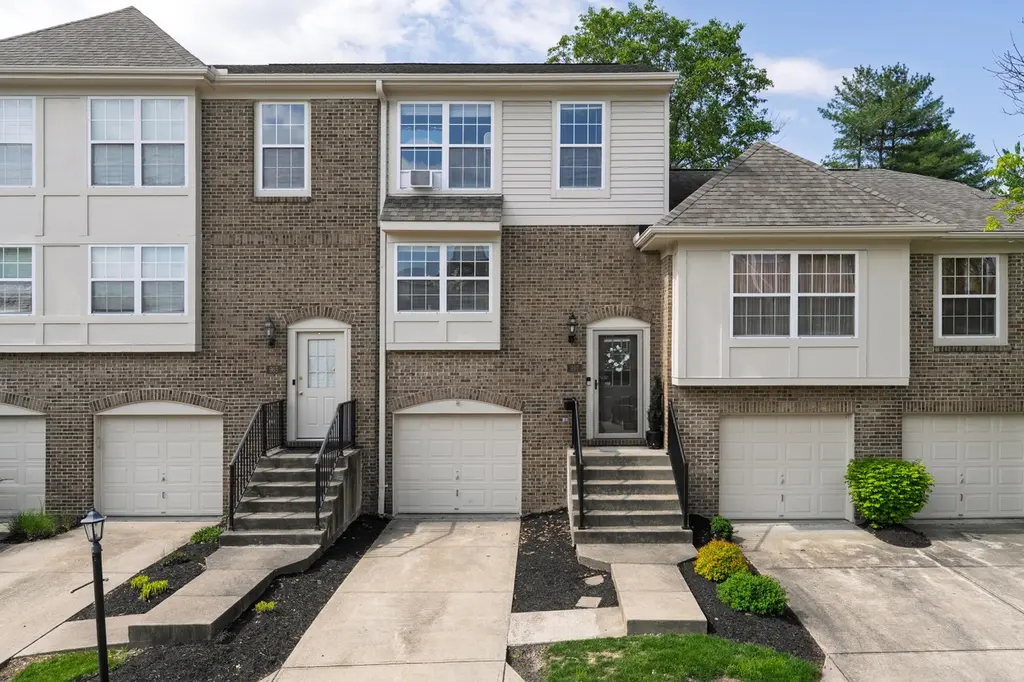
967 Augusta Ct · Union, KY
Flood risk 1/10 · Minimal
- FEMA flood zone
- X (unshaded)
- Chance of flooding over 30 yrs
- 0.0%
- Est. flood insurance / yr
- $473 – $860
Fire risk 1/10 · Minimal
- Est. fire insurance / yr
- $839 – $1,559
Heat risk 4/10 · Minor
- Hot days now (above 102°F)
- 7 days/yr
- Hot days in 30 yrs
- 19 days/yr
Wind risk 2/10 · Minimal
- Chance of severe wind over 30 yrs
- 1.0%
Air-quality risk 3/10 · Minor
- Unhealthy air days now
- 2 days/yr
- Unhealthy air days in 30 yrs
- 4 days/yr
Risk factors via First Street. Map © Google.
Why this score? — see what drove the D+ grade
The composite is a weighted blend of 9 inputs, each scored 0–100. Each bar is that input's sub-score; the figure is the points it added to the 100-point composite (weight × sub-score).
- ARV discount +15.0/15.0
- Cash flow +11.2/30.0
- 1% rule +4.3/10.0
- Schools +4.1/10.0
- Livability +3.9/5.0
- DSCR +3.3/10.0
- Rent growth +2.5/5.0
- Condition / age +2.5/5.0
- Appreciation +0.0/10.0
$223,500
🖨 Deal sheet 📄 Offer letter ✓ Due diligence
Listing remarks
Charming 3-Level Condo In Triple Crown - Your Perfect Retreat! 2 Bedrooms And 2 Baths: Thoughtfully Designed For Comfort And Convenience * Beautiful Kitchen: Featuring Elegant White Cabinets, Striking Black Granite Countertops, And A Stunning Glass Mosaic Tile Backsplash - All Appliances Stay * Spacious Living Quarters: Located On The First Level, The Living Room Walks Out To A Lush Backyard, Perfect For Relaxation And Entertaining * Versatile Basement: Ideal For A 3rd Bedroom, Workout Gym, Or Office - The Possibilities Are Endless * Why You'll Love It: This Condo Offers The Perfect Blend Of Style And Functionality, Making It An Ideal Home For Any Lifestyle. Located In The Desirable Triple
Key facts
- Lush backyard
- Versatile basement
- 3 level condo
Tags
Property features AI
Finance
- Other: Directions: Triple Crown to Promonade by Fischer to Turnberry to left on Augusta Ct.
- HOA & community: Monthly association fee of $275; HOA covers grounds and structure maintenance, snow removal and trash
Exterior
- Parking: Driveway; 1-car garage
- Security: Smoke detector(s)
- Utilities: Public water; Public sewer; Cable available; Sewer available; Water available
- Home design: Townhouse; Three or more levels; Existing structure; Built in 1997
- Construction: Brick and vinyl siding construction; Shingle roof; Poured concrete foundation
- Exterior features: Patio; Aluminum-clad, double-hung and slider windows; Paved road frontage on a city street; Irregular lot
Interior
- Kitchen: Electric oven; Electric range; Dishwasher; Disposal; Microwave; Refrigerator
- Bedrooms: Primary bedroom (16 x 12); Bedroom 2 (11 x 10)
- Bathrooms: 1 full bathroom; 1 half bathroom
- Heating & cooling: Central air conditioning; Forced air heating (electric)
- Interior features: Walk-in closets; Stone counters; Chandelier; High ceilings; Multi-panel doors; Recessed lighting; Marble, wood-burning fireplace; Partial basement
- Laundry & utility: Washer hookup; Electric dryer hookup (lower level)
Neighborhood map
What this means for you Summary
Snapshot
- This is a 2-bed/1.5-bath townhouse listed at $224k.
Deal economics
- At list price, monthly cash flow is $-85 ($-1k/yr) — negative.
- To cash-flow at today's rent, offer at most $209k (6.7% below list).
- To meet the 1% rule (rent ≥ 1% of price), the offer needs to be $207k (7.2% below list).
- Recommended offer: $207k (7.2% below list) — sets the bar for 1% rule.
- Cap rate 5.8% vs local median 2.4% in Union — top-decile yield for the area; either an underpriced asset or a hidden risk that comps aren't pricing in. Stress-test before assuming the spread holds.
Location & tenants
- Location reads 78/100 on livability (#79 in KY, #2,521 nationally) — a middle-class / working-renter tenant base. Strengths: crime A+, employment A+, housing A+; Watch: amenities F, commute F.
- Boone County (suburban): math 43% / reading 49% proficiency, ranked #12 of 165 in KY (top 7%) — families likely to look elsewhere, expect single-tenant / working-renter base with shorter leases.
- Zoned schools: New Haven Elementary School (math 60% / reading 54%, grade C+, #47 of 676 statewide, top 8%, 675 students, 22% FRL); Gray Middle School (math 57% / reading 61%, grade B, #3 of 217 statewide, top 1%, 1,029 students, 27% FRL); Larry A. Ryle High School (math 50% / reading 48%, grade D, #15 of 254 statewide, top 6%, 2,013 students, 32% FRL) — zoned schools at 27% FRL track the district average.
- Market conditions: 469 active listings in the ZIP; 1,430 units permitted in Boone County in 2024 (928 in 5+ unit buildings).
Forward outlook
- Local home prices are declining (-3.0%/yr); year-one equity from $2k of loan paydown is wiped out by about $7k of value loss. Plan a longer hold.
- Boone County population projected at +24% by 2050 — long-run rental-demand tailwind backs the buy-and-hold thesis.
Negotiation context
- It's been on market 22 days — a 2% lower offer ($220k) is reasonable based on typical stale-listing flexibility.
- Current owner paid $136k; list at $224k implies a 64% gain — meaningful room to come down on a strong offer.
Questions for the listing agent
- What do current leases actually rent for vs. the listed asking? Can we see a recent rent roll and the last 12 months of T-12 income?
- What does the HOA fee cover, when was the last increase, and are there any pending special assessments or reserve-fund shortfalls?
- Is there a deadline driving the sale (1031 exchange, divorce, estate, relocation)? That informs how much negotiation room exists.
- Schools are A-rated — typically a magnet for longer-tenancy family renters. What's the average tenant stay here, and is there a school-zone premium baked into asking?
- The area grade is low — what's the realistic commute time and amenity access for the typical tenant pool here? Any planned neighborhood developments (good or bad) we should know about?
- What's the average days-on-market for RENTAL listings here right now (not sales)? A rising rental-DOM trend means longer vacancies and softer asking-rent achievability than the comps imply.
- What's the recent tenant-quality profile in this submarket — average credit score on applications, eviction rate, late-payment / NSF rate, and stable-employment percentage? A property-management company in the area should have these aggregated.
- How much new for-sale + rental construction is in the pipeline within 1–3 miles? Heavy new supply typically softens prices + rents 12–24 months out; constrained supply supports both.
Investment metrics
- 1% rule
- 0.93% ✗
- Cap rate
- 5.84%
- Cash-on-cash
- -1.62%
- DSCR
- 0.93
- GRM
- 9.0
CMA / ARV
- ARV (on-the-fly)
- $273,456
- Comps found
- 7
Show comp detail 7 sales within ~0.75 mi
| Address | Dist | Beds/Ba | Sqft | Sold | Price | $/sf | Match |
|---|---|---|---|---|---|---|---|
| 936 Oakmont Ct | 0.04mi | 2/2.5 | 1,296 (0%) | 6mo | $229,900 | $177 | 89 |
| 10832 Doral Ct | 0.18mi | 2/1.5 | 1,296 (0%) | 13mo | $225,000 | $174 | 81 |
| 10878 St Andrews Dr | 0.12mi | 2/3.0 | 1,430 (+10%) | 1mo | $323,000 | $226 | 70 |
| 10893 Saint Andrews Dr | 0.11mi | 3/2.5 (+1) | 1,296 (0%) | 23mo | $224,500 | $173 | 66 |
| 10887 Saint Andrews Dr | 0.10mi | 2/3.0 | 1,104 (-15%) | 9mo | $232,500 | $211 | 58 |
| 10506 Masters Dr | 0.50mi | 2/2.5 | 1,428 (+10%) | 12mo | $317,000 | $222 | 46 |
| 10446 Masters Dr | 0.56mi | 2/2.5 | 1,428 (+10%) | 14mo | $328,250 | $230 | 41 |
Match score weights: distance 35% · size 25% · config 20% · recency 20%. Top-matched comps best support the ARV.
Projected returns pro-forma
-3.0% appreciation · 3.0% rent growth · sell at horizon
- IRR
- -18.9%
- Equity multiple
- 0.34×
- Total profit
- $-41,466
- Equity at exit
- $33,325
- IRR
- -11.3%
- Equity multiple
- 0.32×
- Total profit
- $-42,476
- Equity at exit
- $19,324
Cash invested: $62,580 (down + closing). Projections, not guarantees.
Landlord ↔ Tenant lean methodology
- Overall (STATE)
- 83 Strongly Landlord-Friendly
- State Kentucky
- 83 Strongly Landlord-Friendly · R+16
- County
- — inherits STATE
- City
- — inherits STATE
ZIP-level market 41091
- Active inventory
- 469
- Price-to-rent
- 9.0×
Monthly cashflow live
- Estimated rent
- $2,074 medium interval (Pro) →
- Mortgage (P&I)
- −$1,172
- Tax from tax record
- −$183 /mo · $2,198/yr
- Insurance
- −$93
- HOA
- −$275
- Vacancy / Maint / Mgmt
- −$436
- Net cashflow
- $-85
Break-even live
UW: 25.0% down · 7.5% · 30yr · 1.5% tax · 5.0% vac · 8.0% maint · 8.0% mgmt
Financing live
Cash to close
- Down payment
- $55,875
- Closing costs
- $6,705
- Reserves months
- —
- Total cash needed
- —
Loan-product check · same deal, 3 products live
Conventional
25% down · 7.5% · 30yr
- Down + closing
- —
- Monthly P&I
- —
- Monthly cashflow
- —
- DSCR
- —
- Eligible?
- —
Personal DTI + credit; lowest rate.
DSCR
20% down · 8.5% · 30yr
- Down + closing
- —
- Monthly P&I
- —
- Monthly cashflow
- —
- DSCR
- —
- Eligible?
- —
No personal income docs; deal must DSCR.
Hard money
10% down · 12.0% · 12mo
- Down + closing
- —
- Monthly P&I
- —
- Monthly cashflow
- —
- DSCR
- —
- Eligible?
- —
Short-term bridge; refi at stabilization.
HOA detail
- Monthly dues
- $275 · $3,300/yr
- Likely covers
- gym
Listing history 7 events
-
2026-05-15status Pending
-
2026-05-13price $223,500
-
2026-04-23$228,500 Active
-
2021-02-12soldstatus $136,000
-
2017-09-05soldstatus $122,000
-
1999-06-01soldstatus $97,000
-
1997-09-22soldstatus $100,014
ⓘ Source: listings_history table (triggers on properties + properties_extension) + one-shot
backfill from property_details.listing_events for pre-trigger history.
Tax reassessment forecast KY · Resets to sale price
- Current annual tax
- $2,198 · $183/mo
- Projected year-2 tax
- $2,198 · $183/mo
- Expected delta
- $0/yr ($0/mo · 0.0%)
ⓘ Screening estimate from a state-policy table — verify with the county assessor before closing.
Climate risk First Street
- Flood 1/10 Low FEMA zone X (unshaded) · 0% chance over 30 yrs
- Wildfire 1/10 Low
- Heat 4/10 Moderate 7 d/yr ≥102°F today · 19 d/yr by 30 yrs out
- Wind 2/10 Low 100% chance of damaging wind over 30 yrs
- Air quality 3/10 Moderate 2 unhealthy d/yr today · 4 by 30 yrs out
Nearby sold comps map
Loading sold comps map…
Walkable amenities ~0.75 mi
Loading nearby amenities…
Taxation est. · year 1
- Rental income
- $24,892
- − Mortgage interest
- −$12,519
- − Property taxes
- −$2,198
- − Insurance
- −$1,118
- − Repairs & maintenance
- −$1,991
- − Management
- −$1,991
- − HOA
- −$3,300
- − Depreciation
- −$6,502
- Taxable loss
- −$4,728
- Est. tax savings @ 24.0%
- +$1,135
- After-tax cash flow
- $119/yr
For passive investors: Depreciation is non-cash, so a rental often shows a tax loss while cash-flowing — sheltering income. Rental losses are passive: they offset passive income freely, and up to $25,000/yr can offset ordinary (W-2) income if you actively participate and your MAGI is under $100k (phasing out to $0 by $150k); unused losses carry forward. On sale, claimed depreciation is recaptured at up to 25%, and gains may owe capital-gains tax (a 1031 exchange can defer both). Figures are a year-1 estimate at your 24.0% rate — not tax advice; consult a CPA.
Schools (NCES district)
- District
- Boone County
- NCES district ID
- 2100510
- Math proficiency
- 43% ▼ -10.00%
- Reading proficiency
- 49% ▼ -12.00%
- Median HH income
- $68,096
- Composite
- 41.18/100
- National rank
- #3550
- State rank
- #12 of 165 in KY
Livability — Union
- Score
- 78/100
- State rank
- #79
- US rank
- #2521
Category grades
Schools grade is shown separately in the Schools card above.
Census & demographics
- Population (ZIP)
- 24,371
Population outlook (Boone County) Hauer SSP2
- Today (2025)
- 144,066 people
- By 2030
- 152,005 · +5.5%
- By 2040
- 166,776 · +15.8%
- By 2050
- 178,974 · +24.2%
- By 2075
- 204,515 · +42.0%
- By 2100
- 215,306 · +49.4%
Race, ethnicity, and origin ACS 2023
- Neighborhood character
- Predominantly White (90%)
- Race & ethnicity
- White 90% Two or more races 4% Asian 3% Black 2% Hispanic / Latino 2%
- Common ancestry
- Italian 4% Lithuanian 3% Serbian 2%
- Foreign-born
- 4% · Canada
- Languages at home
- 95% English-only · Spanish 1% Other Indo-European 1% Other Asian/Pacific 1%
Political lean MEDSL · Boone
- 2024 margin
- Solid R (+37.2) · D 30.6% · R 67.8% · Other 1.7%
- 2008→2024 swing
- -2.7pp toward R · 2008: -34.5pp · 2024: -37.2pp
- All cycles
- 2024: R+37.2 2020: R+35.7 2016: R+41.8 2012: R+38.7 2008: R+34.5
Not yet ingested
- Civics
- —
Market trends
- HPI YoY
- ▼ -101.29%
- Current HPI
- 175.3571
- Rent YoY
- —
- Metro
- —
- State GDP YoY
- ▲ 1.81%
- F500 in state
- 4
Industry mix (Fortune 500 HQ in KY)
| Industry | F500 HQs | Revenue |
|---|---|---|
| Healthcare | 1 | $118B |
|
||
| Food / Beverage | 1 | $7B |
|
||
Price history
+123.5% since first listed7 events — show timeline
- 2026-05-15 Pending — NKMLS
- 2026-05-13 Price Changed $223,500 NKMLS
- 2026-04-23 Listed $228,500 NKMLS
- 2021-02-12 Sold (Public Records) $136,000 Public Records
- 2017-09-05 Sold (Public Records) $122,000 Public Records
- 1999-06-01 Sold (Public Records) $97,000 Public Records
- 1997-09-22 Sold (Public Records) $100,014 Public Records
Property tax history
+5.5%/yrLatest (2025): $2,198 · +40.1% YoY. Source: county tax records.
Cash-flow waterfall
monthlySold comps — $/sqft
last 12 mo · ≤1 miLoading sold comps…