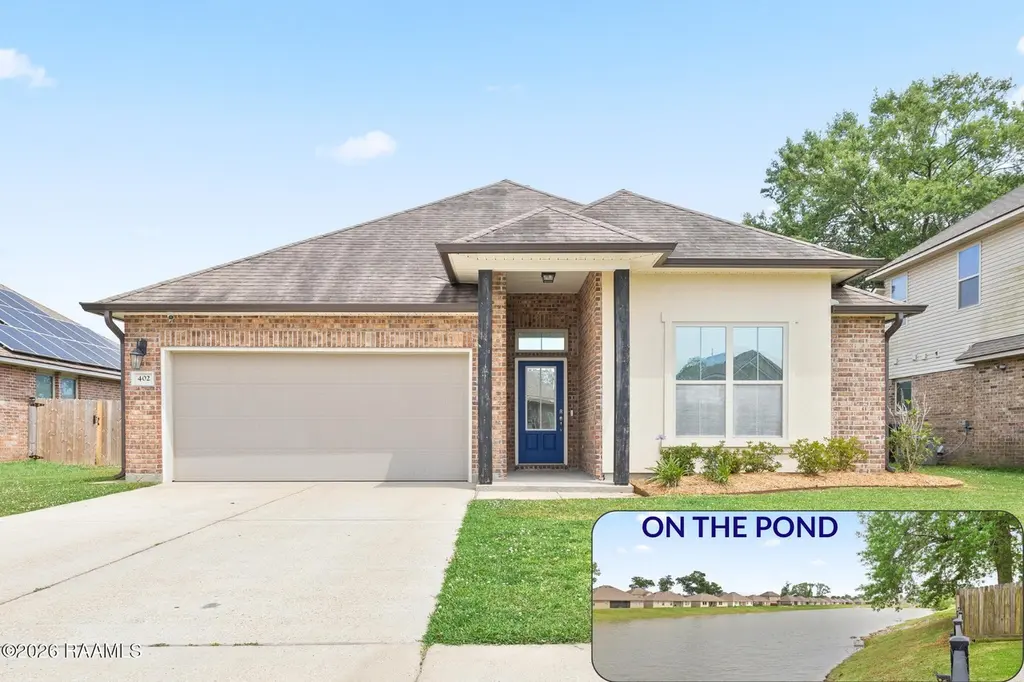
402 Norman Dr · Lafayette, LA
Flood risk 1/10 · Minimal
- FEMA flood zone
- X (unshaded)
- Chance of flooding over 30 yrs
- 0.0%
- Est. flood insurance / yr
- $507 – $1,088
Fire risk 1/10 · Minimal
- Est. fire insurance / yr
- $1,269 – $2,357
Heat risk 8/10 · Major
- Hot days now (above 109°F)
- 7 days/yr
- Hot days in 30 yrs
- 20 days/yr
Wind risk 9/10 · Severe
- Chance of severe wind over 30 yrs
- 99.0%
Air-quality risk 2/10 · Minimal
- Unhealthy air days now
- 1 days/yr
- Unhealthy air days in 30 yrs
- 1 days/yr
Risk factors via First Street. Map © Google.
Why this score? — see what drove the C- grade
The composite is a weighted blend of 9 inputs, each scored 0–100. Each bar is that input's sub-score; the figure is the points it added to the 100-point composite (weight × sub-score).
- Cash flow +20.6/30.0
- DSCR +6.5/10.0
- 1% rule +4.8/10.0
- ARV discount +4.4/15.0
- Rent growth +4.3/5.0
- Schools +3.6/10.0
- Livability +3.5/5.0
- Condition / age +2.5/5.0
- Appreciation +0.0/10.0
$256,500
🖨 Deal sheet 📄 Offer letter ✓ Due diligence
Listing remarks MLS
POND + GENERATOR!Be sure to check out this clean, well-kept home in Northwood Subdivision sitting on one of the more desirable pond lots in the neighborhood. 402 Norman Drive is fully move-in ready with the fence already done, blinds installed, appliances in place, and no projects waiting on the new owner.It has great curb appeal from the start with a sharp exterior and inviting blue front door. Inside, the home feels bright, fresh, and modern with an open layout through the living room and kitchen that makes the space feel larger and easy to live in. The primary bedroom offers a spacious walk-in closet, and out back you get one of the best features of the home: an extended screened-in patio overlooking the pond. Whether it's coffee in the morning or winding down in the evening, it's a setup you'll actually use. There's also a storage shed for the extra tools, lawn equipment, or overflow storage.Good lot, good layout, and a whole home generator is an added bonus for the upcoming hurricane season - this one is worth seeing in person.
Key facts
- 7,378 sq ft lot
- 2 garage spots
- Listed 51 days
Neighborhood map
What this means for you Summary
Snapshot
- This is a 4-bed/2.0-bath single-family listed at $256k.
Deal economics
- At list price, monthly cash flow is $340 ($4k/yr) — positive.
- The deal already cash-flows at list — no discount required.
- To meet the 1% rule (rent ≥ 1% of price), the offer needs to be $252k (1.9% below list).
- Recommended offer: $249k (3.0% below list) — sets the bar for market timing.
- Cap rate 7.9% vs local median 4.7% in Lafayette — top-decile yield for the area; either an underpriced asset or a hidden risk that comps aren't pricing in. Stress-test before assuming the spread holds.
Location & tenants
- Location reads 70/100 on livability (#63 in LA) — a middle-class / working-renter tenant base. Strengths: cost of living A+, housing A+, health & safety A+; Watch: amenities C-, employment C-, crime F.
- Lafayette Parish (urban): math 38% / reading 46% proficiency, ranked #19 of 98 in LA (top 19%) — families likely to look elsewhere, expect single-tenant / working-renter base with shorter leases.
- Market conditions: Rents rising fast (+7.3%/yr); 246 active listings in the ZIP; 2 comparable units currently listed for rent nearby; lower-income renter base — watch delinquency; 1,585 units permitted in Lafayette Parish in 2024 (10 in 5+ unit buildings).
- At $2,517/mo this rent would consume 91% of the median local household income ($33k/yr) (locally 2089% of renters already pay >50% of income on rent) — very limited rent-growth headroom before tenants either downsize or default.
Forward outlook
- Local home prices are declining (-3.0%/yr); year-one equity from $2k of loan paydown is wiped out by about $8k of value loss. Plan a longer hold.
- Lafayette County population projected at +34% by 2050 — long-run rental-demand tailwind backs the buy-and-hold thesis.
- At projected returns (-3.0% appreciation + 7.3% rent growth), your $72k cash investment doubles in ~10 years — after that, you're playing with house money.
Negotiation context
- It's been on market 51 days — a 3% lower offer ($249k) is reasonable based on typical stale-listing flexibility.
- 7 sale attempts since 9y ago with the ask held roughly flat each time — persistent listings suggest the price (not the market) is what's stuck; bring a comps-based counter.
Risks & watch-outs
- Climate carrying-cost: severe wind risk, 99% chance of damaging wind over 30y; extreme-heat days projected 7→20/yr by 2055 (HVAC capex compounding) — expect insurance premiums to compound above CPI over the hold.
Questions for the listing agent
- It's been on market 51 days. Have you received any prior offers? Is the seller open to a 3% concession, seller financing, or rate buy-down credit?
- What does the HOA fee cover, when was the last increase, and are there any pending special assessments or reserve-fund shortfalls?
- Is there a deadline driving the sale (1031 exchange, divorce, estate, relocation)? That informs how much negotiation room exists.
- Schools are B-rated — typically a magnet for longer-tenancy family renters. What's the average tenant stay here, and is there a school-zone premium baked into asking?
- Crime grade is F in this area — have there been break-ins, vandalism, or insurance claims at this property in the last 3 years? What carrier currently insures it and at what premium?
- What's the average days-on-market for RENTAL listings here right now (not sales)? A rising rental-DOM trend means longer vacancies and softer asking-rent achievability than the comps imply.
- What's the recent tenant-quality profile in this submarket — average credit score on applications, eviction rate, late-payment / NSF rate, and stable-employment percentage? A property-management company in the area should have these aggregated.
- How much new for-sale + rental construction is in the pipeline within 1–3 miles? Heavy new supply typically softens prices + rents 12–24 months out; constrained supply supports both.
Investment metrics
- 1% rule
- 0.98% ✗
- Cap rate
- 7.89%
- Cash-on-cash
- 5.69%
- DSCR
- 1.25
- GRM
- 8.5
CMA / ARV
- ARV (median comp)
- $240,172
- List price
- $256,500
- Delta
- 6.80%
- Verdict
- FAIR
- Comps
- 20 within 1.0 mi
Show comp detail 12 sales within ~0.75 mi
| Address | Dist | Beds/Ba | Sqft | Sold | Price | $/sf | Match |
|---|---|---|---|---|---|---|---|
| 332 White Pine Dr | 0.44mi | 4/2.0 | 2,079 (+4%) | 6mo | $269,000 | $129 | 69 |
| 323 White Pine Dr | 0.43mi | 4/2.0 | 1,874 (-6%) | 1mo | $249,000 | $133 | 69 |
| 328 White Pine Dr | 0.43mi | 4/2.0 | 1,874 (-6%) | 1mo | $254,500 | $136 | 68 |
| 330 White Pine Dr | 0.43mi | 5/3.0 (+1) | 2,087 (+4%) | 1mo | $269,500 | $129 | 63 |
| 325 White Pine Dr | 0.43mi | 4/2.0 | 1,836 (-8%) | 7mo | $250,000 | $136 | 60 |
| 120 Red Pine Dr | 0.53mi | 4/2.0 | 1,874 (-6%) | 6mo | $239,900 | $128 | 59 |
| 209 Norman Dr | 0.26mi | 3/3.0 (-1) | 2,178 (+9%) | 6mo | $140,000 | $64 | 59 |
| 102 Kingswood Dr | 0.29mi | 3/2.0 (-1) | 1,775 (-11%) | 4mo | $215,000 | $121 | 59 |
| 204 White Pine Dr | 0.41mi | 4/2.0 | 1,786 (-11%) | 6mo | $236,000 | $132 | 58 |
| 335 White Pine Dr | 0.43mi | 4/2.0 | 1,704 (-15%) | 1mo | $237,000 | $139 | 54 |
| 326 White Pine Dr | 0.43mi | 4/2.0 | 1,706 (-15%) | 7mo | $250,000 | $147 | 50 |
| 202 Walter Dr | 0.71mi | 4/2.5 | 1,800 (-10%) | 1mo | $169,000 | $94 | 47 |
Match score weights: distance 35% · size 25% · config 20% · recency 20%. Top-matched comps best support the ARV.
Projected returns pro-forma
-3.0% appreciation · 7.35% rent growth · sell at horizon
- IRR
- -3.0%
- Equity multiple
- 0.88×
- Total profit
- $-8,425
- Equity at exit
- $38,245
- IRR
- 10.8%
- Equity multiple
- 2.00×
- Total profit
- $72,044
- Equity at exit
- $22,177
Cash invested: $71,820 (down + closing). Projections, not guarantees.
Landlord ↔ Tenant lean methodology
- Overall (STATE)
- 90 Strongly Landlord-Friendly
- State Louisiana
- 90 Strongly Landlord-Friendly · R+12
- County
- — inherits STATE
- City
- — inherits STATE
ZIP-level market 70501
- Rents YoY
- 7.3%
- Active inventory
- 246
- Price-to-rent
- 8.5×
Monthly cashflow live
- Estimated rent
- $2,517 medium interval (Pro) →
- Mortgage (P&I)
- −$1,345
- Tax from tax record
- −$171 /mo · $2,051/yr
- Insurance
- −$107
- HOA
- −$25
- Vacancy / Maint / Mgmt
- −$529
- Net cashflow
- $340
Break-even live
UW: 25.0% down · 7.5% · 30yr · 1.5% tax · 5.0% vac · 8.0% maint · 8.0% mgmt
Financing live
Cash to close
- Down payment
- $64,125
- Closing costs
- $7,695
- Reserves months
- —
- Total cash needed
- —
Loan-product check · same deal, 3 products live
Conventional
25% down · 7.5% · 30yr
- Down + closing
- —
- Monthly P&I
- —
- Monthly cashflow
- —
- DSCR
- —
- Eligible?
- —
Personal DTI + credit; lowest rate.
DSCR
20% down · 8.5% · 30yr
- Down + closing
- —
- Monthly P&I
- —
- Monthly cashflow
- —
- DSCR
- —
- Eligible?
- —
No personal income docs; deal must DSCR.
Hard money
10% down · 12.0% · 12mo
- Down + closing
- —
- Monthly P&I
- —
- Monthly cashflow
- —
- DSCR
- —
- Eligible?
- —
Short-term bridge; refi at stabilization.
Rent comps 2 comps
| Address | Beds | Baths | Sqft | Rent | $/sqft | DOM | Units | Dist |
|---|---|---|---|---|---|---|---|---|
| 406 Starlight Dr Lafayette, LA | 4.0 | 2.0 | 1867 | $3,500 | $1.87 | 13d | 1 | 0.21mi |
| 109 Red Pine Dr Lafayette, LA | 4.0 | 3.0 | 2087 | $3,500 | $1.68 | 13d | 1 | 0.50mi |
HOA detail
- Monthly dues
- $25 · $300/yr
Listing history 31 events
-
2026-06-18days on market $256,500 Active 51 DOM
-
2026-06-17days on market $256,500 Active 50 DOM
-
2026-06-16days on market $256,500 Active 49 DOM
-
2026-06-15days on market $256,500 Active 48 DOM
-
2026-06-14days on market $256,500 Active 46 DOM
-
2026-06-13days on market $256,500 Active 45 DOM
-
2026-06-10days on market $256,500 Active 43 DOM
-
2026-06-09days on market $256,500 Active 42 DOM
-
2026-06-08days on market $256,500 Active 41 DOM
-
2026-06-07days on market $256,500 Active 40 DOM
-
2026-06-05days on market $256,500 Active 37 DOM
-
2026-06-03days on market $256,500 Active 36 DOM
-
2026-06-02days on market $256,500 Active 35 DOM
-
2026-06-01days on market $256,500 Active 34 DOM
-
2026-05-31days on market $256,500 Active 33 DOM
-
2026-05-30days on market $256,500 Active 32 DOM
-
2026-04-28$256,500 Active 1048-char remark
Show marketing remark (1048 chars)
POND + GENERATOR!Be sure to check out this clean, well-kept home in Northwood Subdivision sitting on one of the more desirable pond lots in the neighborhood. 402 Norman Drive is fully move-in ready with the fence already done, blinds installed, appliances in place, and no projects waiting on the new owner.It has great curb appeal from the start with a sharp exterior and inviting blue front door. Inside, the home feels bright, fresh, and modern with an open layout through the living room and kitchen that makes the space feel larger and easy to live in. The primary bedroom offers a spacious walk-in closet, and out back you get one of the best features of the home: an extended screened-in patio overlooking the pond. Whether it's coffee in the morning or winding down in the evening, it's a setup you'll actually use. There's also a storage shed for the extra tools, lawn equipment, or overflow storage.Good lot, good layout, and a whole home generator is an added bonus for the upcoming hurricane season - this one is worth seeing in person.
-
2025-04-30historical $2,000
-
2025-04-17$2,000
-
2025-03-27historical $2,000
-
2025-03-26price $260,000
-
2025-03-21$2,000
-
2025-02-01price $269,000
-
2024-12-27$275,000 Active
-
2024-04-18$275,000 Active
-
2022-04-20soldstatus $250,000
-
2022-04-19soldstatus $250,000 Sold
-
2022-03-08status Pending
-
2022-02-25$252,000 Active
-
2018-02-23soldstatus $213,500
-
2017-04-14$217,500
ⓘ Source: listings_history table (triggers on properties + properties_extension) + one-shot
backfill from property_details.listing_events for pre-trigger history.
Tax reassessment forecast LA · Resets to sale price
- Current annual tax
- $2,051 · $171/mo
- Projected year-2 tax
- $2,051 · $171/mo
- Expected delta
- $0/yr ($0/mo · 0.0%)
ⓘ Screening estimate from a state-policy table — verify with the county assessor before closing.
Climate risk First Street
- Flood 1/10 Low FEMA zone X (unshaded) · 0% chance over 30 yrs
- Wildfire 1/10 Low
- Heat 8/10 Severe 7 d/yr ≥109°F today · 20 d/yr by 30 yrs out
- Wind 9/10 Extreme 99% chance of damaging wind over 30 yrs
- Air quality 2/10 Low 1 unhealthy d/yr today · 1 by 30 yrs out
Nearby sold comps map
Loading sold comps map…
Walkable amenities ~0.75 mi
Loading nearby amenities…
Taxation est. · year 1
- Rental income
- $30,203
- − Mortgage interest
- −$14,368
- − Property taxes
- −$2,051
- − Insurance
- −$1,282
- − Repairs & maintenance
- −$2,416
- − Management
- −$2,416
- − HOA
- −$300
- − Depreciation
- −$7,462
- Taxable loss
- −$94
- Est. tax savings @ 24.0%
- +$22
- After-tax cash flow
- $4,107/yr
For passive investors: Depreciation is non-cash, so a rental often shows a tax loss while cash-flowing — sheltering income. Rental losses are passive: they offset passive income freely, and up to $25,000/yr can offset ordinary (W-2) income if you actively participate and your MAGI is under $100k (phasing out to $0 by $150k); unused losses carry forward. On sale, claimed depreciation is recaptured at up to 25%, and gains may owe capital-gains tax (a 1031 exchange can defer both). Figures are a year-1 estimate at your 24.0% rate — not tax advice; consult a CPA.
Schools (NCES district)
- District
- Lafayette Parish
- NCES district ID
- 2200870
- Math proficiency
- 38% ▼ -32.00%
- Reading proficiency
- 46% ▼ -24.00%
- Median HH income
- $50,238
- Composite
- 36.15/100
- National rank
- #4741
- State rank
- #19 of 98 in LA
Livability — Lafayette
- Score
- 70/100
- State rank
- #63
- US rank
- #8133
Category grades
Schools grade is shown separately in the Schools card above.
Census & demographics
- Census place
- Lafayette, LA
- County
- Lafayette Parish · 207,544 people
- City population
- 158,114
- Metro
- Lafayette, LA
- Population (ZIP)
- 26,465
- Household income
- $33,365
- Rent vs Own
- Severe rent burden
- 2089.0
Population outlook (Lafayette County) Hauer SSP2
- Today (2025)
- 280,930 people
- By 2030
- 301,092 · +7.2%
- By 2040
- 339,456 · +20.8%
- By 2050
- 375,156 · +33.5%
- By 2075
- 451,672 · +60.8%
- By 2100
- 497,203 · +77.0%
Race, ethnicity, and origin ACS 2023
- Neighborhood character
- Predominantly Black (73%)
- Race & ethnicity
- Black 73% White 18% Two or more races 6% Hispanic / Latino 4%
- Common ancestry
- Lithuanian 4%
- Foreign-born
- 2% · Canada
- Languages at home
- 95% English-only · Spanish 3% French/Haitian/Cajun 2%
Political lean MEDSL · Lafayette
- 2024 margin
- Solid R (+31.4) · D 33.5% · R 64.8% · Other 1.7%
- 2008→2024 swing
- -0.1pp no change · 2008: -31.3pp · 2024: -31.4pp
- All cycles
- 2024: R+31.4 2020: R+28.7 2016: R+33.6 2012: R+33.7 2008: R+31.3
Not yet ingested
- Civics
- —
Market trends
- HPI YoY
- ▼ -108.63%
- Current HPI
- 81.2963
- Rent YoY
- ▲ 7.35%
- Metro
- Lafayette, LA
- State GDP YoY
- ▲ 3.29%
- F500 in state
- 10
Industry mix (Fortune 500 HQ in LA)
| Industry | F500 HQs | Revenue |
|---|---|---|
| Telecommunications | 2 | $23B |
|
||
| Utilities | 1 | $12B |
|
||
| Wholesale / Distribution | 1 | $5B |
|
||
| Advertising | 1 | $2B |
|
||
Price history
+17.9% since first listed15 events — show timeline
- 2026-04-28 Listed $256,500 AcadianaMLS
- 2025-04-30 Rental Removed $2,000 RAAMLS
- 2025-04-17 Listed for Rent $2,000 RAAMLS
- 2025-03-27 Rental Removed $2,000 RAAMLS
- 2025-03-26 Price Changed $260,000 AcadianaMLS
- 2025-03-21 Listed for Rent $2,000 RAAMLS
- 2025-02-01 Price Changed $269,000 AcadianaMLS
- 2024-12-27 Listed $275,000 AcadianaMLS
- 2024-04-18 Listed $275,000 AcadianaMLS
- 2022-04-20 Sold (Public Records) $250,000 Public Records
- 2022-04-19 Sold (MLS) $250,000 AcadianaMLS
- 2022-03-08 Pending — AcadianaMLS
- 2022-02-25 Listed $252,000 AcadianaMLS
- 2018-02-23 Sold (MLS) $213,500 AcadianaMLS
- 2017-04-14 Listed $217,500 AcadianaMLS
Property tax history
+30.0%/yrLatest (2025): $2,051 · -1.1% YoY. Source: county tax records.
Cash-flow waterfall
monthlySold comps — $/sqft
last 12 mo · ≤1 miLoading sold comps…