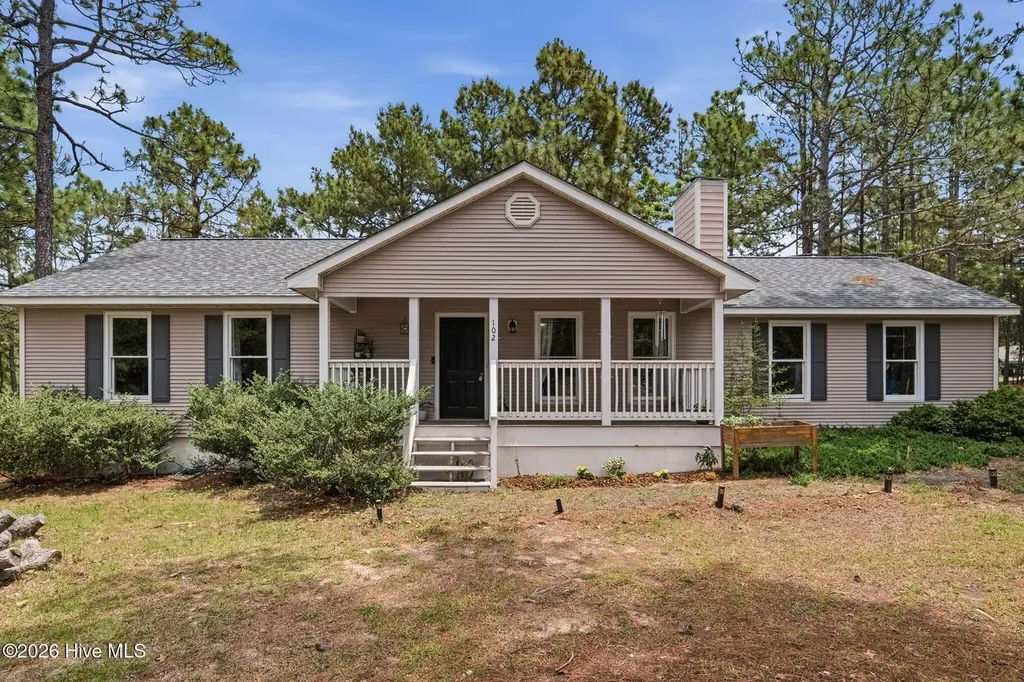
102 Pinesage Dr · Taylortown, NC
Flood risk 1/10 · Minimal
- FEMA flood zone
- X (unshaded)
- Chance of flooding over 30 yrs
- 0.0%
- Est. flood insurance / yr
- $507 – $1,088
Fire risk 3/10 · Minor
- Est. fire insurance / yr
- $906 – $1,684
Heat risk 6/10 · Moderate
- Hot days now (above 105°F)
- 7 days/yr
- Hot days in 30 yrs
- 16 days/yr
Wind risk 6/10 · Moderate
- Chance of severe wind over 30 yrs
- 59.0%
Air-quality risk 1/10 · Minimal
- Unhealthy air days now
- 0 days/yr
- Unhealthy air days in 30 yrs
- 0 days/yr
Risk factors via First Street. Map © Google.
Why this score? — see what drove the C grade
The composite is a weighted blend of 9 inputs, each scored 0–100. Each bar is that input's sub-score; the figure is the points it added to the 100-point composite (weight × sub-score).
- Cash flow +22.6/30.0
- ARV discount +8.8/15.0
- DSCR +7.3/10.0
- 1% rule +5.0/10.0
- Schools +4.4/10.0
- Livability +3.2/5.0
- Rent growth +2.5/5.0
- Condition / age +2.5/5.0
- Appreciation +0.0/10.0
$285,000
🖨 Deal sheet (PDF) 📄 Offer letter ✓ Due diligence
Listing remarks MLS
Gorgeous 3 bedroom single story home with 2 full baths. Home has been repaired with many upgrades to include but not limited to new flooring, new light and plumbing fixtures, new kitchen countertops, stainless steel appliances, new HVAC, new Roof, repaired deck and the interior has been freshly painted. Family room is complete with a stone wall fireplace, kitchen dining combo, and all bedrooms are very spacious and includes a 2 car garage.
Key facts
- Private back deck
- Ranch style home
- Commuter routes
Tags
Property features AI
Exterior
- Parking: 2 total parking spaces; 2-car attached garage; Parking areas include paved and gravel surfaces
- Utilities: Public water; Septic tank; Sewer and water connected
- Home design: Single-family residence; One level / single-story; Entry level: 1
- Construction: Vinyl siding and frame construction; Shingle roof; Crawl space / no basement
- Exterior features: Front porch; Property has a view; Paved road access
Interior
- Kitchen: Electric water heater
- Bedrooms: Total of 5 rooms (bedroom count not specified)
- Flooring: Carpet
- Bathrooms: 2 full bathrooms
- Heating & cooling: Central air conditioning; Electric heating; Heat pump
- Interior features: Vaulted ceilings; Ceiling fans
- Laundry & utility: Electric water heater
Neighborhood map
What this means for you Summary
Snapshot
- This is a 3-bed/1.5-bath single-family listed at $285k.
Deal economics
- At list price, monthly cash flow is $487 ($6k/yr) — positive.
- The deal already cash-flows at list — no discount required.
- Meets the 1% rule at list price ($3k rent vs $285k).
- Recommended offer: $281k (1.5% below list) — sets the bar for market timing.
Location & tenants
- Location reads 64/100 on livability (#356 in NC) — a middle-class / working-renter tenant base. Strengths: crime A+, cost of living A+, housing A+; Watch: health & safety C-, employment D, amenities F.
- Moore County Schools (rural): math 48% / reading 54% proficiency, ranked #58 of 178 in NC (top 33%) — acceptable for families but not a draw, mixed tenant base, ~2y average lease.
- Zoned schools: West Pine Elementary (math 51% / reading 58%, grade C, #302 of 1,410 statewide, top 23%, 395 students, 44% FRL); West Pine Middle (math 62% / reading 62%, grade B+, #37 of 475 statewide, top 8%, 688 students, 28% FRL); Pinecrest High (math 66% / reading 72%, grade B, #131 of 535 statewide, top 25%, 2,221 students, 34% FRL).
- Market conditions: 181 active listings in the ZIP; 941 units permitted in Moore County in 2024 (0 in 5+ unit buildings).
Forward outlook
- Local home prices are declining (-3.0%/yr); year-one equity from $2k of loan paydown is wiped out by about $9k of value loss. Plan a longer hold.
- Moore County population projected at +29% by 2050 — long-run rental-demand tailwind backs the buy-and-hold thesis.
Negotiation context
- It's been on market 21 days — a 2% lower offer ($281k) is reasonable based on typical stale-listing flexibility.
- 4 sale attempts since 7y ago with the ask held roughly flat each time — persistent listings suggest the price (not the market) is what's stuck; bring a comps-based counter.
- Current owner paid $188k; list at $285k implies a 52% gain — meaningful room to come down on a strong offer.
Risks & watch-outs
- Climate carrying-cost: major wind risk, 59% chance of damaging wind over 30y; extreme-heat days projected 7→16/yr by 2055 (HVAC capex compounding) — expect insurance premiums to compound above CPI over the hold.
Questions for the listing agent
- Is there a deadline driving the sale (1031 exchange, divorce, estate, relocation)? That informs how much negotiation room exists.
- Schools are F-rated, which usually means shorter tenancies and higher turnover. Who's the typical renter profile here, and what's been the actual vacancy rate?
- What's the average days-on-market for RENTAL listings here right now (not sales)? A rising rental-DOM trend means longer vacancies and softer asking-rent achievability than the comps imply.
- What's the recent tenant-quality profile in this submarket — average credit score on applications, eviction rate, late-payment / NSF rate, and stable-employment percentage? A property-management company in the area should have these aggregated.
- How much new for-sale + rental construction is in the pipeline within 1–3 miles? Heavy new supply typically softens prices + rents 12–24 months out; constrained supply supports both.
Investment metrics
- 1% rule
- 1.00% ✓
- Cap rate
- 8.34%
- Cash-on-cash
- 7.33%
- DSCR
- 1.33
- GRM
- 8.3
CMA / ARV
- ARV (on-the-fly)
- $293,580
- Comps found
- 6
Show comp detail 6 sales within ~0.75 mi
| Address | Dist | Beds/Ba | Sqft | Sold | Price | $/sf | Match |
|---|---|---|---|---|---|---|---|
| 105 Birch Pl | 0.08mi | 3/2.0 | 1,338 (+6%) | 13mo | $319,000 | $238 | 73 |
| 101 Pinesage Dr | 0.06mi | 3/2.0 | 1,390 (+10%) | 8mo | $315,000 | $227 | 71 |
| 109 Sage Ct | 0.16mi | 3/2.0 | 1,332 (+6%) | 15mo | $310,000 | $233 | 69 |
| 1681 Juniper Lake Rd | 0.47mi | 3/2.0 | 1,344 (+7%) | 1mo | $257,800 | $192 | 64 |
| 108 Oakcrest Ct | 0.09mi | 3/2.0 | 1,360 (+8%) | 23mo | $305,000 | $224 | 61 |
| 103 Sage Ct | 0.17mi | 3/2.0 | 1,409 (+12%) | 13mo | $340,000 | $241 | 59 |
Match score weights: distance 35% · size 25% · config 20% · recency 20%. Top-matched comps best support the ARV.
Projected returns pro-forma
-3.0% appreciation · 3.0% rent growth · sell at horizon
- IRR
- -5.1%
- Equity multiple
- 0.81×
- Total profit
- $-15,235
- Equity at exit
- $42,494
- IRR
- 4.5%
- Equity multiple
- 1.33×
- Total profit
- $26,357
- Equity at exit
- $24,642
Cash invested: $79,800 (down + closing). Projections, not guarantees.
Landlord ↔ Tenant lean methodology
- Overall (STATE)
- 85 Strongly Landlord-Friendly
- State North Carolina
- 85 Strongly Landlord-Friendly · R+3
- County
- — inherits STATE
- City
- — inherits STATE
ZIP-level market 27376
- Home prices YoY
- -30.2%
- Active inventory
- 181
- Price-to-rent
- 8.3×
Monthly cashflow live
- Estimated rent
- $2,853 medium interval (Pro) →
- Mortgage (P&I)
- −$1,495
- Tax from tax record
- −$154 /mo · $1,844/yr
- Insurance
- −$119
- HOA
- −$0
- Vacancy / Maint / Mgmt
- −$599
- Net cashflow
- $487
Break-even live
Sensitivity live
| Price | -10% $649 | -5% $568 | +0% $487 | +5% $407 | +10% $326 |
|---|---|---|---|---|---|
| Rent | -10% $262 | -5% $374 | +0% $487 | +5% $600 | +10% $713 |
| Rate | -1.0pp $631 | -0.5pp $560 | base $487 | +0.5pp $413 | +1.0pp $338 |
UW: 25.0% down · 7.5% · 30yr · 1.5% tax · 5.0% vac · 8.0% maint · 8.0% mgmt
Financing live
Cash to close
- Down payment
- $71,250
- Closing costs
- $8,550
- Reserves months
- —
- Total cash needed
- —
Loan-product check · same deal, 3 products live
Conventional
25% down · 7.5% · 30yr
- Down + closing
- —
- Monthly P&I
- —
- Monthly cashflow
- —
- DSCR
- —
- Eligible?
- —
Personal DTI + credit; lowest rate.
DSCR
20% down · 8.5% · 30yr
- Down + closing
- —
- Monthly P&I
- —
- Monthly cashflow
- —
- DSCR
- —
- Eligible?
- —
No personal income docs; deal must DSCR.
Hard money
10% down · 12.0% · 12mo
- Down + closing
- —
- Monthly P&I
- —
- Monthly cashflow
- —
- DSCR
- —
- Eligible?
- —
Short-term bridge; refi at stabilization.
Listing history 17 events
-
2026-06-22days on market $285,000 Active 21 DOM
-
2026-06-19days on market $285,000 Active 19 DOM
-
2026-06-18days on market $285,000 Active 18 DOM
-
2026-06-17days on market $285,000 Active 17 DOM
-
2026-06-16days on market $285,000 Active 16 DOM
-
2026-06-15days on market $285,000 Active 15 DOM
-
2026-06-14remarks 554-char remark
-
2026-06-14pricedays on market $285,000 Active 13 DOM
-
2026-06-13days on market $299,900 Active 12 DOM
-
2026-06-10days on market $299,900 Active 10 DOM
-
2026-06-09days on market $299,900 Active 9 DOM
-
2026-06-08days on market $299,900 Active 8 DOM
-
2026-06-07days on market $299,900 Active 7 DOM
-
2026-06-05days on market $299,900 Active 4 DOM
-
2026-06-02days on market $299,900 Active 2 DOM
-
2026-06-01remarks 526-char remark
-
2026-06-01$299,900 Active 1 DOM
ⓘ Source: listings_history table (triggers on properties + properties_extension) + one-shot
backfill from property_details.listing_events for pre-trigger history.
Tax reassessment forecast NC · Resets to sale price
- Current annual tax
- $1,844 · $154/mo
- Projected year-2 tax
- $2,337 · $195/mo
- Expected delta
- +$493/yr (+$41/mo · 26.7%)
ⓘ Screening estimate from a state-policy table — verify with the county assessor before closing.
Climate risk First Street
- Flood 1/10 Low FEMA zone X (unshaded) · 0% chance over 30 yrs
- Wildfire 3/10 Moderate
- Heat 6/10 Major 7 d/yr ≥105°F today · 16 d/yr by 30 yrs out
- Wind 6/10 Major 59% chance of damaging wind over 30 yrs
- Air quality 1/10 Low 0 unhealthy d/yr today · 0 by 30 yrs out
Nearby sold comps map
Loading sold comps map…
Walkable amenities ~0.75 mi
Loading nearby amenities…
Taxation est. · year 1
- Rental income
- $34,241
- − Mortgage interest
- −$15,964
- − Property taxes
- −$1,844
- − Insurance
- −$1,425
- − Repairs & maintenance
- −$2,739
- − Management
- −$2,739
- − Depreciation
- −$8,291
- Taxable income
- $1,238
- Est. tax owed @ 24.0%
- −$297
- After-tax cash flow
- $5,549/yr
For passive investors: Depreciation is non-cash, so a rental often shows a tax loss while cash-flowing — sheltering income. Rental losses are passive: they offset passive income freely, and up to $25,000/yr can offset ordinary (W-2) income if you actively participate and your MAGI is under $100k (phasing out to $0 by $150k); unused losses carry forward. On sale, claimed depreciation is recaptured at up to 25%, and gains may owe capital-gains tax (a 1031 exchange can defer both). Figures are a year-1 estimate at your 24.0% rate — not tax advice; consult a CPA.
Schools (NCES district)
- District
- Moore County Schools
- NCES district ID
- 3703090
- Math proficiency
- 48% ▲ 5.00%
- Reading proficiency
- 54% ▲ 5.00%
- Median HH income
- $50,333
- Composite
- 43.63/100
- National rank
- #2967
- State rank
- #58 of 178 in NC
Livability — Taylortown
- Score
- 64/100
- State rank
- #356
- US rank
- #14123
Category grades
Schools grade is shown separately in the Schools card above.
Census & demographics
- Census place
- Taylortown, NC
- Population (ZIP)
- 9,693
Population outlook (Moore County) Hauer SSP2
- Today (2025)
- 106,902 people
- By 2030
- 113,134 · +5.8%
- By 2040
- 125,682 · +17.6%
- By 2050
- 137,811 · +28.9%
- By 2075
- 164,387 · +53.8%
- By 2100
- 175,595 · +64.3%
Race, ethnicity, and origin ACS 2023
- Neighborhood character
- Predominantly White (75%)
- Race & ethnicity
- White 75% Black 13% Two or more races 9% Hispanic / Latino 2%
- Common ancestry
- Slovak 5% Lithuanian 4% Serbian 2%
- Foreign-born
- 1% · Canada
- Languages at home
- 97% English-only · Spanish 2% Chinese 1%
Political lean MEDSL · Moore
- 2024 margin
- Strong R (+29.5) · D 34.8% · R 64.3%
- 2008→2024 swing
- -8.1pp toward R · 2008: -21.4pp · 2024: -29.5pp
- All cycles
- 2024: R+29.5 2020: R+27.4 2016: R+29.6 2012: R+28.1 2008: R+21.4
Not yet ingested
- Civics
- —
Market trends
- HPI YoY
- ▼ -76.65%
- Current HPI
- 177.4703
- Rent YoY
- —
- Metro
- —
- State GDP YoY
- ▲ 3.28%
- F500 in state
- 26
Industry mix (Fortune 500 HQ in NC)
| Industry | F500 HQs | Revenue |
|---|---|---|
| Financial Services | 2 | $213B |
|
||
| Retail | 2 | $95B |
|
||
| Industrial Conglomerate | 1 | $38B |
|
||
| Metals / Steel | 1 | $35B |
|
||
| Utilities | 1 | $30B |
|
||
| Industrial Machinery | 1 | $19B |
|
||
Price history
+57.9% since first listed7 events — show timeline
- 2026-05-31 Listed $299,900 Hive MLS
- 2020-09-11 Sold (MLS) $188,000 LPRMLS
- 2020-09-11 Sold (MLS) $188,000 TMLS
- 2020-09-11 Sold (MLS) $188,000 Hive MLS
- 2019-10-02 Listed $189,900 Hive MLS
- 2019-09-27 Listed $189,900 LPRMLS
- 2019-09-27 Listed $189,900 TMLS
Property tax history
+5.0%/yrLatest (2024): $1,844 · -2.4% YoY. Source: county tax records.
Cash-flow waterfall
monthlySold comps — $/sqft
last 12 mo · ≤1 miLoading sold comps…