 🏗️ New Construction
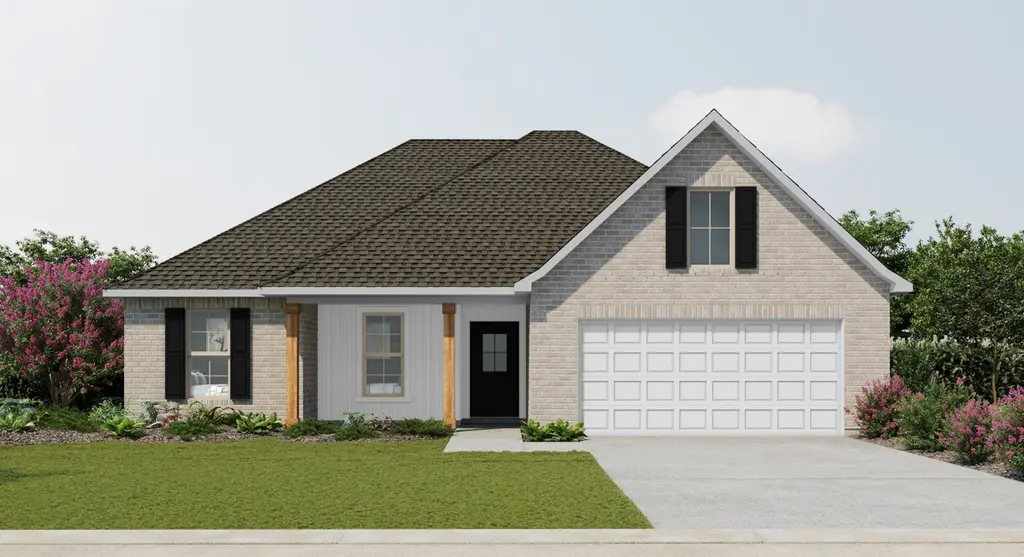
Ripley V G Plan · Carlyss, LA
Flood risk No data
- FEMA flood zone
- —
- Chance of flooding over 30 yrs
- —
- Est. flood insurance / yr
- —
Fire risk No data
- Est. fire insurance / yr
- —
Heat risk No data
- Hot days now (above threshold)
- —
- Hot days in 30 yrs
- —
Wind risk No data
- Chance of severe wind over 30 yrs
- —
Air-quality risk No data
- Unhealthy air days now
- —
- Unhealthy air days in 30 yrs
- —
Risk factors via First Street. Map © Google.
Why this score? — see what drove the F grade
The composite is a weighted blend of 9 inputs, each scored 0–100. Each bar is that input's sub-score; the figure is the points it added to the 100-point composite (weight × sub-score).
- Cash flow +10.2/30.0
- ARV discount +7.5/15.0
- Schools +3.1/10.0
- Livability +3.1/5.0
- 1% rule +3.0/10.0
- DSCR +2.9/10.0
- Rent growth +2.5/5.0
- Condition / age +1.0/5.0
- Appreciation +0.0/10.0
$248,990
🖨 Deal sheet 📄 Offer letter ✓ Due diligence
Listing remarks
- Open Floor Plan - Four Bedrooms, Two Bathrooms - Brick & Siding Exterior - Master Garden Tub - Separate Master Shower - Double Master Vanity - Double Walk-In Master Closets - Canned Lighting in Kitchen - Two Car Garage - Covered Rear Patio
Key facts
- Open floor plan
- Master garden tub
- Double master vanity
Tags
Property features AI
Finance
- Financial info: List price $247,990
Exterior
- Parking: 2-car garage / 2 total parking spaces
- Home design: Single-family plan (Ripley V G)
- Exterior features: Living area 1858
Interior
- Bedrooms: 4 bedrooms
- Bathrooms: 2 full bathrooms
- Interior features: Plan: Ripley V G; Active listing
Neighborhood map
What this means for you Summary
Snapshot
- This is a 4-bed/2.0-bath single-family listed at $249k. Condition is rated poor.
Deal economics
- At list price, monthly cash flow is $-185 ($-2k/yr) — negative.
- The deal already cash-flows at list — no discount required.
- Meets the 1% rule at list price ($3k rent vs $249k).
- Recommended offer: $242k (3.0% below list) — sets the bar for market timing.
- Cap rate 5.6% vs local median 8.3% in Carlyss — below-typical yield; the buyer is paying a premium for something (appreciation thesis, condition, location) that the cap rate doesn't capture.
Location & tenants
- Location reads 61/100 on livability (#237 in LA) — a middle-class / working-renter tenant base. Strengths: cost of living A+, housing A+, employment B; Watch: schools F, crime D-, amenities F.
- Calcasieu Parish (other): math 30% / reading 44% proficiency, ranked #29 of 98 in LA (top 30%) — families likely to look elsewhere, expect single-tenant / working-renter base with shorter leases.
- Market conditions: 236 active listings in the ZIP; 1,298 units permitted in Calcasieu Parish in 2024 (526 in 5+ unit buildings).
Forward outlook
- Local home prices are declining (-3.0%/yr); year-one equity from $2k of loan paydown is wiped out by about $10k of value loss. Plan a longer hold.
- Calcasieu County population projected at +11% by 2050 — modest demand growth; plan on rents tracking national, not racing it.
Negotiation context
- It's been on market 36 days — a 3% lower offer ($242k) is reasonable based on typical stale-listing flexibility.
Questions for the listing agent
- What do current leases actually rent for vs. the listed asking? Can we see a recent rent roll and the last 12 months of T-12 income?
- It's been on market 36 days. Have you received any prior offers? Is the seller open to a 3% concession, seller financing, or rate buy-down credit?
- Have any recent inspections been done? Can we get a copy of the seller's disclosures and any deferred-maintenance estimates?
- Is there a deadline driving the sale (1031 exchange, divorce, estate, relocation)? That informs how much negotiation room exists.
- Schools are F-rated, which usually means shorter tenancies and higher turnover. Who's the typical renter profile here, and what's been the actual vacancy rate?
- Crime grade is D in this area — have there been break-ins, vandalism, or insurance claims at this property in the last 3 years? What carrier currently insures it and at what premium?
- The area grade is low — what's the realistic commute time and amenity access for the typical tenant pool here? Any planned neighborhood developments (good or bad) we should know about?
- What's the average days-on-market for RENTAL listings here right now (not sales)? A rising rental-DOM trend means longer vacancies and softer asking-rent achievability than the comps imply.
- What's the recent tenant-quality profile in this submarket — average credit score on applications, eviction rate, late-payment / NSF rate, and stable-employment percentage? A property-management company in the area should have these aggregated.
- How much new for-sale + rental construction is in the pipeline within 1–3 miles? Heavy new supply typically softens prices + rents 12–24 months out; constrained supply supports both.
Investment metrics
- 1% rule
- 0.80% ✗
- Cap rate
- 5.61%
- Cash-on-cash
- -2.43%
- DSCR
- 0.89
- GRM
- 10.4
CMA / ARV
- ARV (median comp)
- $325,504
- List price
- $248,990
- Delta
- -23.51%
- Verdict
- UNDERPRICED
- Comps
- 20 within 1.0 mi
Show comp detail 3 sales within ~0.75 mi
| Address | Dist | Beds/Ba | Sqft | Sold | Price | $/sf | Match |
|---|---|---|---|---|---|---|---|
| 5231 Winnie Dr | 0.50mi | 4/3.0 | 1,841 (-1%) | 9mo | $275,000 | $149 | 63 |
| 222 Tara St | 0.36mi | 4/2.0 | 1,800 (-3%) | 20mo | $155,000 | $86 | 62 |
| 470 Garren Ln | 0.03mi | 3/2.0 (-1) | 1,686 (-9%) | 23mo | $232,900 | $138 | 59 |
Match score weights: distance 35% · size 25% · config 20% · recency 20%. Top-matched comps best support the ARV.
Projected returns pro-forma
-3.0% appreciation · 3.0% rent growth · sell at horizon
- IRR
- -20.3%
- Equity multiple
- 0.29×
- Total profit
- $-64,481
- Equity at exit
- $48,534
- IRR
- -13.4%
- Equity multiple
- 0.22×
- Total profit
- $-71,151
- Equity at exit
- $28,144
Cash invested: $91,141 (down + closing). Projections, not guarantees.
Landlord ↔ Tenant lean methodology
- Overall (STATE)
- 90 Strongly Landlord-Friendly
- State Louisiana
- 90 Strongly Landlord-Friendly · R+12
- County
- — inherits STATE
- City
- — inherits STATE
ZIP-level market 70665
- Active inventory
- 236
- Price-to-rent
- 7.9×
Monthly cashflow live
- Estimated rent
- $2,613 medium interval (Pro) →
- Mortgage (P&I)
- −$1,707
- Tax est. 1.5%
- −$407 /mo · $4,883/yr
- Insurance
- −$136
- HOA
- −$0
- Vacancy / Maint / Mgmt
- −$549
- Net cashflow
- $-185
Break-even live
UW: 25.0% down · 7.5% · 30yr · 1.5% tax · 5.0% vac · 8.0% maint · 8.0% mgmt
Financing live
Cash to close
- Down payment
- $81,376
- Closing costs
- $9,765
- Reserves months
- —
- Total cash needed
- —
Loan-product check · same deal, 3 products live
Conventional
25% down · 7.5% · 30yr
- Down + closing
- —
- Monthly P&I
- —
- Monthly cashflow
- —
- DSCR
- —
- Eligible?
- —
Personal DTI + credit; lowest rate.
DSCR
20% down · 8.5% · 30yr
- Down + closing
- —
- Monthly P&I
- —
- Monthly cashflow
- —
- DSCR
- —
- Eligible?
- —
No personal income docs; deal must DSCR.
Hard money
10% down · 12.0% · 12mo
- Down + closing
- —
- Monthly P&I
- —
- Monthly cashflow
- —
- DSCR
- —
- Eligible?
- —
Short-term bridge; refi at stabilization.
Listing history 17 events
-
2026-06-19days on market $248,990 Active 36 DOM
-
2026-06-18days on market $248,990 Active 35 DOM
-
2026-06-17days on market $248,990 Active 34 DOM
-
2026-06-16days on market $248,990 Active 33 DOM
-
2026-06-15days on market $248,990 Active 32 DOM
-
2026-06-14days on market $248,990 Active 30 DOM
-
2026-06-13days on market $248,990 Active 29 DOM
-
2026-06-10days on market $248,990 Active 27 DOM
-
2026-06-09days on market $248,990 Active 26 DOM
-
2026-06-08days on market $248,990 Active 25 DOM
-
2026-06-07days on market $248,990 Active 24 DOM
-
2026-06-05days on market $248,990 Active 21 DOM
-
2026-06-02days on market $248,990 Active 19 DOM
-
2026-06-01days on market $248,990 Active 18 DOM
-
2026-05-31days on market $248,990 Active 17 DOM
-
2026-05-30pricedays on market $248,990 Active 16 DOM
-
2026-05-14$247,990 Active 247-char remark
ⓘ Source: listings_history table (triggers on properties + properties_extension) + one-shot
backfill from property_details.listing_events for pre-trigger history.
Nearby sold comps map
Loading sold comps map…
Walkable amenities ~0.75 mi
Loading nearby amenities…
Taxation est. · year 1
- Rental income
- $31,361
- − Mortgage interest
- −$18,233
- − Property taxes
- −$4,883
- − Insurance
- −$1,628
- − Repairs & maintenance
- −$2,509
- − Management
- −$2,509
- − Depreciation
- −$9,469
- Taxable loss
- −$7,869
- Est. tax savings @ 24.0%
- +$1,889
- After-tax cash flow
- $-330/yr
For passive investors: Depreciation is non-cash, so a rental often shows a tax loss while cash-flowing — sheltering income. Rental losses are passive: they offset passive income freely, and up to $25,000/yr can offset ordinary (W-2) income if you actively participate and your MAGI is under $100k (phasing out to $0 by $150k); unused losses carry forward. On sale, claimed depreciation is recaptured at up to 25%, and gains may owe capital-gains tax (a 1031 exchange can defer both). Figures are a year-1 estimate at your 24.0% rate — not tax advice; consult a CPA.
Condition & rehab AI · 3 photos
This home requires extensive repairs and maintenance, including a new roof, exterior painting, and landscaping. Significant updates are needed to improve its condition and increase its resale and rental value.
Repairs flagged
- Major roof — The roof appears to be old and weathered, with visible signs of wear and tear.
- Major exterior siding — The siding and paint appear to be peeling and in need of repainting.
- Major landscaping — The landscaping appears to be overgrown and in need of trimming and maintenance.
Value-add opportunities
- Resale roof replacement — A new roof will significantly improve the home's curb appeal and increase its resale value.
- Resale exterior painting — Repainting the exterior will improve the home's curb appeal and increase its resale value.
- Both landscaping — A well-maintained landscape will improve the home's curb appeal and increase its resale and rental value.
- Both interior updates — Updating the interior will improve the home's overall condition and increase its resale and rental value.
- Both HVAC system — A new HVAC system will improve the home's comfort and energy efficiency, increasing its resale and rental value.
Renovation cost estimate screening
| Repair item | Severity | Est. cost |
|---|---|---|
| roof · The roof appears to be old and weathered, with visible signs of wear and tear. | Major | $15,000–50,000 |
| exterior siding · The siding and paint appear to be peeling and in need of repainting. | Major | $15,000–50,000 |
| landscaping · The landscaping appears to be overgrown and in need of trimming and maintenance. | Major | $15,000–50,000 |
| Total estimated repair cost · 3 items | $45,000–150,000 |
Value-add ROI direction
- Resale roof replacement — A new roof will significantly improve the home's curb appeal and increase its resale value. ↑
- Resale exterior painting — Repainting the exterior will improve the home's curb appeal and increase its resale value. ↑
- Both landscaping — A well-maintained landscape will improve the home's curb appeal and increase its resale and rental value. ↑
- Both interior updates — Updating the interior will improve the home's overall condition and increase its resale and rental value. ↑
- Both HVAC system — A new HVAC system will improve the home's comfort and energy efficiency, increasing its resale and rental value. ↑
ⓘ Cost ranges are severity-bucket heuristics (US national rule-of-thumb). Get contractor quotes + a written scope before underwriting a rehab budget.
Schools (NCES district)
- District
- Calcasieu Parish
- NCES district ID
- 2200330
- Math proficiency
- 30% ▼ -39.00%
- Reading proficiency
- 44% ▼ -33.00%
- Median HH income
- $44,700
- Composite
- 31.45/100
- National rank
- #5979
- State rank
- #29 of 98 in LA
Livability — Carlyss
- Score
- 61/100
- State rank
- #237
- US rank
- #18031
Category grades
Schools grade is shown separately in the Schools card above.
Census & demographics
- Census place
- Carlyss, LA
- Population (ZIP)
- 12,891
Population outlook (Calcasieu County) Hauer SSP2
- Today (2025)
- 212,179 people
- By 2030
- 218,199 · +2.8%
- By 2040
- 228,486 · +7.7%
- By 2050
- 236,208 · +11.3%
- By 2075
- 251,696 · +18.6%
- By 2100
- 247,848 · +16.8%
Race, ethnicity, and origin ACS 2023
- Neighborhood character
- Predominantly White (87%)
- Race & ethnicity
- White 87% Hispanic / Latino 6% Two or more races 4% Black 3%
- Hispanic origin (detail)
- Mexican 4%
- Common ancestry
- Lithuanian 8% Italian 3% Slovak 2%
- Foreign-born
- 3% · Canada
- Languages at home
- 92% English-only · Spanish 6% French/Haitian/Cajun 1% Other Indo-European 1%
Political lean MEDSL · Calcasieu
- 2024 margin
- Solid R (+39.6) · D 29.5% · R 69.0% · Other 1.5%
- 2008→2024 swing
- -15.0pp toward R · 2008: -24.6pp · 2024: -39.6pp
- All cycles
- 2024: R+39.6 2020: R+35.2 2016: R+33.3 2012: R+28.7 2008: R+24.6
Not yet ingested
- Civics
- —
Market trends
- HPI YoY
- ▼ -91.65%
- Current HPI
- 99.2379
- Rent YoY
- —
- Metro
- —
- State GDP YoY
- ▲ 3.29%
- F500 in state
- 10
Industry mix (Fortune 500 HQ in LA)
| Industry | F500 HQs | Revenue |
|---|---|---|
| Telecommunications | 2 | $23B |
|
||
| Utilities | 1 | $12B |
|
||
| Wholesale / Distribution | 1 | $5B |
|
||
| Advertising | 1 | $2B |
|
||
Cash-flow waterfall
monthlySold comps — $/sqft
last 12 mo · ≤1 miLoading sold comps…