 🏗️ New Construction
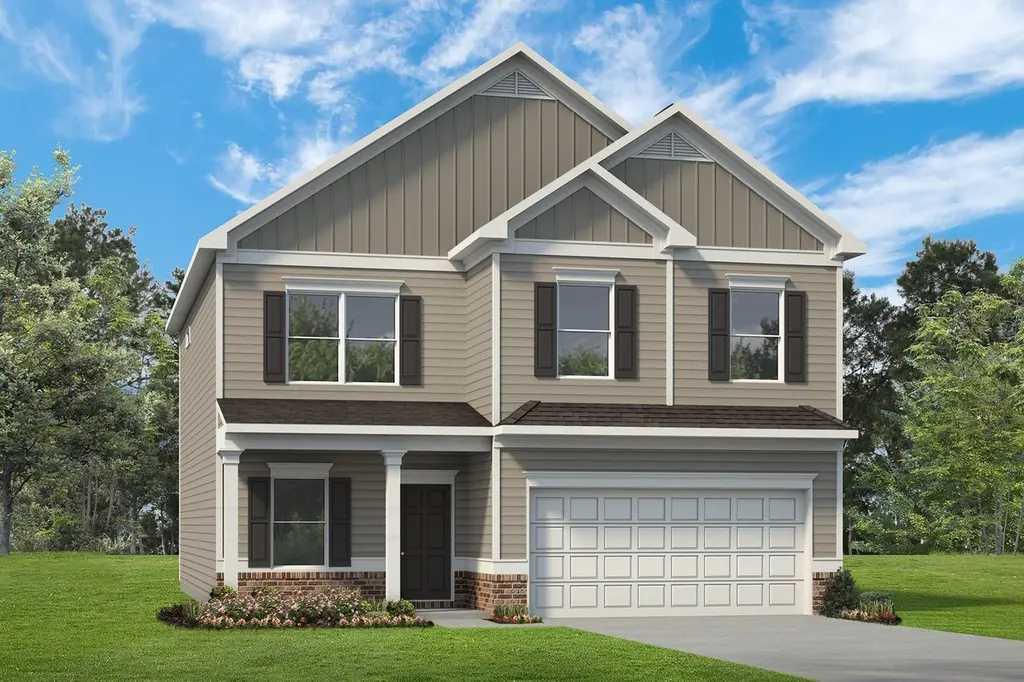
The Harrington Plan · Huntsville, AL
Flood risk 1/10 · Minimal
- FEMA flood zone
- X (unshaded)
- Chance of flooding over 30 yrs
- 0.0%
- Est. flood insurance / yr
- $507 – $1,088
Fire risk 4/10 · Minor
- Est. fire insurance / yr
- $916 – $1,700
Heat risk 5/10 · Moderate
- Hot days now (above 105°F)
- 7 days/yr
- Hot days in 30 yrs
- 21 days/yr
Wind risk 4/10 · Minor
- Chance of severe wind over 30 yrs
- 22.0%
Air-quality risk 2/10 · Minimal
- Unhealthy air days now
- 0 days/yr
- Unhealthy air days in 30 yrs
- 1 days/yr
Risk factors via First Street. Map © Google.
Why this score? — see what drove the F grade
The composite is a weighted blend of 9 inputs, each scored 0–100. Each bar is that input's sub-score; the figure is the points it added to the 100-point composite (weight × sub-score).
- ARV discount +7.5/15.0
- Cash flow +5.8/30.0
- Livability +4.1/5.0
- Schools +3.7/10.0
- Rent growth +3.4/5.0
- Condition / age +2.5/5.0
- 1% rule +1.2/10.0
- DSCR +0.2/10.0
- Appreciation +0.0/10.0
$334,900
🖨 Deal sheet (PDF) 📄 Offer letter ✓ Due diligence
Listing remarks MLS
Based on our top-selling plan, the Harrington delights with its massive second-floor owner's suite privately tucked away on the same level as its three additional bedrooms. The first floor impresses with an open concept family room, breakfast nook and large center island, plus a dining room that can be a living room, study or a 5th bedroom/bathroom. Explore your choices for the Harrington kitchen, using our Interactive Kitchen Designer Tool as well.
Key facts
- Breakfast nook
- Large center island
- Dining room
Tags
Neighborhood map
What this means for you Summary
Snapshot
- This is a 4-bed/2.5-bath single-family listed at $335k.
Deal economics
- At list price, monthly cash flow is $-818 ($-10k/yr) — negative.
- To cash-flow at today's rent, offer at most $292k (12.9% below list).
- To meet the 1% rule (rent ≥ 1% of price), the offer needs to be $255k (23.8% below list).
- Recommended offer: $255k (23.8% below list) — sets the bar for 1% rule.
Location & tenants
- Location reads 82/100 on livability (#3 in AL, #1,082 nationally) — a professional / high-income tenant draw. Strengths: commute A+, cost of living A+, housing A+; Watch: crime F.
- Madison County (rural): math 27% / reading 56% proficiency, ranked #19 of 129 in AL (top 15%) — families likely to look elsewhere, expect single-tenant / working-renter base with shorter leases.
- Zoned schools: Madison County Elementary School (math 17% / reading 47%, grade F, #331 of 627 statewide, top 57%, 412 students, 59% FRL); Madison County High School (math 32% / reading 42%, grade F, #39 of 305 statewide, top 13%, 483 students, 35% FRL) — zoned schools average 47% FRL vs 29% district-wide (18 pts higher); higher-poverty schools than district average — tighter screening recommended.
- Market conditions: Rents rising (+3.5%/yr); 374 active listings in the ZIP; 2 comparable units currently listed for rent nearby; high-income renter base; 4,709 units permitted in Madison County in 2024 (1,186 in 5+ unit buildings).
Forward outlook
- Local home prices are declining (-3.0%/yr); year-one equity from $3k of loan paydown is wiped out by about $12k of value loss. Plan a longer hold.
- Madison County population projected at +18% by 2050 — long-run rental-demand tailwind backs the buy-and-hold thesis.
Negotiation context
- It's been on market 69 days — a 6% lower offer ($315k) is reasonable based on typical stale-listing flexibility.
Risks & watch-outs
- Climate carrying-cost: extreme-heat days projected 7→21/yr by 2055 (HVAC capex compounding) — expect insurance premiums to compound above CPI over the hold.
Questions for the listing agent
- What do current leases actually rent for vs. the listed asking? Can we see a recent rent roll and the last 12 months of T-12 income?
- It's been on market 69 days. Have you received any prior offers? Is the seller open to a 24% concession, seller financing, or rate buy-down credit?
- Why hasn't it sold? Are there any deal-killer items the seller is aware of (foundation, flood, title, zoning, code violations)?
- Is there a deadline driving the sale (1031 exchange, divorce, estate, relocation)? That informs how much negotiation room exists.
- Crime grade is F in this area — have there been break-ins, vandalism, or insurance claims at this property in the last 3 years? What carrier currently insures it and at what premium?
- The area grade is low — what's the realistic commute time and amenity access for the typical tenant pool here? Any planned neighborhood developments (good or bad) we should know about?
- What's the average days-on-market for RENTAL listings here right now (not sales)? A rising rental-DOM trend means longer vacancies and softer asking-rent achievability than the comps imply.
- What's the recent tenant-quality profile in this submarket — average credit score on applications, eviction rate, late-payment / NSF rate, and stable-employment percentage? A property-management company in the area should have these aggregated.
- How much new for-sale + rental construction is in the pipeline within 1–3 miles? Heavy new supply typically softens prices + rents 12–24 months out; constrained supply supports both.
Investment metrics
- 1% rule
- 0.62% ✗
- Cap rate
- 3.90%
- Cash-on-cash
- -8.55%
- DSCR
- 0.62
- GRM
- 13.4
CMA / ARV
- ARV (median comp)
- $409,980
- List price
- $334,900
- Delta
- -18.31%
- Verdict
- UNDERPRICED
- Comps
- 20 within 1.0 mi
Show comp detail 12 sales within ~0.75 mi
| Address | Dist | Beds/Ba | Sqft | Sold | Price | $/sf | Match |
|---|---|---|---|---|---|---|---|
| 119 Ada Dr SE | 0.25mi | 4/2.5 | 2,476 (-4%) | 8mo | $489,900 | $198 | 76 |
| 3018 Crystal Creek Dr | 0.36mi | 4/3.0 | 2,413 (-6%) | 8mo | $437,000 | $181 | 65 |
| 3025 Crystal Creek Dr | 0.38mi | 4/3.0 | 2,718 (+6%) | 7mo | $485,000 | $178 | 64 |
| 3002 Watchhill Dr | 0.37mi | 4/2.0 | 2,408 (-6%) | 9mo | $389,000 | $162 | 63 |
| 106 Simmons Dr | 0.41mi | 3/3.5 (-1) | 2,462 (-4%) | 2mo | $535,000 | $217 | 63 |
| 3001 Crystal Creek Dr | 0.24mi | 3/2.5 (-1) | 2,287 (-11%) | 11mo | $395,000 | $173 | 57 |
| 136 SE Catherine Dr | 0.54mi | 3/2.0 (-1) | 2,370 (-8%) | 8mo | $459,000 | $194 | 49 |
| 3015 Chimney Cove Cir | 0.53mi | 4/4.0 | 2,861 (+12%) | 4mo | $555,000 | $194 | 46 |
| 259 Old Big Cove Rd | 0.57mi | 3/2.0 (-1) | 2,251 (-12%) | 10mo | $330,000 | $147 | 38 |
| 133 Plainview Dr SE | 0.66mi | 3/2.0 (-1) | 2,249 (-12%) | 6mo | $340,000 | $151 | 36 |
| 2508 Caldwell Park Ct | 0.67mi | 3/2.0 (-1) | 2,194 (-14%) | 5mo | $400,000 | $182 | 34 |
| 126 SE Catherine Dr | 0.60mi | 3/3.0 (-1) | 2,895 (+13%) | 12mo | $395,000 | $136 | 34 |
Match score weights: distance 35% · size 25% · config 20% · recency 20%. Top-matched comps best support the ARV.
Projected returns pro-forma
-3.0% appreciation · 3.54% rent growth · sell at horizon
- IRR
- -30.8%
- Equity multiple
- -0.02×
- Total profit
- $-117,092
- Equity at exit
- $61,129
- IRR
- -31.0%
- Equity multiple
- -0.42×
- Total profit
- $-163,097
- Equity at exit
- $35,448
Cash invested: $114,794 (down + closing). Projections, not guarantees.
Landlord ↔ Tenant lean methodology
- Overall (STATE)
- 90 Strongly Landlord-Friendly
- State Alabama
- 90 Strongly Landlord-Friendly · R+15
- County
- — inherits STATE
- City
- — inherits STATE
ZIP-level market 35763
- Home prices YoY
- -3.6%
- Rents YoY
- 3.5%
- Active inventory
- 374
- Price-to-rent
- 10.9×
Monthly cashflow live
- Estimated rent
- $2,551 medium interval (Pro) →
- Mortgage (P&I)
- −$2,150
- Tax est. 1.5%
- −$512 /mo · $6,150/yr
- Insurance
- −$171
- HOA
- −$0
- Vacancy / Maint / Mgmt
- −$536
- Net cashflow
- $-818
Break-even live
Sensitivity live
| Price | -10% $-535 | -5% $-676 | +0% $-818 | +5% $-960 | +10% $-1,101 |
|---|---|---|---|---|---|
| Rent | -10% $-1,019 | -5% $-919 | +0% $-818 | +5% $-717 | +10% $-616 |
| Rate | -1.0pp $-611 | -0.5pp $-714 | base $-818 | +0.5pp $-924 | +1.0pp $-1,032 |
UW: 25.0% down · 7.5% · 30yr · 1.5% tax · 5.0% vac · 8.0% maint · 8.0% mgmt
Financing live
Cash to close
- Down payment
- $102,495
- Closing costs
- $12,299
- Reserves months
- —
- Total cash needed
- —
Loan-product check · same deal, 3 products live
Conventional
25% down · 7.5% · 30yr
- Down + closing
- —
- Monthly P&I
- —
- Monthly cashflow
- —
- DSCR
- —
- Eligible?
- —
Personal DTI + credit; lowest rate.
DSCR
20% down · 8.5% · 30yr
- Down + closing
- —
- Monthly P&I
- —
- Monthly cashflow
- —
- DSCR
- —
- Eligible?
- —
No personal income docs; deal must DSCR.
Hard money
10% down · 12.0% · 12mo
- Down + closing
- —
- Monthly P&I
- —
- Monthly cashflow
- —
- DSCR
- —
- Eligible?
- —
Short-term bridge; refi at stabilization.
Rent comps 2 comps
| Address | Beds | Baths | Sqft | Rent | $/sqft | DOM | Units | Dist |
|---|---|---|---|---|---|---|---|---|
| 125 Camp Ground Rd Brownsboro, AL | 4.0 | 2.0 | 2558 | $2,500 | $0.98 | 15d | 1 | 0.52mi |
| 3023 Peevey Creek Ln Owens Cross Roads, AL | 3.0 | 2.0 | 1903 | $2,400 | $1.26 | 25d | 1 | 1.24mi |
Listing history 15 events
-
2026-06-22days on market $334,900 Active 69 DOM
-
2026-06-18days on market $334,900 Active 66 DOM
-
2026-06-17days on market $334,900 Active 65 DOM
-
2026-06-16days on market $334,900 Active 64 DOM
-
2026-06-15days on market $334,900 Active 63 DOM
-
2026-06-14days on market $334,900 Active 61 DOM
-
2026-06-10days on market $334,900 Active 58 DOM
-
2026-06-09days on market $334,900 Active 57 DOM
-
2026-06-08days on market $334,900 Active 56 DOM
-
2026-06-07days on market $334,900 Active 55 DOM
-
2026-06-02days on market $334,900 Active 50 DOM
-
2026-06-01days on market $334,900 Active 49 DOM
-
2026-05-31days on market $334,900 Active 48 DOM
-
2026-05-30days on market $334,900 Active 47 DOM
-
2026-04-14$334,900 Active 453-char remark
Show marketing remark (453 chars)
Based on our top-selling plan, the Harrington delights with its massive second-floor owner's suite privately tucked away on the same level as its three additional bedrooms. The first floor impresses with an open concept family room, breakfast nook and large center island, plus a dining room that can be a living room, study or a 5th bedroom/bathroom. Explore your choices for the Harrington kitchen, using our Interactive Kitchen Designer Tool as well.
ⓘ Source: listings_history table (triggers on properties + properties_extension) + one-shot
backfill from property_details.listing_events for pre-trigger history.
Climate risk First Street
- Flood 1/10 Low FEMA zone X (unshaded) · 0% chance over 30 yrs
- Wildfire 4/10 Moderate
- Heat 5/10 Major 7 d/yr ≥105°F today · 21 d/yr by 30 yrs out
- Wind 4/10 Moderate 22% chance of damaging wind over 30 yrs
- Air quality 2/10 Low 0 unhealthy d/yr today · 1 by 30 yrs out
Nearby sold comps map
Loading sold comps map…
Walkable amenities ~0.75 mi
Loading nearby amenities…
Taxation est. · year 1
- Rental income
- $30,614
- − Mortgage interest
- −$22,965
- − Property taxes
- −$6,150
- − Insurance
- −$2,050
- − Repairs & maintenance
- −$2,449
- − Management
- −$2,449
- − Depreciation
- −$11,927
- Taxable loss
- −$17,376
- Est. tax savings @ 24.0%
- +$4,170
- After-tax cash flow
- $-5,644/yr
For passive investors: Depreciation is non-cash, so a rental often shows a tax loss while cash-flowing — sheltering income. Rental losses are passive: they offset passive income freely, and up to $25,000/yr can offset ordinary (W-2) income if you actively participate and your MAGI is under $100k (phasing out to $0 by $150k); unused losses carry forward. On sale, claimed depreciation is recaptured at up to 25%, and gains may owe capital-gains tax (a 1031 exchange can defer both). Figures are a year-1 estimate at your 24.0% rate — not tax advice; consult a CPA.
Schools (NCES district)
- District
- Madison County
- NCES district ID
- 0102220
- Math proficiency
- 27% ▼ -32.00%
- Reading proficiency
- 56% ▼ -1.00%
- Median HH income
- $66,058
- Composite
- 37.15/100
- National rank
- #4483
- State rank
- #19 of 129 in AL
Livability — Huntsville
- Score
- 82/100
- State rank
- #3
- US rank
- #1082
Category grades
Schools grade is shown separately in the Schools card above.
Census & demographics
- County
- Madison County · 380,832 people
- City population
- 220,435
- Metro
- Huntsville, AL
- Population (ZIP)
- 19,819
- Household income
- $123,497
- Rent vs Own
- Severe rent burden
- 73.0
Population outlook (Madison County) Hauer SSP2
- Today (2025)
- 392,086 people
- By 2030
- 409,788 · +4.5%
- By 2040
- 440,557 · +12.4%
- By 2050
- 460,990 · +17.6%
- By 2075
- 502,872 · +28.3%
- By 2100
- 513,623 · +31.0%
Race, ethnicity, and origin ACS 2023
- Neighborhood character
- Predominantly White (85%)
- Race & ethnicity
- White 85% Two or more races 8% Hispanic / Latino 5% Black 2% Asian 2%
- Common ancestry
- Italian 5% Slovak 2% Serbian 2%
- Foreign-born
- 4% · Canada
- Languages at home
- 95% English-only · Other Indo-European 2% Spanish 1% Russian/Polish/Slavic 1%
Political lean MEDSL · Madison
- 2024 margin
- Lean R (+9.0) · D 44.7% · R 53.7% · Other 1.6%
- 2008→2024 swing
- +6.0pp toward D · 2008: -14.9pp · 2024: -9.0pp
- All cycles
- 2024: R+9.0 2020: R+8.0 2016: R+16.8 2012: R+18.7 2008: R+14.9
Not yet ingested
- Civics
- —
Market trends
- HPI YoY
- ▼ -10.43%
- Current HPI
- 281.0561
- Rent YoY
- ▲ 3.54%
- Metro
- Huntsville, AL
- State GDP YoY
- ▲ 2.94%
- F500 in state
- 4
Industry mix (Fortune 500 HQ in AL)
| Industry | F500 HQs | Revenue |
|---|---|---|
| Financial Services | 1 | $8B |
|
||
| Healthcare | 1 | $5B |
|
||
Price history
1 event — show timeline
- 2026-04-14 Listed $334,900 Zillow
Cash-flow waterfall
monthlySold comps — $/sqft
last 12 mo · ≤1 miLoading sold comps…