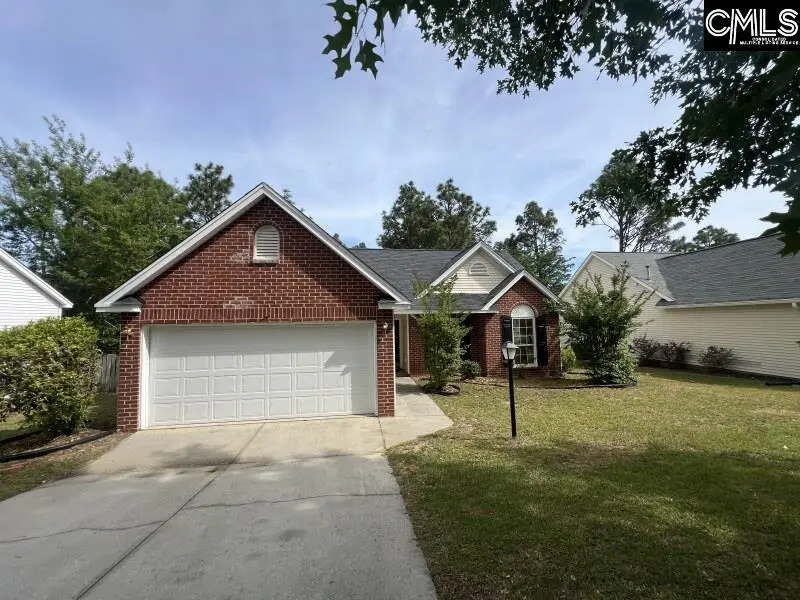
514 Ridge Trail Dr · Columbia, SC
Flood risk 1/10 · Minimal
- FEMA flood zone
- X (unshaded)
- Chance of flooding over 30 yrs
- 0.0%
- Est. flood insurance / yr
- $507 – $1,088
Fire risk 1/10 · Minimal
- Est. fire insurance / yr
- $783 – $1,453
Heat risk 7/10 · Major
- Hot days now (above 107°F)
- 7 days/yr
- Hot days in 30 yrs
- 16 days/yr
Wind risk 6/10 · Moderate
- Chance of severe wind over 30 yrs
- 63.0%
Air-quality risk 3/10 · Minor
- Unhealthy air days now
- 2 days/yr
- Unhealthy air days in 30 yrs
- 3 days/yr
Risk factors via First Street. Map © Google.
Why this score? — see what drove the B+ grade
The composite is a weighted blend of 9 inputs, each scored 0–100. Each bar is that input's sub-score; the figure is the points it added to the 100-point composite (weight × sub-score).
- Cash flow +30.0/30.0
- ARV discount +15.0/15.0
- DSCR +10.0/10.0
- 1% rule +9.0/10.0
- Livability +3.9/5.0
- Schools +3.6/10.0
- Rent growth +3.2/5.0
- Condition / age +2.5/5.0
- Appreciation +0.0/10.0
$134,750
🖨 Deal sheet 📄 Offer letter ✓ Due diligence
Listing remarks
Solid brick and vinyl construction with great bones and strong upside potential. This 3BR/2BA home offers 1,250 heated square feet, an attached 2-car garage, and a functional floor plan. The living room includes laminate flooring and a fireplace, and the primary suite features cathedral ceilings, a walk-in closet, and double vanity. The property needs repairs but provides an excellent opportunity for investors, flippers, or buyers looking to build equity. Deck in place for outdoor living. With updates, this home can shine again. Disclaimer: CMLS has not reviewed and, therefore, does not endorse vendors who may appear in listings.
Key facts
- Laminate flooring
- Walk-in closet
- Cathedral ceilings
Tags
Property features AI
Exterior
- Parking: Attached garage (main level); Two total parking spaces, including one garage space
- Utilities: Public water; Public sewer
- Home design: Single-story home
- Construction: Slab foundation
- Exterior features: Deck; Part brick (above foundation) and vinyl exterior; Paved road access
Interior
- Kitchen: Kitchen on the main level with laminate floor
- Bedrooms: Master suite on the main level with double vanity, garden tub, private bath, ceiling fan and private closet; Two additional main-level bedrooms with private closets and shared bath
- Flooring: Laminate floors in bedrooms, formal dining and living areas
- Bathrooms: Two full baths
- Heating & cooling: Central heating; Central air conditioning
- Interior features: Fireplace; Ceiling fans; Laminate flooring throughout main living areas
- Laundry & utility: Washer and dryer on the main level
Neighborhood map
What this means for you Summary
Snapshot
- This is a 3-bed/2.0-bath single-family listed at $135k.
Deal economics
- At list price, monthly cash flow is $587 ($7k/yr) — positive.
- The deal already cash-flows at list — no discount required.
- Meets the 1% rule at list price ($2k rent vs $135k).
- Cap rate 11.5% vs local median 5.0% in Columbia — top-decile yield for the area; either an underpriced asset or a hidden risk that comps aren't pricing in. Stress-test before assuming the spread holds.
Location & tenants
- Location reads 78/100 on livability (#18 in SC, #2,436 nationally) — a middle-class / working-renter tenant base. Strengths: amenities A+, commute A+, cost of living A+; Watch: employment D, crime F.
- Richland 02 (suburban): math 35% / reading 47% proficiency, ranked #29 of 80 in SC (top 36%) — families likely to look elsewhere, expect single-tenant / working-renter base with shorter leases.
- Zoned schools: Rice Creek Elementary (math 36% / reading 34%, grade F, #339 of 597 statewide, top 57%, 737 students, 76% FRL); Ridge View High (math 43% / reading 76%, grade C+, #110 of 196 statewide, top 58%, 1,711 students, 60% FRL) — zoned schools average 68% FRL vs 38% district-wide (30 pts higher); higher-poverty schools than district average — tighter screening recommended.
- Market conditions: Rents rising (+2.8%/yr); 406 active listings in the ZIP; 17 comparable units currently listed for rent nearby; rentals at typical pace (median 14d on market — plan ~3-4 weeks tenant-placement turnaround); 3,472 units permitted in Richland County in 2024 (1,096 in 5+ unit buildings).
- This rent runs 31% of the median local income ($74k/yr) — at the standard rent-burdened threshold; future hikes will face affordability resistance.
Forward outlook
- Local home prices are declining (-3.0%/yr); year-one equity from $932 of loan paydown is wiped out by about $4k of value loss. Plan a longer hold.
- Richland County population projected at +30% by 2050 — long-run rental-demand tailwind backs the buy-and-hold thesis.
- At projected returns (-3.0% appreciation + 2.8% rent growth), your $38k cash investment doubles in ~7 years — after that, you're playing with house money.
Negotiation context
- Only 13 days on market — expect competitive offers; lowballing is unlikely to land.
- Current owner paid $110k; 23% above their basis — modest negotiation headroom, anchor on the comps not their cost.
Risks & watch-outs
- Climate carrying-cost: major wind risk, 63% chance of damaging wind over 30y; extreme-heat days projected 7→16/yr by 2055 (HVAC capex compounding) — expect insurance premiums to compound above CPI over the hold.
Questions for the listing agent
- What does the HOA fee cover, when was the last increase, and are there any pending special assessments or reserve-fund shortfalls?
- Is there a deadline driving the sale (1031 exchange, divorce, estate, relocation)? That informs how much negotiation room exists.
- Schools are D-rated, which usually means shorter tenancies and higher turnover. Who's the typical renter profile here, and what's been the actual vacancy rate?
- Crime grade is F in this area — have there been break-ins, vandalism, or insurance claims at this property in the last 3 years? What carrier currently insures it and at what premium?
- What's the average days-on-market for RENTAL listings here right now (not sales)? A rising rental-DOM trend means longer vacancies and softer asking-rent achievability than the comps imply.
- What's the recent tenant-quality profile in this submarket — average credit score on applications, eviction rate, late-payment / NSF rate, and stable-employment percentage? A property-management company in the area should have these aggregated.
- How much new for-sale + rental construction is in the pipeline within 1–3 miles? Heavy new supply typically softens prices + rents 12–24 months out; constrained supply supports both.
Investment metrics
- 1% rule
- 1.40% ✓
- Cap rate
- 11.52%
- Cash-on-cash
- 18.68%
- DSCR
- 1.83
- GRM
- 5.9
CMA / ARV
- ARV (on-the-fly)
- $223,750
- Comps found
- 1
Show comp detail 1 sale within ~0.75 mi
| Address | Dist | Beds/Ba | Sqft | Sold | Price | $/sf | Match |
|---|---|---|---|---|---|---|---|
| 1007 May Oak Cir | 0.56mi | 3/2.0 | 1,342 (+7%) | 24mo | $240,000 | $179 | 42 |
Match score weights: distance 35% · size 25% · config 20% · recency 20%. Top-matched comps best support the ARV.
Projected returns pro-forma
-3.0% appreciation · 2.81% rent growth · sell at horizon
- IRR
- 10.2%
- Equity multiple
- 1.40×
- Total profit
- $15,229
- Equity at exit
- $20,092
- IRR
- 19.2%
- Equity multiple
- 2.59×
- Total profit
- $60,016
- Equity at exit
- $11,651
Cash invested: $37,730 (down + closing). Projections, not guarantees.
Landlord ↔ Tenant lean methodology
- Overall (STATE)
- 90 Strongly Landlord-Friendly
- State South Carolina
- 90 Strongly Landlord-Friendly · R+6
- County
- — inherits STATE
- City
- — inherits STATE
ZIP-level market 29229
- Home prices YoY
- -21.5%
- Rents YoY
- 2.8%
- Active inventory
- 406
- Price-to-rent
- 5.9×
Monthly cashflow live
- Estimated rent
- $1,892 high interval (Pro) →
- Mortgage (P&I)
- −$707
- Tax from tax record
- −$119 /mo · $1,426/yr
- Insurance
- −$56
- HOA
- −$26
- Vacancy / Maint / Mgmt
- −$397
- Net cashflow
- $587
Break-even live
UW: 25.0% down · 7.5% · 30yr · 1.5% tax · 5.0% vac · 8.0% maint · 8.0% mgmt
Financing live
Cash to close
- Down payment
- $33,688
- Closing costs
- $4,042
- Reserves months
- —
- Total cash needed
- —
Loan-product check · same deal, 3 products live
Conventional
25% down · 7.5% · 30yr
- Down + closing
- —
- Monthly P&I
- —
- Monthly cashflow
- —
- DSCR
- —
- Eligible?
- —
Personal DTI + credit; lowest rate.
DSCR
20% down · 8.5% · 30yr
- Down + closing
- —
- Monthly P&I
- —
- Monthly cashflow
- —
- DSCR
- —
- Eligible?
- —
No personal income docs; deal must DSCR.
Hard money
10% down · 12.0% · 12mo
- Down + closing
- —
- Monthly P&I
- —
- Monthly cashflow
- —
- DSCR
- —
- Eligible?
- —
Short-term bridge; refi at stabilization.
Rent comps 17 comps
| Address | Beds | Baths | Sqft | Rent | $/sqft | DOM | Units | Dist |
|---|---|---|---|---|---|---|---|---|
| 500 Castle Ridge Dr Columbia, SC | 3.0 | 2.0 | 1753 | $2,150 | $1.23 | 3d | 1 | 0.35mi |
| 3 Long Glen Ct Columbia, SC | 3.0 | 2.0 | 1314 | $1,849 | $1.41 | 2d | 1 | 0.67mi |
| 1214 Waverly Place Ln Columbia, SC | 3.0 | 2.0 | 1152 | $1,800 | $1.56 | 11d | 1 | 0.69mi |
| 1116 Waverly Place Ln Columbia, SC | 3.0 | 2.0 | 1428 | $1,875 | $1.31 | 14d | 1 | 0.81mi |
| 3 Glen Knoll Ct Columbia, SC | 3.0 | 2.0 | 1320 | $1,699 | $1.29 | 11d | 1 | 0.87mi |
| 214 Elders Pond Dr Columbia, SC | 3.0 | 2.5 | 1400 | $1,350 | $0.96 | 11d | 1 | 1.00mi |
| 5 Elders Pond Ct Columbia, SC | 3.0 | 2.5 | 1640 | $1,795 | $1.09 | 14d | 1 | 1.03mi |
| 423 Elders Pond Cir Columbia, SC | 2.0 | 2.0 | 1125 | $1,475 | $1.31 | 19d | 1 | 1.03mi |
| 225 Lawson Dr Columbia, SC | 2.0 | 2.0 | 1288 | $1,580 | $1.23 | 23d | 1 | 1.24mi |
| 512 N Crossing Dr Columbia, SC | 3.0 | 2.0 | 1302 | $1,799 | $1.38 | 23d | 1 | 1.27mi |
| 352 White Gables Dr Columbia, SC | 3.0 | 2.0 | 1165 | $1,605 | $1.38 | 3d | 1 | 1.29mi |
| 4500 Hard Scrabble Rd Columbia, SC | 1.0–3.0 | 1.0–2.0 | 1031 | $1,455 | $1.41 | 2d | 4 | 1.29mi |
| 1964 Lake Carolina Dr Columbia, SC | 4.0 | 2.5 | 1841 | $1,939 | $1.05 | 21d | 1 | 1.35mi |
| 112 Turnstone Way Columbia, SC | 3.0 | 2.0 | 1145 | $1,779 | $1.55 | 2d | 1 | 1.37mi |
| 2000 Lake Carolina Dr Columbia, SC | 4.0 | 2.5 | 1841 | $2,089 | $1.13 | 14d | 1 | 1.44mi |
| 416 Sandfarm Trl Blythewood, SC | 3.0 | 2.5 | 1664 | $2,025 | $1.22 | 23d | 1 | 1.47mi |
| 416 Sandfarm Trl Blythewood, SC | 3.0 | 2.5 | 1664 | $2,025 | $1.22 | 14d | 1 | 1.47mi |
HOA detail
- Monthly dues
- $26 · $312/yr
Listing history 17 events
-
2026-05-21status Pending
-
2026-05-08$134,750 Active
-
2016-12-30soldstatus $109,900
-
2016-12-02price $109,900
-
2016-11-20price $109,900
-
2016-10-29price $112,900
-
2016-10-26price $109,900
-
2016-10-03price $112,900
-
2016-09-29price $114,900
-
2016-09-27price $116,900
-
2016-09-11price $114,900
-
2016-09-08price $116,800
-
2016-09-04price $116,900
-
2016-08-31price $118,900
-
2016-08-16price $119,900
-
1994-09-01soldstatus $93,200
-
1993-10-15soldstatus $75,000
ⓘ Source: listings_history table (triggers on properties + properties_extension) + one-shot
backfill from property_details.listing_events for pre-trigger history.
Tax reassessment forecast SC · Resets to sale price
- Current annual tax
- $1,426 · $119/mo
- Projected year-2 tax
- $1,426 · $119/mo
- Expected delta
- $0/yr ($0/mo · 0.0%)
ⓘ Screening estimate from a state-policy table — verify with the county assessor before closing.
Climate risk First Street
- Flood 1/10 Low FEMA zone X (unshaded) · 0% chance over 30 yrs
- Wildfire 1/10 Low
- Heat 7/10 Severe 7 d/yr ≥107°F today · 16 d/yr by 30 yrs out
- Wind 6/10 Major 63% chance of damaging wind over 30 yrs
- Air quality 3/10 Moderate 2 unhealthy d/yr today · 3 by 30 yrs out
Nearby sold comps map
Loading sold comps map…
Walkable amenities ~0.75 mi
Loading nearby amenities…
Taxation est. · year 1
- Rental income
- $22,709
- − Mortgage interest
- −$7,548
- − Property taxes
- −$1,426
- − Insurance
- −$674
- − Repairs & maintenance
- −$1,817
- − Management
- −$1,817
- − HOA
- −$312
- − Depreciation
- −$3,920
- Taxable income
- $5,196
- Est. tax owed @ 24.0%
- −$1,247
- After-tax cash flow
- $5,802/yr
For passive investors: Depreciation is non-cash, so a rental often shows a tax loss while cash-flowing — sheltering income. Rental losses are passive: they offset passive income freely, and up to $25,000/yr can offset ordinary (W-2) income if you actively participate and your MAGI is under $100k (phasing out to $0 by $150k); unused losses carry forward. On sale, claimed depreciation is recaptured at up to 25%, and gains may owe capital-gains tax (a 1031 exchange can defer both). Figures are a year-1 estimate at your 24.0% rate — not tax advice; consult a CPA.
Schools (NCES district)
- District
- Richland 02
- NCES district ID
- 4503390
- Math proficiency
- 35% ▼ -15.00%
- Reading proficiency
- 47% ▼ -5.00%
- Median HH income
- $59,684
- Composite
- 36.2/100
- National rank
- #4730
- State rank
- #29 of 80 in SC
Livability — Columbia
- Score
- 78/100
- State rank
- #18
- US rank
- #2436
Category grades
Schools grade is shown separately in the Schools card above.
Census & demographics
- County
- Richland County · 389,530 people
- City population
- 335,994
- Metro
- Columbia, SC
- Population (ZIP)
- 51,861
- Household income
- $74,043
- Rent vs Own
- Severe rent burden
- 1939.0
Population outlook (Richland County) Hauer SSP2
- Today (2025)
- 459,667 people
- By 2030
- 487,524 · +6.1%
- By 2040
- 542,035 · +17.9%
- By 2050
- 595,371 · +29.5%
- By 2075
- 732,998 · +59.5%
- By 2100
- 820,415 · +78.5%
Race, ethnicity, and origin ACS 2023
- Neighborhood character
- Diverse neighborhood (Simpson 0.56)
- Race & ethnicity
- Black 62% White 24% Hispanic / Latino 8% Two or more races 6% Asian 3%
- Hispanic origin (detail)
- Mexican 2% Puerto Rican 2%
- Common ancestry
- Slovak 1% Lithuanian 1% Romanian 1%
- Foreign-born
- 7% · Canada, South Korea, Jamaica
- Languages at home
- 89% English-only · Spanish 6% Other Indo-European 1% Korean 1%
Political lean MEDSL · Richland
- 2024 margin
- Solid D (+34.6) · D 66.4% · R 31.8% · Other 1.8%
- 2008→2024 swing
- +5.7pp toward D · 2008: 28.9pp · 2024: 34.6pp
- All cycles
- 2024: D+34.6 2020: D+38.3 2016: D+32.9 2012: D+33.3 2008: D+28.9
Not yet ingested
- Civics
- —
Market trends
- HPI YoY
- ▼ -51.11%
- Current HPI
- 186.782
- Rent YoY
- ▲ 2.81%
- Metro
- Columbia, SC
- State GDP YoY
- ▲ 4.51%
- F500 in state
- 2
Industry mix (Fortune 500 HQ in SC)
| Industry | F500 HQs | Revenue |
|---|---|---|
| Packaging | 1 | $7B |
|
||
Price history
+79.7% since first listed17 events — show timeline
- 2026-05-21 Pending — Consolidated MLS
- 2026-05-08 Listed $134,750 Consolidated MLS
- 2016-12-30 Sold (Public Records) $109,900 Public Records
- 2016-12-02 Price Changed $109,900 Consolidated MLS
- 2016-11-20 Price Changed $109,900 Consolidated MLS
- 2016-10-29 Price Changed $112,900 Consolidated MLS
- 2016-10-26 Price Changed $109,900 Consolidated MLS
- 2016-10-03 Price Changed $112,900 Consolidated MLS
- 2016-09-29 Price Changed $114,900 Consolidated MLS
- 2016-09-27 Price Changed $116,900 Consolidated MLS
- 2016-09-11 Price Changed $114,900 Consolidated MLS
- 2016-09-08 Price Changed $116,800 Consolidated MLS
- 2016-09-04 Price Changed $116,900 Consolidated MLS
- 2016-08-31 Price Changed $118,900 Consolidated MLS
- 2016-08-16 Price Changed $119,900 Consolidated MLS
- 1994-09-01 Sold (Public Records) $93,200 Public Records
- 1993-10-15 Sold (Public Records) $75,000 Public Records
Property tax history
-7.0%/yrLatest (2025): $1,426 · +3.6% YoY. Source: county tax records.
Cash-flow waterfall
monthlySold comps — $/sqft
last 12 mo · ≤1 miLoading sold comps…