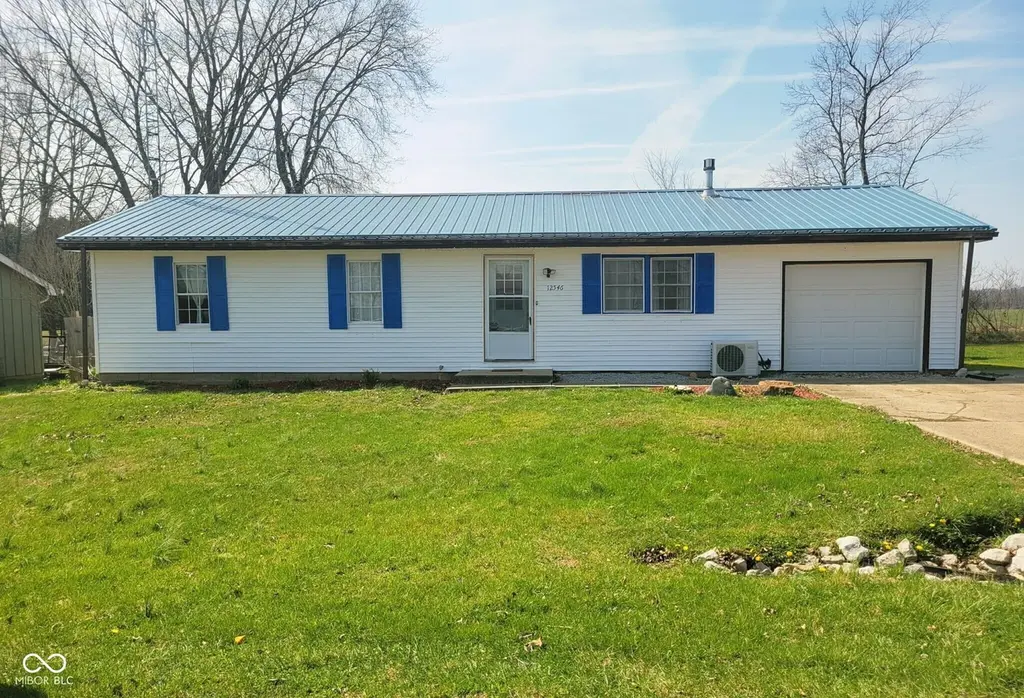
12546 S Hillview Dr · Grandview Lake, IN
Flood risk 1/10 · Minimal
- FEMA flood zone
- X (unshaded)
- Chance of flooding over 30 yrs
- 0.0%
- Est. flood insurance / yr
- $507 – $1,088
Fire risk 1/10 · Minimal
- Est. fire insurance / yr
- $717 – $1,331
Heat risk 4/10 · Minor
- Hot days now (above 103°F)
- 7 days/yr
- Hot days in 30 yrs
- 19 days/yr
Wind risk 2/10 · Minimal
- Chance of severe wind over 30 yrs
- 1.0%
Air-quality risk 2/10 · Minimal
- Unhealthy air days now
- 0 days/yr
- Unhealthy air days in 30 yrs
- 1 days/yr
Risk factors via First Street. Map © Google.
Why this score? — see what drove the D+ grade
The composite is a weighted blend of 9 inputs, each scored 0–100. Each bar is that input's sub-score; the figure is the points it added to the 100-point composite (weight × sub-score).
- Cash flow +14.7/30.0
- ARV discount +11.8/15.0
- DSCR +4.5/10.0
- Schools +3.6/10.0
- Rent growth +3.3/5.0
- 1% rule +3.0/10.0
- Livability +2.5/5.0
- Condition / age +2.5/5.0
- Appreciation +0.0/10.0
$194,900
🖨 Deal sheet 📄 Offer letter ✓ Due diligence
Listing remarks
Updated 3-bedroom, 1-bath ADA accessible home in an established neighborhood near Mt. Healthy schools. Features include hardwood floors throughout most of the home, an attached garage, and a newer hot tub in excellent condition. The property also offers exceptional exterior amenities with a two story detached garage/workshop and an additional backyard carport-ideal for storage, hobbies, or extra parking. A well maintained, move in ready home with rare exterior space.
Key facts
- Rare exterior space
- Backyard carport
- Newer hot tub
Tags
Property features AI
Exterior
- Parking: 4-car garage (576 sq ft indicated); Attached and detached parking options; Converted garage; Carport; Concrete and aggregate surfaces
- Utilities: Public water; Community sewer; No solid waste service indicated
- Home design: Single-family residence; Attached property; One story; Accessible doors and an accessible full bathroom
- Construction: Vinyl siding; Block foundation
- Exterior features: Screened porch; Fenced yard; Above-ground spa
Interior
- Kitchen: Dishwasher; Electric oven; Refrigerator; Tankless water heater
- Bedrooms: Three bedrooms on the main level
- Flooring: Hardwood floors
- Bathrooms: One full bathroom on the main level
- Heating & cooling: Natural gas heating; Ductless cooling
- Interior features: Attic access; Hardwood floors; Gas log fireplace
- Laundry & utility: Tankless water heater (listed with kitchen appliances)
Neighborhood map
What this means for you Summary
Snapshot
- This is a 3-bed/1.0-bath single-family listed at $195k.
Deal economics
- At list price, monthly cash flow is $48 ($580/yr) — positive.
- The deal already cash-flows at list — no discount required.
- To meet the 1% rule (rent ≥ 1% of price), the offer needs to be $156k (19.8% below list).
- Recommended offer: $156k (19.8% below list) — sets the bar for 1% rule.
Location & tenants
- Location reads: area grade D — affects rentability + tenant quality, not the cash-flow math above.
- Bartholomew Consolidated School Corporation (urban): math 38% / reading 45% proficiency, ranked #119 of 301 in IN (top 40%) — families likely to look elsewhere, expect single-tenant / working-renter base with shorter leases.
- Market conditions: Rents rising (+3.1%/yr); 340 active listings in the ZIP; solid renter incomes; 195 units permitted in Bartholomew County in 2024 (0 in 5+ unit buildings).
Forward outlook
- Local home prices are declining (-3.0%/yr); year-one equity from $1k of loan paydown is wiped out by about $6k of value loss. Plan a longer hold.
- Bartholomew County population projected at +22% by 2050 — long-run rental-demand tailwind backs the buy-and-hold thesis.
Negotiation context
- It's been on market 84 days — a 6% lower offer ($183k) is reasonable based on typical stale-listing flexibility.
- Current owner paid $53k; list at $195k implies a 267% gain — meaningful room to come down on a strong offer.
Questions for the listing agent
- It's been on market 84 days. Have you received any prior offers? Is the seller open to a 20% concession, seller financing, or rate buy-down credit?
- Built in 1970 — when were the roof, HVAC, electrical panel, plumbing, and water heater last replaced?
- Why hasn't it sold? Are there any deal-killer items the seller is aware of (foundation, flood, title, zoning, code violations)?
- Is there a deadline driving the sale (1031 exchange, divorce, estate, relocation)? That informs how much negotiation room exists.
- The area grade is low — what's the realistic commute time and amenity access for the typical tenant pool here? Any planned neighborhood developments (good or bad) we should know about?
- What's the average days-on-market for RENTAL listings here right now (not sales)? A rising rental-DOM trend means longer vacancies and softer asking-rent achievability than the comps imply.
- What's the recent tenant-quality profile in this submarket — average credit score on applications, eviction rate, late-payment / NSF rate, and stable-employment percentage? A property-management company in the area should have these aggregated.
- How much new for-sale + rental construction is in the pipeline within 1–3 miles? Heavy new supply typically softens prices + rents 12–24 months out; constrained supply supports both.
Investment metrics
- 1% rule
- 0.80% ✗
- Cap rate
- 6.59%
- Cash-on-cash
- 1.06%
- DSCR
- 1.05
- GRM
- 10.4
CMA / ARV
- ARV (on-the-fly)
- $215,424
- Comps found
- 3
Show comp detail 3 sales within ~0.75 mi
| Address | Dist | Beds/Ba | Sqft | Sold | Price | $/sf | Match |
|---|---|---|---|---|---|---|---|
| 12566 S Hillview Dr | 0.01mi | 3/1.0 | 1,056 (0%) | 12mo | $195,000 | $185 | 89 |
| 12504 S Hillview Rd | 0.06mi | 3/1.0 | 912 (-14%) | 15mo | $185,900 | $204 | 62 |
| 12441 S Hillview Way | 0.21mi | 3/2.0 | 1,141 (+8%) | 20mo | $238,000 | $209 | 56 |
Match score weights: distance 35% · size 25% · config 20% · recency 20%. Top-matched comps best support the ARV.
Projected returns pro-forma
-3.0% appreciation · 3.15% rent growth · sell at horizon
- IRR
- -14.5%
- Equity multiple
- 0.48×
- Total profit
- $-28,343
- Equity at exit
- $29,060
- IRR
- -5.6%
- Equity multiple
- 0.63×
- Total profit
- $-20,050
- Equity at exit
- $16,851
Cash invested: $54,572 (down + closing). Projections, not guarantees.
Landlord ↔ Tenant lean methodology
- Overall (STATE)
- 90 Strongly Landlord-Friendly
- State Indiana
- 90 Strongly Landlord-Friendly · R+11
- County
- — inherits STATE
- City
- — inherits STATE
ZIP-level market 47201
- Rents YoY
- 3.1%
- Active inventory
- 340
- Price-to-rent
- 10.4×
Monthly cashflow live
- Estimated rent
- $1,563 medium interval (Pro) →
- Mortgage (P&I)
- −$1,022
- Tax from tax record
- −$83 /mo · $1,000/yr
- Insurance
- −$81
- HOA
- −$0
- Vacancy / Maint / Mgmt
- −$328
- Net cashflow
- $48
Break-even live
UW: 25.0% down · 7.5% · 30yr · 1.5% tax · 5.0% vac · 8.0% maint · 8.0% mgmt
Financing live
Cash to close
- Down payment
- $48,725
- Closing costs
- $5,847
- Reserves months
- —
- Total cash needed
- —
Loan-product check · same deal, 3 products live
Conventional
25% down · 7.5% · 30yr
- Down + closing
- —
- Monthly P&I
- —
- Monthly cashflow
- —
- DSCR
- —
- Eligible?
- —
Personal DTI + credit; lowest rate.
DSCR
20% down · 8.5% · 30yr
- Down + closing
- —
- Monthly P&I
- —
- Monthly cashflow
- —
- DSCR
- —
- Eligible?
- —
No personal income docs; deal must DSCR.
Hard money
10% down · 12.0% · 12mo
- Down + closing
- —
- Monthly P&I
- —
- Monthly cashflow
- —
- DSCR
- —
- Eligible?
- —
Short-term bridge; refi at stabilization.
Listing history 19 events
-
2026-06-19days on market $194,900 Active 84 DOM
-
2026-06-18days on market $194,900 Active 83 DOM
-
2026-06-17days on market $194,900 Active 82 DOM
-
2026-06-16days on market $194,900 Active 81 DOM
-
2026-06-15days on market $194,900 Active 80 DOM
-
2026-06-14days on market $194,900 Active 78 DOM
-
2026-06-13days on market $194,900 Active 77 DOM
-
2026-06-10days on market $194,900 Active 75 DOM
-
2026-06-09days on market $194,900 Active 74 DOM
-
2026-06-08days on market $194,900 Active 73 DOM
-
2026-06-07days on market $194,900 Active 72 DOM
-
2026-06-05days on market $194,900 Active 69 DOM
-
2026-06-03pricedays on market $194,900 Active 68 DOM
-
2026-06-02days on market $199,990 Active 67 DOM
-
2026-06-01days on market $199,990 Active 66 DOM
-
2026-05-31days on market $199,990 Active 65 DOM
-
2026-05-30days on market $199,990 Active 64 DOM
-
2026-03-26$199,990 Active
-
2011-10-31soldstatus $53,140
ⓘ Source: listings_history table (triggers on properties + properties_extension) + one-shot
backfill from property_details.listing_events for pre-trigger history.
Tax reassessment forecast IN · Partial reset (capped growth)
- Current annual tax
- $1,000 · $83/mo
- Projected year-2 tax
- $1,328 · $111/mo
- Expected delta
- +$329/yr (+$27/mo · 32.9%)
ⓘ Screening estimate from a state-policy table — verify with the county assessor before closing.
Climate risk First Street
- Flood 1/10 Low FEMA zone X (unshaded) · 0% chance over 30 yrs
- Wildfire 1/10 Low
- Heat 4/10 Moderate 7 d/yr ≥103°F today · 19 d/yr by 30 yrs out
- Wind 2/10 Low 100% chance of damaging wind over 30 yrs
- Air quality 2/10 Low 0 unhealthy d/yr today · 1 by 30 yrs out
Nearby sold comps map
Loading sold comps map…
Walkable amenities ~0.75 mi
Loading nearby amenities…
Taxation est. · year 1
- Rental income
- $18,758
- − Mortgage interest
- −$10,917
- − Property taxes
- −$1,000
- − Insurance
- −$974
- − Repairs & maintenance
- −$1,501
- − Management
- −$1,501
- − Depreciation
- −$5,670
- Taxable loss
- −$2,805
- Est. tax savings @ 24.0%
- +$673
- After-tax cash flow
- $1,253/yr
For passive investors: Depreciation is non-cash, so a rental often shows a tax loss while cash-flowing — sheltering income. Rental losses are passive: they offset passive income freely, and up to $25,000/yr can offset ordinary (W-2) income if you actively participate and your MAGI is under $100k (phasing out to $0 by $150k); unused losses carry forward. On sale, claimed depreciation is recaptured at up to 25%, and gains may owe capital-gains tax (a 1031 exchange can defer both). Figures are a year-1 estimate at your 24.0% rate — not tax advice; consult a CPA.
Schools (NCES district)
- District
- Bartholomew Consolidated School Corporation
- NCES district ID
- 1800360
- Math proficiency
- 38% ▼ -11.00%
- Reading proficiency
- 45% ▼ -7.00%
- Median HH income
- $54,685
- Composite
- 36.16/100
- National rank
- #4736
- State rank
- #119 of 301 in IN
Livability — Grandview Lake
No livability data for this city. (Only ~50 U.S. cities are tracked.)
Census & demographics
- County
- Bartholomew County · 74,100 people
- Metro
- Columbus, IN
- Population (ZIP)
- 47,900
- Household income
- $83,958
- Rent vs Own
- Severe rent burden
- 1455.0
Population outlook (Bartholomew County) Hauer SSP2
- Today (2025)
- 90,162 people
- By 2030
- 94,432 · +4.7%
- By 2040
- 102,659 · +13.9%
- By 2050
- 109,794 · +21.8%
- By 2075
- 123,419 · +36.9%
- By 2100
- 121,047 · +34.3%
Race, ethnicity, and origin ACS 2023
- Neighborhood character
- Predominantly White (75%)
- Race & ethnicity
- White 75% Hispanic / Latino 10% Asian 9% Two or more races 6% Black 2%
- Hispanic origin (detail)
- Mexican 8% Puerto Rican 1%
- Common ancestry
- Italian 3% Slovak 2% Serbian 1%
- Foreign-born
- 14% · Canada, China
- Languages at home
- 83% English-only · Spanish 8% Other Indo-European 5% Other Asian/Pacific 2%
Political lean MEDSL · Bartholomew
- 2024 margin
- Strong R (+27.3) · D 35.3% · R 62.7% · Other 2.0%
- 2008→2024 swing
- -16.1pp toward R · 2008: -11.3pp · 2024: -27.3pp
- All cycles
- 2024: R+27.3 2020: R+26.2 2016: R+33.3 2012: R+25.4 2008: R+11.3
Not yet ingested
- Civics
- —
Market trends
- HPI YoY
- ▼ -204.94%
- Current HPI
- 150.2246
- Rent YoY
- ▲ 3.15%
- Metro
- Columbus, IN
- State GDP YoY
- ▲ 2.90%
- F500 in state
- 18
Industry mix (Fortune 500 HQ in IN)
| Industry | F500 HQs | Revenue |
|---|---|---|
| Industrial Machinery | 2 | $37B |
|
||
| Healthcare | 1 | $177B |
|
||
| Pharmaceuticals | 1 | $45B |
|
||
| Metals / Steel | 1 | $18B |
|
||
| Agriculture | 1 | $17B |
|
||
| Packaging | 1 | $12B |
|
||
Price history
+276.3% since first listed2 events — show timeline
- 2026-03-26 Listed $199,990 MIBOR as Distributed by MLS Grid
- 2011-10-31 Sold (Public Records) $53,140 Public Records
Property tax history
+10.2%/yrLatest (2024): $1,000 · +4.6% YoY. Source: county tax records.
Cash-flow waterfall
monthlySold comps — $/sqft
last 12 mo · ≤1 miLoading sold comps…