 Fourplex
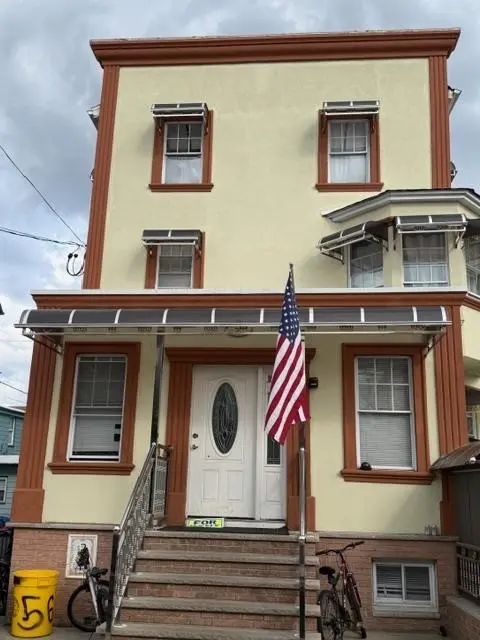
56 HAMILTON Ave #4 · Fairview, NJ
Flood risk 9/10 · Severe
- FEMA flood zone
- X (unshaded)
- Chance of flooding over 30 yrs
- 0.99%
- Est. flood insurance / yr
- $507 – $1,088
Fire risk 1/10 · Minimal
- Est. fire insurance / yr
- $526 – $976
Heat risk 7/10 · Major
- Hot days now (above 99°F)
- 7 days/yr
- Hot days in 30 yrs
- 15 days/yr
Wind risk 6/10 · Moderate
- Chance of severe wind over 30 yrs
- 27.0%
Air-quality risk 4/10 · Minor
- Unhealthy air days now
- 5 days/yr
- Unhealthy air days in 30 yrs
- 6 days/yr
Risk factors via First Street. Map © Google.
Why this score? — see what drove the B- grade
The composite is a weighted blend of 9 inputs, each scored 0–100. Each bar is that input's sub-score; the figure is the points it added to the 100-point composite (weight × sub-score).
- Cash flow +26.8/30.0
- DSCR +9.2/10.0
- ARV discount +7.5/15.0
- 1% rule +7.2/10.0
- Appreciation +4.0/10.0
- Condition / age +4.0/5.0
- Livability +3.7/5.0
- Rent growth +2.5/5.0
- Schools +1.6/10.0
$1,395,000
🖨 Deal sheet 📄 Offer letter ✓ Due diligence
Multi-family units
County records classify this as Multi-Family (2-4 Unit). Listing-text estimate: 4 units. confirmed
Listing remarks
4 FAMILY WITH A 7.6% CAP RATE, THIS PROPERTY WAS REMODELED FROM GUT TO STUD ABOUT 6 YEARS AGO, NEW ELECTRICITY, NEW PLUMBING, NEWER ROOF, NEW SHEETROCK, PROPERTY HAS SEPARATE UTILITIES, TENANTS PAY HEAT & HOT WATER, FIRST FLOOR FEATURES 2 APTS, ONE HAS A TWO BEDROOM UNIT AND THE OTHE APT HAS A 1 UNIT APT. SECOND FLOOR HAS 3 BEDROOMS. 1 FB. 3RD FLOOR HAS 2 BEDROOMS, FULL BATH, DECK WITH PARIAL NYC VIEW, NYC TRANSPORTATION 1 BLOCK AWAY. NEXT TO NORTH HUDSON PARK. EXPENSES= water & sewer $4,800, insurance $6,000. taxes $21,045, total expenses, $31,845. total income $11,500 x 12=$138,000 net income $106,155.00
Key facts
- Separate utilities
- New electricity
- New plumbing
Tags
Property features AI
Exterior
- Parking: No designated parking
- Home design: Multi-level building with at least three floors
- Construction: Lead paint form on file
- Exterior features: Stucco exterior
Interior
- Kitchen: 5 kitchens total (2 on level 1, 1 on level 2, 2 on level 3)
- Bedrooms: Floor 1: 2 bedrooms; Floor 2: 3 bedrooms; Floor 3: 2 bedrooms
- Bathrooms: 4 total bathrooms (all full); Floor 1: 2 full bathrooms; Floor 2: 1 full bathroom; Floor 3: 1 full bathroom
- Heating & cooling: Hot air heating; Window A/C units; Baseboard heating; Gas heating
- Interior features: Finished full basement
Neighborhood map
What this means for you Summary
Snapshot
- This is a 4 × 7-bed/4.0-bath units multifamily listed at $1.40M. Condition is rated good.
Deal economics
- At list price, monthly cash flow is $4k ($45k/yr) — positive. Per door: $937/mo.
- The deal already cash-flows at list — no discount required.
- Meets the 1% rule at list price ($17k rent vs $1.40M).
- Recommended offer: $1.37M (1.5% below list) — sets the bar for market timing.
- Cap rate 9.6% vs local median 2.5% in Fairview — top-decile yield for the area; either an underpriced asset or a hidden risk that comps aren't pricing in. Stress-test before assuming the spread holds.
Location & tenants
- Location reads 74/100 on livability (#174 in NJ, #4,548 nationally) — a middle-class / working-renter tenant base. Strengths: crime A+, employment A+, housing A+; Watch: commute C-, schools D-, cost of living F.
- Fairview Public School District (suburban): math 6% / reading 30% proficiency, ranked #440 of 472 in NJ (top 93%) — low school quality limits family demand, transient renter base, plan for 1-2y turnover; 65% free/reduced lunch — lower-income household profile, screen leases tightly.
- Market conditions: 25 active listings in the ZIP; 3,488 units permitted in Bergen County in 2024 (1,610 in 5+ unit buildings).
- At $17,032/mo this rent would consume 321% of the median local household income ($64k/yr) (locally 1247% of renters already pay >50% of income on rent) — very limited rent-growth headroom before tenants either downsize or default.
Forward outlook
- Local home prices are declining (-2.1%/yr); year-one equity from $10k of loan paydown is wiped out by about $29k of value loss. Plan a longer hold.
- Bergen County population projected at +20% by 2050 — long-run rental-demand tailwind backs the buy-and-hold thesis.
- At projected returns (-2.1% appreciation + 3.0% rent growth), your $391k cash investment doubles in ~9 years — after that, you're playing with house money.
Negotiation context
- It's been on market 20 days — a 2% lower offer ($1.37M) is reasonable based on typical stale-listing flexibility.
Risks & watch-outs
- Watch-outs: flood insurance adds $66/mo.
- Climate carrying-cost: severe flood risk; major wind risk, 27% chance of damaging wind over 30y; extreme-heat days projected 7→15/yr by 2055 (HVAC capex compounding) — expect insurance premiums to compound above CPI over the hold.
Questions for the listing agent
- Can we see the unit-by-unit rent roll, current vacancy, and any below-market leases? What's the average tenancy length?
- What capital expenditures (roof, boiler, parking lot, exteriors) have been made in the last 5 years, and what's planned in the next 2?
- What's the actual annual flood-insurance premium (NFIP or private), and is the property in a SFHA with mandatory coverage?
- Is there a deadline driving the sale (1031 exchange, divorce, estate, relocation)? That informs how much negotiation room exists.
- Schools are D-rated, which usually means shorter tenancies and higher turnover. Who's the typical renter profile here, and what's been the actual vacancy rate?
- What's the average days-on-market for RENTAL listings here right now (not sales)? A rising rental-DOM trend means longer vacancies and softer asking-rent achievability than the comps imply.
- What's the recent tenant-quality profile in this submarket — average credit score on applications, eviction rate, late-payment / NSF rate, and stable-employment percentage? A property-management company in the area should have these aggregated.
- How much new apartment / multifamily construction is in the pipeline within 1–3 miles? Heavy new supply (>2% of stock underway) typically softens rents 12–24 months out; light construction supports rent growth.
Investment metrics
- 1% rule
- 1.22% ✓
- Cap rate
- 9.57%
- Cash-on-cash
- 11.72%
- DSCR
- 1.52
- GRM
- 6.8
CMA / ARV
No comps found within radius.
Projected returns pro-forma
-2.09% appreciation · 3.0% rent growth · sell at horizon
- IRR
- 4.1%
- Equity multiple
- 1.17×
- Total profit
- $66,612
- Equity at exit
- $265,056
- IRR
- 12.1%
- Equity multiple
- 2.06×
- Total profit
- $414,223
- Equity at exit
- $220,942
Cash invested: $390,600 (down + closing). Projections, not guarantees.
Landlord ↔ Tenant lean methodology
- Overall (STATE)
- 21 Tenant-Leaning
- State New Jersey
- 21 Tenant-Leaning · D+6
- County
- — inherits STATE
- City
- — inherits STATE
ZIP-level market 07022
- Home prices YoY
- -0.6%
- Active inventory
- 25
- Price-to-rent
- 27.3×
Monthly cashflow live
- Estimated rent
- $17,032 medium interval (Pro) →
- Mortgage (P&I)
- −$7,316
- Tax est. 1.5%
- −$1,744 /mo · $20,925/yr
- Insurance
- −$581
- Flood insurance flood zone
- −$66 /mo · $798/yr
- HOA
- −$0
- Vacancy / Maint / Mgmt
- −$3,577
- Net cashflow
- $3,748
Break-even live
4-unit breakdown (identical units grouped — click to expand)
| Units | Beds | Baths | Est. rent |
|---|---|---|---|
| 4× units | 7 | 4 | $17,032 |
| #1 | 7 | 4 | $4,258 |
| #2 | 7 | 4 | $4,258 |
| #3 | 7 | 4 | $4,258 |
| #4 | 7 | 4 | $4,258 |
| Total (4 units) | $17,032 | ||
UW: 25.0% down · 7.5% · 30yr · 1.5% tax · 5.0% vac · 8.0% maint · 8.0% mgmt
Financing live
Cash to close
- Down payment
- $348,750
- Closing costs
- $41,850
- Reserves months
- —
- Total cash needed
- —
Loan-product check · same deal, 3 products live
Conventional
25% down · 7.5% · 30yr
- Down + closing
- —
- Monthly P&I
- —
- Monthly cashflow
- —
- DSCR
- —
- Eligible?
- —
Personal DTI + credit; lowest rate.
DSCR
20% down · 8.5% · 30yr
- Down + closing
- —
- Monthly P&I
- —
- Monthly cashflow
- —
- DSCR
- —
- Eligible?
- —
No personal income docs; deal must DSCR.
Hard money
10% down · 12.0% · 12mo
- Down + closing
- —
- Monthly P&I
- —
- Monthly cashflow
- —
- DSCR
- —
- Eligible?
- —
Short-term bridge; refi at stabilization.
Listing history 16 events
-
2026-06-18days on market $1,395,000 Active 20 DOM
-
2026-06-17days on market $1,395,000 Active 19 DOM
-
2026-06-16days on market $1,395,000 Active 18 DOM
-
2026-06-15days on market $1,395,000 Active 17 DOM
-
2026-06-13days on market $1,395,000 Active 15 DOM
-
2026-06-13days on market $1,395,000 Active 14 DOM
-
2026-06-09days on market $1,395,000 Active 11 DOM
-
2026-06-08days on market $1,395,000 Active 10 DOM
-
2026-06-07days on market $1,395,000 Active 9 DOM
-
2026-06-04days on market $1,395,000 Active 6 DOM
-
2026-06-03days on market $1,395,000 Active 5 DOM
-
2026-06-02days on market $1,395,000 Active 4 DOM
-
2026-06-02remarks 617-char remark
-
2026-06-02price $1,395,000 Active 3 DOM
-
2026-06-01days on market $1,475,000 Active 3 DOM
-
2026-05-31days on market $1,475,000 Active 2 DOM
ⓘ Source: listings_history table (triggers on properties + properties_extension) + one-shot
backfill from property_details.listing_events for pre-trigger history.
Climate risk First Street
- Flood 9/10 Extreme FEMA zone X (unshaded) · 99% chance over 30 yrs
- Wildfire 1/10 Low
- Heat 7/10 Severe 7 d/yr ≥99°F today · 15 d/yr by 30 yrs out
- Wind 6/10 Major 27% chance of damaging wind over 30 yrs
- Air quality 4/10 Moderate 5 unhealthy d/yr today · 6 by 30 yrs out
Nearby sold comps map
Loading sold comps map…
Walkable amenities ~0.75 mi
Loading nearby amenities…
Taxation est. · year 1
- Rental income
- $204,384
- − Mortgage interest
- −$78,142
- − Property taxes
- −$20,925
- − Insurance
- −$7,772
- − Repairs & maintenance
- −$16,351
- − Management
- −$16,351
- − Depreciation
- −$40,582
- Taxable income
- $24,262
- Est. tax owed @ 24.0%
- −$5,823
- After-tax cash flow
- $39,157/yr
For passive investors: Depreciation is non-cash, so a rental often shows a tax loss while cash-flowing — sheltering income. Rental losses are passive: they offset passive income freely, and up to $25,000/yr can offset ordinary (W-2) income if you actively participate and your MAGI is under $100k (phasing out to $0 by $150k); unused losses carry forward. On sale, claimed depreciation is recaptured at up to 25%, and gains may owe capital-gains tax (a 1031 exchange can defer both). Figures are a year-1 estimate at your 24.0% rate — not tax advice; consult a CPA.
Condition & rehab AI · 13 photos
This multi-family property is in good condition with recent renovations. It has a good roof, exterior, and interior, and is ready for a fresh coat of paint and some landscaping to further enhance its curb appeal and value.
Value-add opportunities
- Both Painting the exterior — Enhances curb appeal and property value
- Both Landscaping the front yard — Improves curb appeal and property value
- Both Updating the interior paint — Enhances the overall look and feel of the property
Renovation cost estimate screening
Value-add ROI direction
- Both Painting the exterior — Enhances curb appeal and property value ↑
- Both Landscaping the front yard — Improves curb appeal and property value ↑
- Both Updating the interior paint — Enhances the overall look and feel of the property ↑
ⓘ Cost ranges are severity-bucket heuristics (US national rule-of-thumb). Get contractor quotes + a written scope before underwriting a rehab budget.
Schools (NCES district)
- District
- Fairview Public School District
- NCES district ID
- 3405070
- Math proficiency
- 6% ▼ -20.00%
- Reading proficiency
- 30% ▼ -4.00%
- Median HH income
- $49,155
- Composite
- 16.08/100
- National rank
- #9236
- State rank
- #440 of 472 in NJ
Livability — Fairview
- Score
- 74/100
- State rank
- #174
- US rank
- #4548
Category grades
Schools grade is shown separately in the Schools card above.
Census & demographics
- Census place
- Fairview, NJ
- County
- Bergen County · 586,961 people
- City population
- 15,099
- Metro
- New York-Newark-Jersey City, NY-NJ-PA
- Population (ZIP)
- 15,099
- Household income
- $63,606
- Rent vs Own
- Severe rent burden
- 1247.0
Population outlook (Bergen County) Hauer SSP2
- Today (2025)
- 1,021,896 people
- By 2030
- 1,063,119 · +4.0%
- By 2040
- 1,146,566 · +12.2%
- By 2050
- 1,229,132 · +20.3%
- By 2075
- 1,429,694 · +39.9%
- By 2100
- 1,547,614 · +51.4%
Race, ethnicity, and origin ACS 2023
- Neighborhood character
- Majority Hispanic (63%)
- Race & ethnicity
- Hispanic / Latino 63% White 29% Two or more races 16% Asian 4% Native American 1% Black 1%
- Hispanic origin (detail)
- Puerto Rican 5% Cuban 4% Dominican 7%
- Common ancestry
- Lithuanian 2% Iranian 1% Italian 1%
- Foreign-born
- 48% · Canada, Jamaica, South Korea
- Languages at home
- 29% English-only · Spanish 56% Arabic 4% Other Indo-European 4%
Political lean MEDSL · Bergen
- 2024 margin
- Toss-up / Even · D 50.7% · R 47.3% · Other 2.0%
- 2008→2024 swing
- -6.1pp toward R · 2008: 9.5pp · 2024: 3.4pp
- All cycles
- 2024: D+3.4 2020: D+16.4 2016: D+12.0 2012: D+10.8 2008: D+9.5
Not yet ingested
- Civics
- —
Market trends
- HPI YoY
- ▼ -2.09%
- Current HPI
- 342.7225
- Rent YoY
- —
- Metro
- New York-Newark-Jersey City, NY-NJ-PA
- State GDP YoY
- ▲ 2.05%
- F500 in state
- 34
Industry mix (Fortune 500 HQ in NJ)
| Industry | F500 HQs | Revenue |
|---|---|---|
| Consumer Goods | 3 | $31B |
|
||
| Pharmaceuticals | 2 | $153B |
|
||
| Technology | 2 | $21B |
|
||
| Insurance | 2 | $20B |
|
||
| Healthcare | 2 | $19B |
|
||
| Financial Services | 1 | $70B |
|
||
Price history
+99900.0% since first listed2 events — show timeline
- 2026-05-30 Price Changed $1,475,000 HCMLS
- 2026-05-29 Listed $1,475 HCMLS
Cash-flow waterfall
monthlySold comps — $/sqft
last 12 mo · ≤1 miLoading sold comps…