 Multi-family
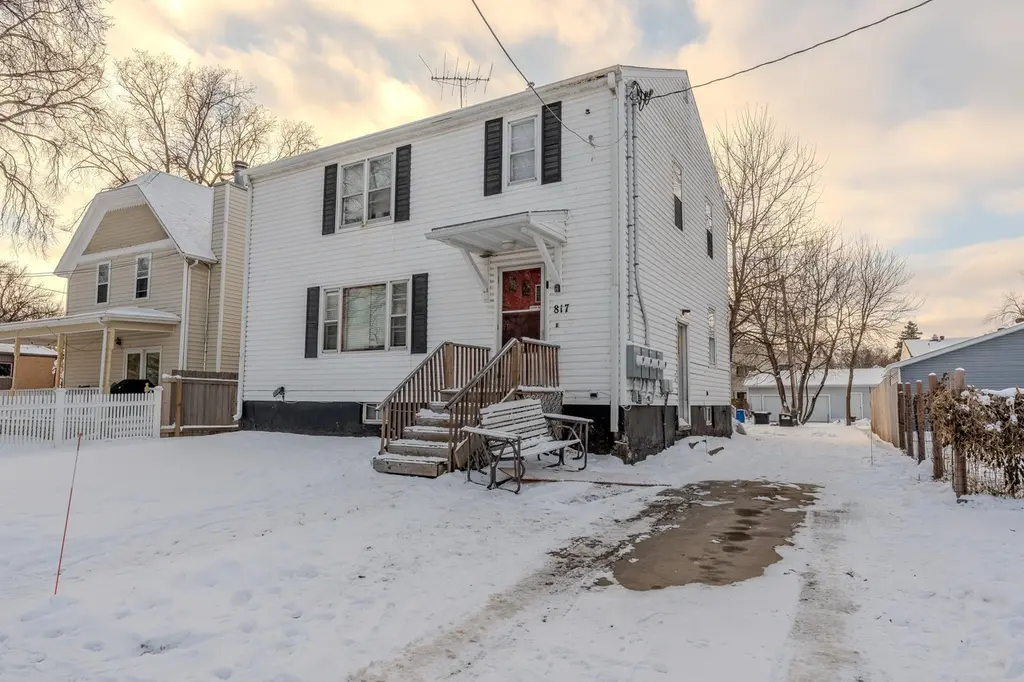
817 9th St S · Fargo, ND
Flood risk 1/10 · Minimal
- FEMA flood zone
- X (shaded)
- Chance of flooding over 30 yrs
- 0.0%
- Est. flood insurance / yr
- $473 – $860
Fire risk 1/10 · Minimal
- Est. fire insurance / yr
- $1,289 – $2,393
Heat risk 2/10 · Minimal
- Hot days now (above 98°F)
- 7 days/yr
- Hot days in 30 yrs
- 12 days/yr
Wind risk 2/10 · Minimal
- Chance of severe wind over 30 yrs
- —
Air-quality risk 3/10 · Minor
- Unhealthy air days now
- 3 days/yr
- Unhealthy air days in 30 yrs
- 3 days/yr
Risk factors via First Street. Map © Google.
Why this score? — see what drove the C grade
The composite is a weighted blend of 9 inputs, each scored 0–100. Each bar is that input's sub-score; the figure is the points it added to the 100-point composite (weight × sub-score).
- Cash flow +23.4/30.0
- DSCR +7.5/10.0
- ARV discount +7.5/15.0
- 1% rule +5.9/10.0
- Livability +4.2/5.0
- Rent growth +3.7/5.0
- Schools +3.6/10.0
- Condition / age +2.5/5.0
- Appreciation +0.0/10.0
$209,000
🖨 Deal sheet 📄 Offer letter ✓ Due diligence
Multi-family units
County records classify this as Multi-Family (2-4 Unit). Listing-text estimate: 1 unit. estimate disagrees with records
Key facts
- Private entrance
- Off-street parking
- 6,969 sq ft lot
Tags
Property features AI
Finance
- Other: Lot roughly 0.16 acres (approx. 103 x 140); Above-grade finished area reported; Foundation area and below-grade area reported
- Financial info: Triplex with three total units; Gross income reported: $24,575; Net operating income reported: $8,478; Owner pays gas, sewer, trash collection, and water; Reported annual expenses: fuel $4,335; insurance $2,750; maintenance $950; management $425
Exterior
- Parking: Detached or attached 1-car garage not specified; property includes 1 garage space
- Security: No security features provided
- Utilities: City water connected; City sewer connected; Natural gas service
- Home design: Residential income property (Triplex); Two-story building; Entry/floor area: main level finished area present
- Construction: Block foundation; Block foundation area below grade
- Exterior features: Vinyl exterior
Interior
- Kitchen: No appliance details provided
- Bedrooms: Six bedrooms total; Unit breakdown: one 1-bedroom unit, one 2-bedroom unit, one 3-bedroom unit
- Flooring: No flooring details provided
- Bathrooms: Each unit has one bathroom (includes a three-quarter bath in the 1-bedroom unit)
- Heating & cooling: Forced air heating; Wall-mounted cooling in each unit
- Interior features: Block basement; Two levels
- Laundry & utility: No laundry or utility appliance details provided
Neighborhood map
What this means for you Summary
Snapshot
- This is a 6-bed/3.0-bath multifamily listed at $209k.
Deal economics
- At list price, monthly cash flow is $384 ($5k/yr) — positive.
- The deal already cash-flows at list — no discount required.
- Meets the 1% rule at list price ($2k rent vs $209k).
- Cap rate 8.5% vs local median 2.5% in Fargo — top-decile yield for the area; either an underpriced asset or a hidden risk that comps aren't pricing in. Stress-test before assuming the spread holds.
Location & tenants
- Location reads 85/100 on livability (#1 in ND, #605 nationally) — a professional / high-income tenant draw. Strengths: amenities A+, commute A+, cost of living A+; Watch: crime F.
- Fargo 1 (urban): math 41% / reading 44% proficiency, ranked #28 of 53 in ND (top 53%) — families likely to look elsewhere, expect single-tenant / working-renter base with shorter leases.
- Market conditions: Rents rising fast (+5.0%/yr); 208 active listings in the ZIP; 1,218 units permitted in Cass County in 2024 (410 in 5+ unit buildings).
- At $2,284/mo this rent would consume 47% of the median local household income ($59k/yr) (locally 1782% of renters already pay >50% of income on rent) — very limited rent-growth headroom before tenants either downsize or default.
Forward outlook
- Local home prices are declining (-3.0%/yr); year-one equity from $1k of loan paydown is wiped out by about $6k of value loss. Plan a longer hold.
- Cass County population projected at +69% by 2050 — long-run rental-demand tailwind backs the buy-and-hold thesis.
- At projected returns (-3.0% appreciation + 5.0% rent growth), your $59k cash investment doubles in ~10 years — after that, you're playing with house money.
Negotiation context
- Only 13 days on market — expect competitive offers; lowballing is unlikely to land.
- 4 sale attempts since 10y ago; this cycle's ask has dropped $28k (12%) from the opening price — seller is motivated, your offer sets the floor, not the list.
- Current owner paid $140k; 49% above their basis — modest negotiation headroom, anchor on the comps not their cost.
Risks & watch-outs
- Watch-outs: built in 1898 — expect roof / HVAC / electrical / plumbing capex.
Questions for the listing agent
- Built in 1898 — when were the roof, HVAC, electrical panel, plumbing, and water heater last replaced?
- Is there a deadline driving the sale (1031 exchange, divorce, estate, relocation)? That informs how much negotiation room exists.
- Crime grade is F in this area — have there been break-ins, vandalism, or insurance claims at this property in the last 3 years? What carrier currently insures it and at what premium?
- What's the average days-on-market for RENTAL listings here right now (not sales)? A rising rental-DOM trend means longer vacancies and softer asking-rent achievability than the comps imply.
- What's the recent tenant-quality profile in this submarket — average credit score on applications, eviction rate, late-payment / NSF rate, and stable-employment percentage? A property-management company in the area should have these aggregated.
- How much new apartment / multifamily construction is in the pipeline within 1–3 miles? Heavy new supply (>2% of stock underway) typically softens rents 12–24 months out; light construction supports rent growth.
Investment metrics
- 1% rule
- 1.09% ✓
- Cap rate
- 8.50%
- Cash-on-cash
- 7.88%
- DSCR
- 1.35
- GRM
- 7.6
CMA / ARV
No comps found within radius.
Projected returns pro-forma
-3.0% appreciation · 4.95% rent growth · sell at horizon
- IRR
- -2.1%
- Equity multiple
- 0.92×
- Total profit
- $-4,793
- Equity at exit
- $31,163
- IRR
- 9.6%
- Equity multiple
- 1.80×
- Total profit
- $46,943
- Equity at exit
- $18,071
Cash invested: $58,520 (down + closing). Projections, not guarantees.
Landlord ↔ Tenant lean methodology
- Overall (STATE)
- 82 Strongly Landlord-Friendly
- State North Dakota
- 82 Strongly Landlord-Friendly · R+20
- County
- — inherits STATE
- City
- — inherits STATE
ZIP-level market 58103
- Rents YoY
- 5.0%
- Active inventory
- 208
- Price-to-rent
- 15.2×
Monthly cashflow live
- Estimated rent
- $2,284 high interval (Pro) →
- Mortgage (P&I)
- −$1,096
- Tax from tax record
- −$237 /mo · $2,842/yr
- Insurance
- −$87
- HOA
- −$0
- Vacancy / Maint / Mgmt
- −$480
- Net cashflow
- $384
Break-even live
2-unit breakdown (identical units grouped — click to expand)
| Units | Beds | Baths | Est. rent |
|---|---|---|---|
| 2× units | 2 | 1 | $2,284 |
| #1 | 2 | 1 | $1,142 |
| #2 | 2 | 1 | $1,142 |
| Total (2 units) | $2,284 | ||
UW: 25.0% down · 7.5% · 30yr · 1.5% tax · 5.0% vac · 8.0% maint · 8.0% mgmt
Financing live
Cash to close
- Down payment
- $52,250
- Closing costs
- $6,270
- Reserves months
- —
- Total cash needed
- —
Loan-product check · same deal, 3 products live
Conventional
25% down · 7.5% · 30yr
- Down + closing
- —
- Monthly P&I
- —
- Monthly cashflow
- —
- DSCR
- —
- Eligible?
- —
Personal DTI + credit; lowest rate.
DSCR
20% down · 8.5% · 30yr
- Down + closing
- —
- Monthly P&I
- —
- Monthly cashflow
- —
- DSCR
- —
- Eligible?
- —
No personal income docs; deal must DSCR.
Hard money
10% down · 12.0% · 12mo
- Down + closing
- —
- Monthly P&I
- —
- Monthly cashflow
- —
- DSCR
- —
- Eligible?
- —
Short-term bridge; refi at stabilization.
Listing history 25 events
-
2026-06-18days on market $209,000 Active 13 DOM
-
2026-06-17days on market $209,000 Active 12 DOM
-
2026-06-16days on market $209,000 Active 11 DOM
-
2026-06-15days on market $209,000 Active 10 DOM
-
2026-06-14days on market $209,000 Active 8 DOM
-
2026-06-13days on market $209,000 Active 7 DOM
-
2026-06-10days on market $209,000 Active 5 DOM
-
2026-06-09days on market $209,000 Active 4 DOM
-
2026-06-08days on market $209,000 Active 3 DOM
-
2026-06-07pricedays on market $209,000 Active 2 DOM
-
2026-06-02days on market $217,000 Active 171 DOM
-
2026-06-01days on market $217,000 Active 170 DOM
-
2026-05-31days on market $217,000 Active 169 DOM
-
2026-05-30days on market $217,000 Active 168 DOM
-
2026-05-27status Active
-
2026-05-21historical
-
2026-05-01status Active
-
2026-04-28historical
-
2026-04-16price $217,000
-
2026-02-17price $227,000
-
2025-12-04$237,000 Active
-
2016-10-05historical
-
2016-05-12$175,000
-
2006-03-14soldstatus $140,070
-
2006-03-03soldstatus $55,000
ⓘ Source: listings_history table (triggers on properties + properties_extension) + one-shot
backfill from property_details.listing_events for pre-trigger history.
Tax reassessment forecast ND · Resets to sale price
- Current annual tax
- $2,842 · $237/mo
- Projected year-2 tax
- $2,842 · $237/mo
- Expected delta
- $0/yr ($0/mo · 0.0%)
ⓘ Screening estimate from a state-policy table — verify with the county assessor before closing.
Climate risk First Street
- Flood 1/10 Low FEMA zone X (shaded) · 0% chance over 30 yrs
- Wildfire 1/10 Low
- Heat 2/10 Low 7 d/yr ≥98°F today · 12 d/yr by 30 yrs out
- Wind 2/10 Low
- Air quality 3/10 Moderate 3 unhealthy d/yr today · 3 by 30 yrs out
Nearby sold comps map
Loading sold comps map…
Walkable amenities ~0.75 mi
Loading nearby amenities…
Taxation est. · year 1
- Rental income
- $27,408
- − Mortgage interest
- −$11,707
- − Property taxes
- −$2,842
- − Insurance
- −$1,045
- − Repairs & maintenance
- −$2,193
- − Management
- −$2,193
- − Depreciation
- −$6,080
- Taxable income
- $1,349
- Est. tax owed @ 24.0%
- −$324
- After-tax cash flow
- $4,290/yr
For passive investors: Depreciation is non-cash, so a rental often shows a tax loss while cash-flowing — sheltering income. Rental losses are passive: they offset passive income freely, and up to $25,000/yr can offset ordinary (W-2) income if you actively participate and your MAGI is under $100k (phasing out to $0 by $150k); unused losses carry forward. On sale, claimed depreciation is recaptured at up to 25%, and gains may owe capital-gains tax (a 1031 exchange can defer both). Figures are a year-1 estimate at your 24.0% rate — not tax advice; consult a CPA.
Schools (NCES district)
- District
- Fargo 1
- NCES district ID
- 3806780
- Math proficiency
- 41% ▼ -7.00%
- Reading proficiency
- 44% ▼ -7.00%
- Median HH income
- $46,524
- Composite
- 36.23/100
- National rank
- #4721
- State rank
- #28 of 53 in ND
Livability — Fargo
- Score
- 85/100
- State rank
- #1
- US rank
- #605
Category grades
Schools grade is shown separately in the Schools card above.
Census & demographics
- Census place
- Fargo, ND
- County
- Cass County · 177,143 people
- City population
- 130,876
- Metro
- Fargo, ND-MN
- Population (ZIP)
- 48,796
- Household income
- $58,801
- Rent vs Own
- Severe rent burden
- 1782.0
Population outlook (Cass County) Hauer SSP2
- Today (2025)
- 223,771 people
- By 2030
- 251,835 · +12.5%
- By 2040
- 311,816 · +39.3%
- By 2050
- 378,694 · +69.2%
- By 2075
- 571,386 · +155.3%
- By 2100
- 769,727 · +244.0%
Race, ethnicity, and origin ACS 2023
- Neighborhood character
- Predominantly White (74%)
- Race & ethnicity
- White 74% Black 12% Two or more races 5% Asian 4% Hispanic / Latino 4% Native American 2%
- Common ancestry
- Portuguese 23% Swiss 4% Lithuanian 3%
- Foreign-born
- 15% · Canada, India, South Korea
- Languages at home
- 86% English-only · Other Indo-European 4% Arabic 1% Spanish 1%
Political lean MEDSL · Cass
- 2024 margin
- Lean R (+8.4) · D 44.9% · R 53.3% · Other 1.9%
- 2008→2024 swing
- -15.5pp toward R · 2008: 7.1pp · 2024: -8.4pp
- All cycles
- 2024: R+8.4 2020: R+2.7 2016: R+10.7 2012: R+3.0 2008: D+7.1
Not yet ingested
- Civics
- —
Market trends
- HPI YoY
- ▼ -143.86%
- Current HPI
- 163.2804
- Rent YoY
- ▲ 4.95%
- Metro
- Fargo, ND-MN
- State GDP YoY
- ▲ 2.09%
- F500 in state
- 2
Industry mix (Fortune 500 HQ in ND)
| Industry | F500 HQs | Revenue |
|---|---|---|
| Utilities / Construction | 1 | $6B |
|
||
Price history
+294.5% since first listed11 events — show timeline
- 2026-05-27 Relisted — NORTHSTARMLS as Distributed by MLS Grid
- 2026-05-21 Listing Removed — NORTHSTARMLS as Distributed by MLS Grid
- 2026-05-01 Relisted — NORTHSTARMLS as Distributed by MLS Grid
- 2026-04-28 Listing Removed — NORTHSTARMLS as Distributed by MLS Grid
- 2026-04-16 Price Changed $217,000 NORTHSTARMLS as Distributed by MLS Grid
- 2026-02-17 Price Changed $227,000 NORTHSTARMLS as Distributed by MLS Grid
- 2025-12-04 Listed $237,000 NORTHSTARMLS as Distributed by MLS Grid
- 2016-10-05 Listing Removed — NORTHSTARMLS as Distributed by MLS Grid
- 2016-05-12 Listed $175,000 NORTHSTARMLS as Distributed by MLS Grid
- 2006-03-14 Sold (Public Records) $140,070 Public Records
- 2006-03-03 Sold (Public Records) $55,000 Public Records
Property tax history
+4.9%/yrLatest (2025): $2,842 · +12.1% YoY. Source: county tax records.
Cash-flow waterfall
monthlySold comps — $/sqft
last 12 mo · ≤1 miLoading sold comps…