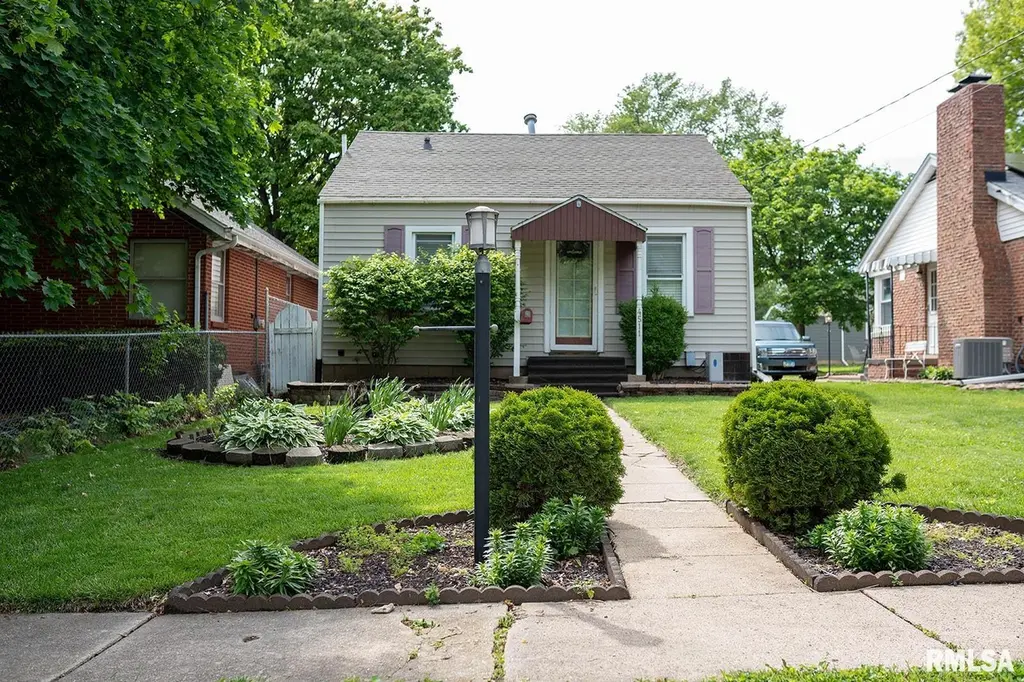
4511 N Constantine Ave · Peoria Heights, IL
Flood risk 1/10 · Minimal
- FEMA flood zone
- X
- Chance of flooding over 30 yrs
- 0.0%
- Est. flood insurance / yr
- $473 – $860
Fire risk 1/10 · Minimal
- Est. fire insurance / yr
- $804 – $1,492
Heat risk 3/10 · Minor
- Hot days now (above 104°F)
- 7 days/yr
- Hot days in 30 yrs
- 17 days/yr
Wind risk 2/10 · Minimal
- Chance of severe wind over 30 yrs
- 1.0%
Air-quality risk 3/10 · Minor
- Unhealthy air days now
- 1 days/yr
- Unhealthy air days in 30 yrs
- 3 days/yr
Risk factors via First Street. Map © Google.
Why this score? — see what drove the C- grade
The composite is a weighted blend of 9 inputs, each scored 0–100. Each bar is that input's sub-score; the figure is the points it added to the 100-point composite (weight × sub-score).
- Cash flow +19.1/30.0
- ARV discount +15.0/15.0
- DSCR +6.0/10.0
- 1% rule +5.6/10.0
- Livability +3.1/5.0
- Rent growth +2.5/5.0
- Condition / age +2.5/5.0
- Schools +1.0/10.0
- Appreciation +0.0/10.0
$125,000
🖨 Deal sheet (PDF) 📄 Offer letter ✓ Due diligence
Listing remarks
Searching for an affordable home in Peoria Heights? Welcome to 4511 N. Constantine, a move-in-ready ranch, offering updated finishes, a finished basement, fenced yard, and a prime location. This charming ranch-style home features 2 bedrooms, 1 full bath, and 672 square feet on the main level, plus an additional 672 finished square feet in the basement, providing flexible space for a family room, home office, workout area, or extra storage. Built in 1940, the home blends character with valuable modern updates. The kitchen has been refreshed with new countertops, new backsplash, new flooring, new sink, and new appliances, creating a clean and functional space for everyday living. Outside, enj
Key facts
- 4,080 sq ft lot
- 2 garage spots
- Built 1940
Property features AI
Exterior
- Parking: Detached 2-car garage; On-street parking; Alley access; Paved parking areas
- Utilities: Public water; Public sewer
- Home design: Single-family residence; Built in 1940
- Construction: Shingle roof
- Exterior features: Fenced yard; Level lot; Paved road access
Interior
- Kitchen: Dishwasher; Disposal; Microwave; Refrigerator
- Bedrooms: 2 bedrooms (one main-level bedroom ~12 x 9, one main-level bedroom ~11 x 8)
- Flooring: Laminate flooring in some rooms; Carpet in some rooms; Tile in basement areas
- Bathrooms: 1 full bathroom
- Heating & cooling: Central air conditioning; Forced air heating; Gas water heater
- Interior features: Cable available; Ceiling fan(s); Radon mitigation system; Finished full basement
- Laundry & utility: Washer; Dryer; Basement laundry room (tile floor, approx. 6 x 10)
Neighborhood map
What this means for you Summary
Snapshot
- This is a 2-bed/1.0-bath single-family listed at $125k.
Deal economics
- At list price, monthly cash flow is $134 ($2k/yr) — positive.
- The deal already cash-flows at list — no discount required.
- Meets the 1% rule at list price ($1k rent vs $125k).
Location & tenants
- Location reads 62/100 on livability (#886 in IL) — a middle-class / working-renter tenant base. Strengths: cost of living A+, housing A-, health & safety B+; Watch: crime F, amenities F, commute F.
- Peoria Heights CUSD 325 (suburban): math 8% / reading 15% proficiency, ranked #560 of 620 in IL (top 90%) — low school quality limits family demand, transient renter base, plan for 1-2y turnover.
- Zoned schools: Peoria Heights Grade School (math 7% / reading 14%, grade F, #1,473 of 2,056 statewide, top 72%, 546 students, 0% FRL); Peoria Heights High School (math 15% / reading 24%, grade F, #379 of 693 statewide, top 57%, 208 students, 0% FRL) — zoned schools average 0% FRL vs 50% district-wide (50 pts lower); this property's tenant base skews higher-income than the district average.
- Market conditions: 32 active listings in the ZIP; 5 comparable units currently listed for rent nearby; rentals at typical pace (median 16d on market — plan ~3-4 weeks tenant-placement turnaround); 73 units permitted in Peoria County in 2024 (0 in 5+ unit buildings).
Forward outlook
- Local home prices are declining (-3.0%/yr); year-one equity from $864 of loan paydown is wiped out by about $4k of value loss. Plan a longer hold.
- Peoria County population projected at -11% by 2050 — secular population decline; favor cash flow + early exit over multi-decade hold.
Negotiation context
- Only 2 days on market — expect competitive offers; lowballing is unlikely to land.
- 6 sale attempts since 22y ago with the ask held roughly flat each time — persistent listings suggest the price (not the market) is what's stuck; bring a comps-based counter.
- Current owner paid $88k; 41% above their basis — modest negotiation headroom, anchor on the comps not their cost.
Risks & watch-outs
- Watch-outs: built in 1940 — expect roof / HVAC / electrical / plumbing capex.
Questions for the listing agent
- Built in 1940 — when were the roof, HVAC, electrical panel, plumbing, and water heater last replaced?
- Is there a deadline driving the sale (1031 exchange, divorce, estate, relocation)? That informs how much negotiation room exists.
- Schools are F-rated, which usually means shorter tenancies and higher turnover. Who's the typical renter profile here, and what's been the actual vacancy rate?
- Crime grade is F in this area — have there been break-ins, vandalism, or insurance claims at this property in the last 3 years? What carrier currently insures it and at what premium?
- What's the average days-on-market for RENTAL listings here right now (not sales)? A rising rental-DOM trend means longer vacancies and softer asking-rent achievability than the comps imply.
- What's the recent tenant-quality profile in this submarket — average credit score on applications, eviction rate, late-payment / NSF rate, and stable-employment percentage? A property-management company in the area should have these aggregated.
- How much new for-sale + rental construction is in the pipeline within 1–3 miles? Heavy new supply typically softens prices + rents 12–24 months out; constrained supply supports both.
Investment metrics
- 1% rule
- 1.06% ✓
- Cap rate
- 7.58%
- Cash-on-cash
- 4.58%
- DSCR
- 1.20
- GRM
- 7.9
CMA / ARV
- ARV (median comp)
- $170,714
- List price
- $125,000
- Delta
- -26.78%
- Verdict
- UNDERPRICED
- Comps
- 20 within 1.0 mi
Show comp detail 12 sales within ~0.75 mi
| Address | Dist | Beds/Ba | Sqft | Sold | Price | $/sf | Match |
|---|---|---|---|---|---|---|---|
| 1408 E Moneta Ave | 0.13mi | 2/1.0 | 624 (-7%) | 5mo | $115,000 | $184 | 78 |
| 3824 N Dayton Ave | 0.56mi | 2/1.0 | 672 (0%) | 6mo | $65,000 | $97 | 68 |
| 1315 E Rouse Ave | 0.32mi | 2/1.0 | 700 (+4%) | 12mo | $77,500 | $111 | 68 |
| 4415 N Constantine Ave | 0.12mi | 2/1.0 | 744 (+11%) | 12mo | $129,900 | $175 | 67 |
| 3824 N Ashton Ave | 0.58mi | 2/1.0 | 676 (+1%) | 10mo | $90,000 | $133 | 64 |
| 911 E Moneta Ave | 0.52mi | 2/1.0 | 720 (+7%) | 0mo | $95,000 | $132 | 63 |
| 1400 E Seiberling Ave | 0.13mi | 1/1.0 (-1) | 728 (+8%) | 14mo | $117,500 | $161 | 63 |
| 3900 N Dayton Ave | 0.55mi | 2/1.0 | 672 (0%) | 16mo | $84,400 | $126 | 62 |
| 1401 E Rouse Ave | 0.31mi | 2/2.0 | 704 (+5%) | 19mo | $25,000 | $36 | 58 |
| 1107 E Hines Ave | 0.52mi | 2/1.0 | 620 (-8%) | 10mo | $95,000 | $153 | 54 |
| 4100 N Illinois Dr | 0.69mi | 2/1.0 | 736 (+10%) | 5mo | $77,000 | $105 | 48 |
| 3915 N Dayton Ave | 0.51mi | 2/1.0 | 581 (-14%) | 8mo | $60,000 | $103 | 47 |
Match score weights: distance 35% · size 25% · config 20% · recency 20%. Top-matched comps best support the ARV.
Projected returns pro-forma
-3.0% appreciation · 3.0% rent growth · sell at horizon
- IRR
- -9.1%
- Equity multiple
- 0.67×
- Total profit
- $-11,695
- Equity at exit
- $18,638
- IRR
- 0.4%
- Equity multiple
- 1.03×
- Total profit
- $972
- Equity at exit
- $10,808
Cash invested: $35,000 (down + closing). Projections, not guarantees.
Landlord ↔ Tenant lean methodology
- Overall (STATE)
- 43 Moderately Tenant-Leaning
- State Illinois
- 43 Moderately Tenant-Leaning · D+7
- County
- — inherits STATE
- City
- — inherits STATE
ZIP-level market 61616
- Home prices YoY
- -31.0%
- Active inventory
- 32
- Price-to-rent
- 7.9×
Monthly cashflow live
- Estimated rent
- $1,320 high interval (Pro) →
- Mortgage (P&I)
- −$656
- Tax from tax record
- −$202 /mo · $2,420/yr
- Insurance
- −$52
- HOA
- −$0
- Lot rent
- −$0
- Vacancy / Maint / Mgmt
- −$277
- Net cashflow
- $134
Break-even live
Sensitivity live
| Price | -10% $204 | -5% $169 | +0% $134 | +5% $98 | +10% $63 |
|---|---|---|---|---|---|
| Rent | -10% $29 | -5% $82 | +0% $134 | +5% $186 | +10% $238 |
| Rate | -1.0pp $197 | -0.5pp $165 | base $134 | +0.5pp $101 | +1.0pp $68 |
UW: 25.0% down · 7.5% · 30yr · 1.5% tax · 5.0% vac · 8.0% maint · 8.0% mgmt
Financing live
Cash to close
- Down payment
- $31,250
- Closing costs
- $3,750
- Reserves months
- —
- Total cash needed
- —
Loan-product check · same deal, 3 products live
Conventional
25% down · 7.5% · 30yr
- Down + closing
- —
- Monthly P&I
- —
- Monthly cashflow
- —
- DSCR
- —
- Eligible?
- —
Personal DTI + credit; lowest rate.
DSCR
20% down · 8.5% · 30yr
- Down + closing
- —
- Monthly P&I
- —
- Monthly cashflow
- —
- DSCR
- —
- Eligible?
- —
No personal income docs; deal must DSCR.
Hard money
10% down · 12.0% · 12mo
- Down + closing
- —
- Monthly P&I
- —
- Monthly cashflow
- —
- DSCR
- —
- Eligible?
- —
Short-term bridge; refi at stabilization.
Rent comps 5 comps
| Address | Beds | Baths | Sqft | Rent | $/sqft | DOM | Units | Dist |
|---|---|---|---|---|---|---|---|---|
| 811 E Lake Ave Peoria Heights, IL | 2.0 | 1.0 | 576 | $875 | $1.52 | 16d | 1 | 0.60mi |
| 4914 N Best St Peoria Heights, IL | 2.0 | 1.0 | 720 | $1,200 | $1.67 | 46d | 1 | 0.88mi |
| 249 E Oak Cliff Ct Unit 4 Peoria, IL | 2.0 | 1.0 | 600 | $800 | $1.33 | 16d | 1 | 1.08mi |
| 4809 Knoxville Ave Apt 2C Peoria, IL | 1.0 | 1.0 | 700 | $850 | $1.21 | 23d | 1 | 1.30mi |
| 4809 Knoxville Ave Unit 4819 4B, 5A, & 5B Peoria, IL | 3.0 | 2.0 | 700 | $1,800 | $2.57 | 16d | 1 | 1.30mi |
Listing history 15 events
-
2026-05-12status Pending 1312-char remark
-
2026-05-09$125,000 Active 1312-char remark
-
2026-05-05historical $125,000 1312-char remark
-
2021-08-06historical
-
2021-08-06historical
-
2016-10-17soldstatus $88,500
-
2016-10-14soldstatus $88,500
-
2016-08-22$89,900
-
2013-09-04
-
2007-03-14soldstatus $82,500
-
2007-01-12$82,500
-
2004-09-27soldstatus $71,500
-
2004-09-24soldstatus $71,500
-
2004-08-12$74,900
-
2000-10-03soldstatus $62,500
ⓘ Source: listings_history table (triggers on properties + properties_extension) + one-shot
backfill from property_details.listing_events for pre-trigger history.
Tax reassessment forecast IL · Partial reset (capped growth)
- Current annual tax
- $2,420 · $202/mo
- Projected year-2 tax
- $2,629 · $219/mo
- Expected delta
- +$209/yr (+$17/mo · 8.6%)
ⓘ Screening estimate from a state-policy table — verify with the county assessor before closing.
Climate risk First Street
- Flood 1/10 Low FEMA zone X · 0% chance over 30 yrs
- Wildfire 1/10 Low
- Heat 3/10 Moderate 7 d/yr ≥104°F today · 17 d/yr by 30 yrs out
- Wind 2/10 Low 100% chance of damaging wind over 30 yrs
- Air quality 3/10 Moderate 1 unhealthy d/yr today · 3 by 30 yrs out
Nearby sold comps map
Loading sold comps map…
Walkable amenities ~0.75 mi
Loading nearby amenities…
Taxation est. · year 1
- Rental income
- $15,842
- − Mortgage interest
- −$7,002
- − Property taxes
- −$2,420
- − Insurance
- −$625
- − Repairs & maintenance
- −$1,267
- − Management
- −$1,267
- − Depreciation
- −$3,636
- Taxable loss
- −$376
- Est. tax savings @ 24.0%
- +$90
- After-tax cash flow
- $1,694/yr
For passive investors: Depreciation is non-cash, so a rental often shows a tax loss while cash-flowing — sheltering income. Rental losses are passive: they offset passive income freely, and up to $25,000/yr can offset ordinary (W-2) income if you actively participate and your MAGI is under $100k (phasing out to $0 by $150k); unused losses carry forward. On sale, claimed depreciation is recaptured at up to 25%, and gains may owe capital-gains tax (a 1031 exchange can defer both). Figures are a year-1 estimate at your 24.0% rate — not tax advice; consult a CPA.
Schools (NCES district)
- District
- Peoria Heights CUSD 325
- NCES district ID
- 1731270
- Math proficiency
- 8% ▼ -3.00%
- Reading proficiency
- 15% ▼ -6.00%
- Median HH income
- $44,878
- Composite
- 10.35/100
- National rank
- #9788
- State rank
- #560 of 620 in IL
Livability — Peoria Heights
- Score
- 62/100
- State rank
- #886
- US rank
- #17272
Category grades
Schools grade is shown separately in the Schools card above.
Census & demographics
- Census place
- Peoria Heights, IL
- County
- Peoria County · 120,495 people
- City population
- 5,825
- Metro
- Peoria, IL
- Population (ZIP)
- 5,825
- Household income
- $60,099
- Rent vs Own
- Severe rent burden
- 82.0
Population outlook (Peoria County) Hauer SSP2
- Today (2025)
- 183,007 people
- By 2030
- 179,643 · -1.8%
- By 2040
- 171,782 · -6.1%
- By 2050
- 163,508 · -10.7%
- By 2075
- 140,178 · -23.4%
- By 2100
- 114,493 · -37.4%
Race, ethnicity, and origin ACS 2023
- Neighborhood character
- Predominantly White (87%)
- Race & ethnicity
- White 87% Black 4% Two or more races 4% Hispanic / Latino 3% Asian 3%
- Common ancestry
- Iranian 5% Italian 2% Slovak 2%
- Foreign-born
- 5% · Canada, South Korea
- Languages at home
- 93% English-only · Chinese 2% Spanish 2% Other Indo-European 2%
Political lean MEDSL · Peoria
- 2024 margin
- Toss-up / Even · D 51.5% · R 46.9% · Other 1.6%
- 2008→2024 swing
- -9.2pp toward R · 2008: 13.9pp · 2024: 4.7pp
- All cycles
- 2024: D+4.7 2020: D+6.3 2016: D+2.8 2012: D+4.4 2008: D+13.9
Not yet ingested
- Civics
- —
Market trends
- HPI YoY
- ▼ -78.59%
- Current HPI
- 175.1102
- Rent YoY
- —
- Metro
- Peoria, IL
- State GDP YoY
- ▲ 1.59%
- F500 in state
- 60
Industry mix (Fortune 500 HQ in IL)
| Industry | F500 HQs | Revenue |
|---|---|---|
| Insurance | 4 | $201B |
|
||
| Consumer Goods | 4 | $87B |
|
||
| Industrial Machinery | 3 | $64B |
|
||
| Healthcare | 2 | $55B |
|
||
| Retail / Pharmacy | 1 | $148B |
|
||
| Agriculture / Food | 1 | $86B |
|
||
Price history
+100.0% since first listed17 events — show timeline
- 2026-05-12 Pending — RMLSA as Distributed by MLS Grid
- 2026-05-09 Listed $125,000 RMLSA as Distributed by MLS Grid
- 2026-05-05 Coming Soon $125,000 RMLSA as Distributed by MLS Grid
- 2021-08-06 Listing Removed — RMLSA as Distributed by MLS Grid
- 2021-08-06 Listing Removed — RMLSA as Distributed by MLS Grid
- 2016-10-17 Sold (Public Records) $88,500 Public Records
- 2016-10-14 Sold (MLS) $88,500 RMLSA as Distributed by MLS Grid
- 2016-08-22 Listed $89,900 RMLSA as Distributed by MLS Grid
- 2013-11-03 Listing Removed — MARMLS
- 2013-09-04 Listed — RMLSA as Distributed by MLS Grid
- 2013-05-03 Listed $86,900 MARMLS
- 2007-03-14 Sold (MLS) $82,500 RMLSA as Distributed by MLS Grid
- 2007-01-12 Listed $82,500 RMLSA as Distributed by MLS Grid
- 2004-09-27 Sold (Public Records) $71,500 Public Records
- 2004-09-24 Sold (MLS) $71,500 RMLSA as Distributed by MLS Grid
- 2004-08-12 Listed $74,900 RMLSA as Distributed by MLS Grid
- 2000-10-03 Sold (Public Records) $62,500 Public Records
Property tax history
+3.2%/yrLatest (2025): $2,420 · +1.4% YoY. Source: county tax records.
Cash-flow waterfall
monthlySold comps — $/sqft
last 12 mo · ≤1 miLoading sold comps…