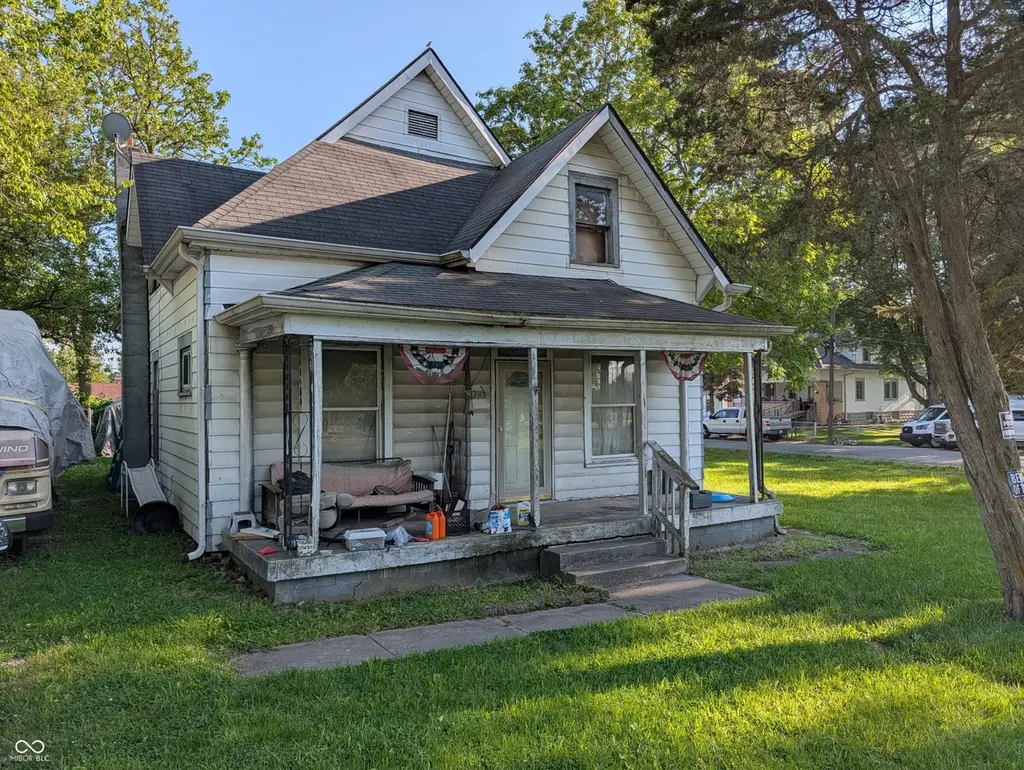
3305 Bethel Ave · Indianapolis city (balance), IN
Flood risk 1/10 · Minimal
- FEMA flood zone
- X (unshaded)
- Chance of flooding over 30 yrs
- 0.0%
- Est. flood insurance / yr
- $473 – $860
Fire risk 1/10 · Minimal
- Est. fire insurance / yr
- $717 – $1,331
Heat risk 3/10 · Minor
- Hot days now (above 101°F)
- 7 days/yr
- Hot days in 30 yrs
- 18 days/yr
Wind risk 2/10 · Minimal
- Chance of severe wind over 30 yrs
- 1.0%
Air-quality risk 3/10 · Minor
- Unhealthy air days now
- 2 days/yr
- Unhealthy air days in 30 yrs
- 3 days/yr
Risk factors via First Street. Map © Google.
Why this score? — see what drove the B- grade
The composite is a weighted blend of 9 inputs, each scored 0–100. Each bar is that input's sub-score; the figure is the points it added to the 100-point composite (weight × sub-score).
- Cash flow +30.0/30.0
- 1% rule +10.0/10.0
- DSCR +10.0/10.0
- ARV discount +7.5/15.0
- Rent growth +3.2/5.0
- Livability +2.5/5.0
- Condition / age +2.5/5.0
- Schools +1.4/10.0
- Appreciation +0.0/10.0
$49,900
🖨 Deal sheet 📄 Offer letter ✓ Due diligence
Listing remarks
Investor special with serious upside potential! Welcome to 3035 Bethel in Indianapolis - a spacious home sitting on a generously sized lot and ready for its next chapter. Featuring a large footprint and endless possibilities, this property offers the perfect opportunity for investors, flippers, or buyers looking to build equity. The home has minor fire damage at the rear, but with the right vision and updates, this one could truly shine. Whether you're looking for your next renovation project, resale opportunity, or long-term investment, the potential here is hard to ignore. Opportunities like this don't come around often - bring your ideas and make it your own! Property is being sold AS-IS
Key facts
- 0.43 acre lot
- 2 garage spots
- Built 1900
Property features AI
Exterior
- Parking: Detached 2-car garage (704 sq ft)
- Utilities: Public water; Municipal sewer connection; Solid waste service available
- Home design: Single-family residence; One level
- Construction: Aluminum siding; Block foundation
- Exterior features: Covered porch/patio; Approximately 0.43-acre lot
Interior
- Kitchen: Kitchen on main level
- Bedrooms: Two bedrooms on the main level
- Bathrooms: One full bathroom (main level)
- Heating & cooling: Forced air heating (natural gas); No central air
- Interior features: Covered patio/porch; Gas water heater
- Laundry & utility: Main level laundry room (8x8)
Neighborhood map
What this means for you Summary
Snapshot
- This is a 2-bed/1.0-bath single-family listed at $50k.
Deal economics
- At list price, monthly cash flow is $626 ($8k/yr) — positive.
- The deal already cash-flows at list — no discount required.
- Meets the 1% rule at list price ($1k rent vs $50k).
- Cap rate 21.3% vs local median 4.4% in Indianapolis city (balance) — top-decile yield for the area; either an underpriced asset or a hidden risk that comps aren't pricing in. Stress-test before assuming the spread holds.
Location & tenants
- Location reads: area grade B — affects rentability + tenant quality, not the cash-flow math above.
- Indianapolis Public Schools (urban): math 14% / reading 20% proficiency, ranked #286 of 301 in IN (top 95%) — low school quality limits family demand, transient renter base, plan for 1-2y turnover; 77% free/reduced lunch — lower-income household profile, screen leases tightly.
- Market conditions: Rents rising (+2.9%/yr); 493 active listings in the ZIP; 40 comparable units currently listed for rent nearby; rentals at typical pace (median 24d on market — plan ~3-4 weeks tenant-placement turnaround); 1,906 units permitted in Marion County in 2024 (621 in 5+ unit buildings).
Forward outlook
- Local home prices are declining (-3.0%/yr); year-one equity from $345 of loan paydown is wiped out by about $1k of value loss. Plan a longer hold.
- Marion County population projected at +18% by 2050 — long-run rental-demand tailwind backs the buy-and-hold thesis.
- At projected returns (-3.0% appreciation + 2.9% rent growth), your $14k cash investment doubles in ~3 years — after that, you're playing with house money.
Negotiation context
- Only 5 days on market — expect competitive offers; lowballing is unlikely to land.
- 2 sale attempts since 20y ago with the ask held roughly flat each time — persistent listings suggest the price (not the market) is what's stuck; bring a comps-based counter.
Risks & watch-outs
- Watch-outs: built in 1900 — expect roof / HVAC / electrical / plumbing capex.
Questions for the listing agent
- Built in 1900 — when were the roof, HVAC, electrical panel, plumbing, and water heater last replaced?
- Is there a deadline driving the sale (1031 exchange, divorce, estate, relocation)? That informs how much negotiation room exists.
- What's the average days-on-market for RENTAL listings here right now (not sales)? A rising rental-DOM trend means longer vacancies and softer asking-rent achievability than the comps imply.
- What's the recent tenant-quality profile in this submarket — average credit score on applications, eviction rate, late-payment / NSF rate, and stable-employment percentage? A property-management company in the area should have these aggregated.
- How much new for-sale + rental construction is in the pipeline within 1–3 miles? Heavy new supply typically softens prices + rents 12–24 months out; constrained supply supports both.
Investment metrics
- 1% rule
- 2.46% ✓
- Cap rate
- 21.34%
- Cash-on-cash
- 53.74%
- DSCR
- 3.39
- GRM
- 3.4
CMA / ARV
- ARV (on-the-fly)
- $164,696
- Comps found
- 12
Show comp detail 12 sales within ~0.75 mi
| Address | Dist | Beds/Ba | Sqft | Sold | Price | $/sf | Match |
|---|---|---|---|---|---|---|---|
| 1842 Carpenter Cir | 0.21mi | 3/1.0 (+1) | 912 (-4%) | 5mo | $157,500 | $173 | 74 |
| 3153 E Tabor St | 0.25mi | 2/1.0 | 840 (-12%) | 1mo | $100,000 | $119 | 68 |
| 430 N 18th Ave | 0.75mi | 2/1.0 | 929 (-2%) | 3mo | $175,000 | $188 | 59 |
| 3139 E Minnesota St | 0.36mi | 3/1.0 (+1) | 1,032 (+8%) | 7mo | $120,000 | $116 | 58 |
| 2550 Beechcrest Dr | 0.62mi | 3/1.0 (+1) | 1,000 (+5%) | 2mo | $188,000 | $188 | 56 |
| 1443 S Oxford St | 0.64mi | 3/1.0 (+1) | 900 (-6%) | 3mo | $80,000 | $89 | 54 |
| 3617 Woodcliff Dr | 0.48mi | 3/1.0 (+1) | 1,025 (+8%) | 10mo | $187,500 | $183 | 52 |
| 2334 S Keystone Ave | 0.74mi | 2/1.0 | 912 (-4%) | 9mo | $175,000 | $192 | 51 |
| 1641 S Sherman Dr | 0.57mi | 3/1.0 (+1) | 1,008 (+6%) | 10mo | $110,000 | $109 | 50 |
| 4108 E Naomi St | 0.74mi | 2/1.0 | 896 (-6%) | 8mo | $135,000 | $151 | 49 |
| 1212 Vandeman St | 0.69mi | 2/1.0 | 880 (-8%) | 8mo | $39,900 | $45 | 48 |
| 2325 E Legrande Ave | 0.73mi | 3/1.0 (+1) | 832 (-13%) | 10mo | $153,000 | $184 | 31 |
Match score weights: distance 35% · size 25% · config 20% · recency 20%. Top-matched comps best support the ARV.
Projected returns pro-forma
-3.0% appreciation · 2.88% rent growth · sell at horizon
- IRR
- 51.7%
- Equity multiple
- 3.26×
- Total profit
- $31,640
- Equity at exit
- $7,440
- IRR
- 57.0%
- Equity multiple
- 6.61×
- Total profit
- $78,340
- Equity at exit
- $4,314
Cash invested: $13,972 (down + closing). Projections, not guarantees.
Landlord ↔ Tenant lean methodology
- Overall (STATE)
- 90 Strongly Landlord-Friendly
- State Indiana
- 90 Strongly Landlord-Friendly · R+11
- County
- — inherits STATE
- City
- — inherits STATE
ZIP-level market 46203
- Home prices YoY
- -26.7%
- Rents YoY
- 2.9%
- Active inventory
- 493
- Price-to-rent
- 3.4×
Monthly cashflow live
- Estimated rent
- $1,229 high interval (Pro) →
- Mortgage (P&I)
- −$262
- Tax est. 1.5%
- −$62 /mo · $748/yr
- Insurance
- −$21
- HOA
- −$0
- Vacancy / Maint / Mgmt
- −$258
- Net cashflow
- $626
Break-even live
UW: 25.0% down · 7.5% · 30yr · 1.5% tax · 5.0% vac · 8.0% maint · 8.0% mgmt
Financing live
Cash to close
- Down payment
- $12,475
- Closing costs
- $1,497
- Reserves months
- —
- Total cash needed
- —
Loan-product check · same deal, 3 products live
Conventional
25% down · 7.5% · 30yr
- Down + closing
- —
- Monthly P&I
- —
- Monthly cashflow
- —
- DSCR
- —
- Eligible?
- —
Personal DTI + credit; lowest rate.
DSCR
20% down · 8.5% · 30yr
- Down + closing
- —
- Monthly P&I
- —
- Monthly cashflow
- —
- DSCR
- —
- Eligible?
- —
No personal income docs; deal must DSCR.
Hard money
10% down · 12.0% · 12mo
- Down + closing
- —
- Monthly P&I
- —
- Monthly cashflow
- —
- DSCR
- —
- Eligible?
- —
Short-term bridge; refi at stabilization.
Rent comps 40 comps
| Address | Beds | Baths | Sqft | Rent | $/sqft | DOM | Units | Dist |
|---|---|---|---|---|---|---|---|---|
| 1730 Perkins Ave Indianapolis, IN | 3.0 | 1.0 | 924 | $1,300 | $1.41 | 23d | 1 | 0.32mi |
| 3012 E Minnesota St Indianapolis, IN | 2.0 | 1.0 | 875 | $1,000 | $1.14 | 44d | 1 | 0.41mi |
| 3012 E Minnesota St Indianapolis, IN | 2.0 | 1.0 | 767 | $1,000 | $1.30 | 23d | 1 | 0.41mi |
| 1505 S Rural St Indianapolis, IN | 3.0 | 1.0 | 1104 | $1,500 | $1.36 | 12d | 1 | 0.60mi |
| 2430 E Kelly St Indianapolis, IN | 2.0 | 1.0 | 965 | $949 | $0.98 | 44d | 1 | 0.63mi |
| 3518 Terrace Ave Indianapolis, IN | 3.0 | 1.0 | 864 | $1,300 | $1.50 | 44d | 1 | 0.66mi |
| 2036 Calhoun St Indianapolis, IN | 2.0 | 1.0 | 880 | $1,200 | $1.36 | 7d | 1 | 0.84mi |
| 3441 Prospect St Indianapolis, IN | 2.0 | 1.0 | 1008 | $1,500 | $1.49 | 23d | 1 | 0.86mi |
| 3441 Prospect St Indianapolis, IN | 2.0 | 1.0 | 1008 | $1,700 | $1.69 | 44d | 1 | 0.86mi |
| 1727 S Randolph St Indianapolis, IN | 1.0 | 1.0 | 616 | $950 | $1.54 | 44d | 1 | 1.00mi |
| 1815 Dawson St Unit 1815 Indianapolis, IN | 2.0 | 1.0 | 1019 | $999 | $0.98 | 14d | 1 | 1.04mi |
| 2469 Dawson St Indianapolis, IN | 2.0 | 1.0 | 700 | $949 | $1.36 | 3d | 4 | 1.12mi |
| 2430 Albany St Beech Grove, IN | 2.0 | 1.0 | 800 | $899 | $1.12 | 14d | 1 | 1.13mi |
| 2430 Albany St Apt 01 Beech Grove, IN | 2.0 | 1.0 | 800 | $899 | $1.12 | 7d | 1 | 1.13mi |
| 1706 E Tabor St Unit 1708 Indianapolis, IN | 3.0 | 1.0 | 1000 | $1,300 | $1.30 | 7d | 1 | 1.14mi |
| 1534 Dawson St Indianapolis, IN | 3.0 | 1.0 | 1040 | $1,499 | $1.44 | 23d | 1 | 1.14mi |
| 2633 S Randolph St Unit b Indianapolis, IN | 2.0 | 1.0 | 900 | $995 | $1.11 | 23d | 1 | 1.14mi |
| 2633 S Randolph St Indianapolis, IN | 2.0 | 1.0 | 900 | $995 | $1.11 | 10d | 1 | 1.14mi |
| 1503 Dawson St Indianapolis, IN | 2.0 | 1.0 | 700 | $1,200 | $1.71 | 44d | 1 | 1.15mi |
| 1640 Asbury St Indianapolis, IN | 1.0 | 1.0 | 700 | $850 | $1.21 | 44d | 1 | 1.16mi |
| 1637 S State Ave Indianapolis, IN | 2.0 | 1.5 | 816 | $900 | $1.10 | 18d | 1 | 1.20mi |
| 1026 Laurel St Indianapolis, IN | 1.0 | 1.0 | 655 | $860 | $1.31 | 44d | 1 | 1.22mi |
| 1543 S State Ave Indianapolis, IN | 2.0 | 1.0 | 1086 | $1,100 | $1.01 | 7d | 1 | 1.23mi |
| 2315 Bischoff Dr Beech Grove, IN | 2.0 | 1.0 | 1065 | $848 | $0.80 | 23d | 2 | 1.23mi |
| 3706 Hoyt Ave Indianapolis, IN | 3.0 | 1.0 | 960 | $1,500 | $1.56 | 14d | 1 | 1.24mi |
| 3702 Hoyt Ave Indianapolis, IN | 3.0 | 2.0 | 960 | $1,500 | $1.56 | 14d | 1 | 1.24mi |
| 2230 Woodlawn Ave Indianapolis, IN | 2.0 | 1.0 | 924 | $1,350 | $1.46 | 44d | 1 | 1.27mi |
| 1604 E Kelly St Indianapolis, IN | 2.0 | 1.0 | 800 | $1,025 | $1.28 | 10d | 1 | 1.27mi |
| 1604 E Kelly St Indianapolis, IN | 2.0 | 1.0 | 750 | $1,025 | $1.37 | 18d | 1 | 1.27mi |
| 1620 E Palmer St Indianapolis, IN | 2.0 | 1.0 | 824 | $1,200 | $1.46 | 23d | 1 | 1.29mi |
| 5010 Emerton Pl Indianapolis, IN | 2.0 | 1.5 | 1002 | $1,095 | $1.09 | 44d | 1 | 1.29mi |
| 1637 Hoefgen St Indianapolis, IN | 2.0 | 1.0 | 780 | $1,000 | $1.28 | 44d | 1 | 1.30mi |
| 1013 Harlan St Indianapolis, IN | 2.0 | 1.0 | 1008 | $1,475 | $1.46 | 44d | 1 | 1.31mi |
| 1011 Harlan St Indianapolis, IN | 2.0 | 2.0 | 1008 | $1,525 | $1.51 | 44d | 1 | 1.31mi |
| 3906 Hoyt Ave Indianapolis, IN | 2.0 | 1.0 | 912 | $1,250 | $1.37 | 7d | 1 | 1.31mi |
| 5056 Emerton Pl Unit 5056 Indianapolis, IN | 2.0 | 1.0 | 868 | $1,245 | $1.43 | 23d | 1 | 1.32mi |
| 5056 Emerton Pl Unit 5046 Indianapolis, IN | 2.0 | 1.5 | 1039 | $1,245 | $1.20 | 23d | 1 | 1.32mi |
| 2116 Woodlawn Ave Indianapolis, IN | 2.0 | 2.0 | 1054 | $1,175 | $1.11 | 7d | 1 | 1.33mi |
| 3022 English Ave Unit 3022 Indianapolis, IN | 2.0 | 1.0 | 600 | $650 | $1.08 | 44d | 1 | 1.40mi |
| 1409 E Tabor St Indianapolis, IN | 1.0 | 1.0 | 528 | $775 | $1.47 | 23d | 1 | 1.42mi |
Listing history 4 events
-
2026-05-21$49,900 Active
-
2007-04-30historical
-
2006-09-05$24,900
-
2000-08-11soldstatus $47,481
ⓘ Source: listings_history table (triggers on properties + properties_extension) + one-shot
backfill from property_details.listing_events for pre-trigger history.
Climate risk First Street
- Flood 1/10 Low FEMA zone X (unshaded) · 0% chance over 30 yrs
- Wildfire 1/10 Low
- Heat 3/10 Moderate 7 d/yr ≥101°F today · 18 d/yr by 30 yrs out
- Wind 2/10 Low 100% chance of damaging wind over 30 yrs
- Air quality 3/10 Moderate 2 unhealthy d/yr today · 3 by 30 yrs out
Nearby sold comps map
Loading sold comps map…
Walkable amenities ~0.75 mi
Loading nearby amenities…
Taxation est. · year 1
- Rental income
- $14,743
- − Mortgage interest
- −$2,795
- − Property taxes
- −$748
- − Insurance
- −$250
- − Repairs & maintenance
- −$1,179
- − Management
- −$1,179
- − Depreciation
- −$1,452
- Taxable income
- $7,140
- Est. tax owed @ 24.0%
- −$1,714
- After-tax cash flow
- $5,796/yr
For passive investors: Depreciation is non-cash, so a rental often shows a tax loss while cash-flowing — sheltering income. Rental losses are passive: they offset passive income freely, and up to $25,000/yr can offset ordinary (W-2) income if you actively participate and your MAGI is under $100k (phasing out to $0 by $150k); unused losses carry forward. On sale, claimed depreciation is recaptured at up to 25%, and gains may owe capital-gains tax (a 1031 exchange can defer both). Figures are a year-1 estimate at your 24.0% rate — not tax advice; consult a CPA.
Schools (NCES district)
- District
- Indianapolis Public Schools
- NCES district ID
- 1804770
- Math proficiency
- 14% ▼ -7.00%
- Reading proficiency
- 20% ▼ -3.00%
- Median HH income
- $32,034
- Composite
- 13.69/100
- National rank
- #9499
- State rank
- #286 of 301 in IN
Livability — Indianapolis city (balance)
No livability data for this city. (Only ~50 U.S. cities are tracked.)
Census & demographics
- Census place
- Indianapolis city (balance), IN
- County
- Marion County · 998,460 people
- City population
- 881,119
- Metro
- Indianapolis-Carmel-Anderson, IN
- Population (ZIP)
- 37,758
- Household income
- $57,393
- Rent vs Own
- Severe rent burden
- 1499.0
Population outlook (Marion County) Hauer SSP2
- Today (2025)
- 1,025,572 people
- By 2030
- 1,065,727 · +3.9%
- By 2040
- 1,141,577 · +11.3%
- By 2050
- 1,208,920 · +17.9%
- By 2075
- 1,367,288 · +33.3%
- By 2100
- 1,438,201 · +40.2%
Race, ethnicity, and origin ACS 2023
- Neighborhood character
- Predominantly White (69%)
- Race & ethnicity
- White 69% Hispanic / Latino 14% Black 12% Two or more races 8% Asian 2% Native American 1%
- Hispanic origin (detail)
- Mexican 12% Puerto Rican 1%
- Common ancestry
- Slovak 2% Lithuanian 2% Italian 1%
- Foreign-born
- 8% · Canada
- Languages at home
- 88% English-only · Spanish 10% Other Indo-European 1%
Political lean MEDSL · Marion
- 2024 margin
- Strong D (+27.7) · D 63.0% · R 35.3% · Other 1.7%
- 2008→2024 swing
- -0.7pp no change · 2008: 28.4pp · 2024: 27.7pp
- All cycles
- 2024: D+27.7 2020: D+29.1 2016: D+22.8 2012: D+22.2 2008: D+28.4
Not yet ingested
- Civics
- —
Market trends
- HPI YoY
- ▼ -127.37%
- Current HPI
- 349.579
- Rent YoY
- ▲ 2.88%
- Metro
- Indianapolis-Carmel-Anderson, IN
- State GDP YoY
- ▲ 2.90%
- F500 in state
- 18
Industry mix (Fortune 500 HQ in IN)
| Industry | F500 HQs | Revenue |
|---|---|---|
| Industrial Machinery | 2 | $37B |
|
||
| Healthcare | 1 | $177B |
|
||
| Pharmaceuticals | 1 | $45B |
|
||
| Metals / Steel | 1 | $18B |
|
||
| Agriculture | 1 | $17B |
|
||
| Packaging | 1 | $12B |
|
||
Price history
+5.1% since first listed4 events — show timeline
- 2026-05-21 Listed $49,900 MIBOR as Distributed by MLS Grid
- 2007-04-30 Listing Removed — MIBOR as Distributed by MLS Grid
- 2006-09-05 Listed $24,900 MIBOR as Distributed by MLS Grid
- 2000-08-11 Sold (Public Records) $47,481 Public Records
Property tax history
+12.0%/yrLatest (2025): $4,138 · -11.0% YoY. Source: county tax records.
Cash-flow waterfall
monthlySold comps — $/sqft
last 12 mo · ≤1 miLoading sold comps…