 31-Plex
150 Gateway Ct · Stockton, CA
Flood risk 1/10 · Minimal
- FEMA flood zone
- X
- Chance of flooding over 30 yrs
- 0.0%
- Est. flood insurance / yr
- $507 – $1,088
Fire risk 3/10 · Minor
- Est. fire insurance / yr
- $659 – $1,223
Heat risk 7/10 · Major
- Hot days now (above 102°F)
- 7 days/yr
- Hot days in 30 yrs
- 15 days/yr
Wind risk 1/10 · Minimal
- Chance of severe wind over 30 yrs
- —
Air-quality risk 10/10 · Severe
- Unhealthy air days now
- 30 days/yr
- Unhealthy air days in 30 yrs
- 30 days/yr
Risk factors via First Street. Map © Google.
Why this score? — see what drove the C grade
The composite is a weighted blend of 9 inputs, each scored 0–100. Each bar is that input's sub-score; the figure is the points it added to the 100-point composite (weight × sub-score).
- Cash flow +26.0/30.0
- DSCR +8.7/10.0
- ARV discount +7.5/15.0
- 1% rule +5.9/10.0
- Rent growth +3.2/5.0
- Schools +2.9/10.0
- Livability +2.9/5.0
- Condition / age +2.5/5.0
- Appreciation +0.0/10.0
$4,635,000
🖨 Deal sheet 📄 Offer letter ✓ Due diligence
Multi-family units
County records classify this as Multi-Family (5+ Unit). Listing-text estimate: 31 units. confirmed
5+ unit building — per-unit beds/baths from public records are typically unavailable; the breakdown below (if shown) is an estimate from the listing text.
Listing remarks
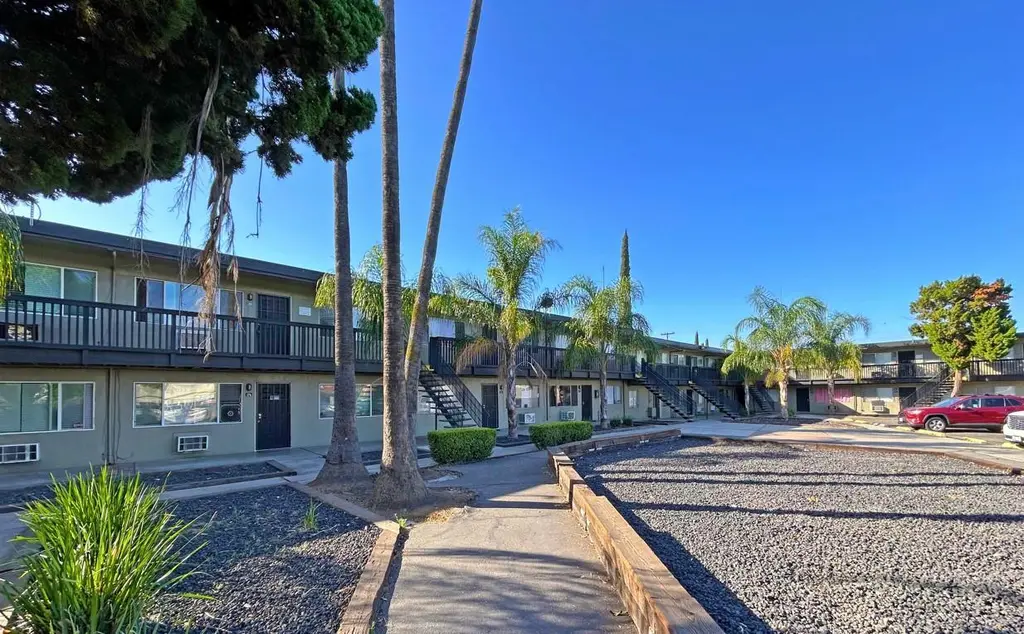
The Gateway Apartments are a 31-unit multifamily asset located at 150 Gateway Court in North Stockton. This well-positioned property offers a strong investment opportunity in a high-demand area just minutes from major retail centers, employment hubs, and top colleges. The unit mix consists entirely of spacious 2- and 3-bedroom layouts across six unique floor plans, complemented by gated parking, secure entries, onsite laundry, and generous common areas. The Gateway Apartments, a 31-unit multifamily asset located at 150 Gateway Court in North Stockton. This well-positioned property offers a strong investment opportunity in a high-demand area just minutes from major retail centers, employment
Key facts
- 1.03 acre lot
- 31 parking spots
- Built 1968
Property features AI
Finance
- HOA & community: No homeowners association
Exterior
- Parking: Ample parking (total 31 parking spaces)
- Utilities: Cable connected; Natural gas connected; Water and sewer: see remarks; Irrigation source: see remarks
- Home design: Apartments (5+ units); Residential income property; Built in 1968; Address: 150 Gateway Ct, Stockton, CA 95207
- Construction: Built in 1968
- Exterior features: Lot is approximately 1.03 acres; Lot features: None specified
Interior
- Bedrooms: Typical unit has 2 bedrooms
- Flooring: Carpet; Tile; Vinyl
- Bathrooms: Typical unit has 1 full bathroom
- Heating & cooling: Wall furnaces; Ceiling fans; Wall-mounted cooling units
- Interior features: Two-story building
- Laundry & utility: Shared laundry in common area
Neighborhood map
What this means for you Summary
Snapshot
- This is a 15×2bd/?ba + 16×3bd/?ba units multifamily listed at $4.63M.
Deal economics
- At list price, monthly cash flow is $11k ($138k/yr) — positive. Per door: $371/mo.
- The deal already cash-flows at list — no discount required.
- Meets the 1% rule at list price ($51k rent vs $4.63M).
- Cap rate 9.3% vs local median 3.6% in Stockton — top-decile yield for the area; either an underpriced asset or a hidden risk that comps aren't pricing in. Stress-test before assuming the spread holds.
Location & tenants
- Location reads 57/100 on livability (#734 in CA) — a working-class tenant base; expect higher turnover. Strengths: housing A+, health & safety A, amenities A-; Watch: employment C-, schools D-, crime F.
- Stockton Unified (urban): math 23% / reading 46% proficiency, ranked #295 of 517 in CA (top 57%) — families likely to look elsewhere, expect single-tenant / working-renter base with shorter leases; 78% free/reduced lunch — lower-income household profile, screen leases tightly.
- Market conditions: Rents rising (+2.7%/yr); 171 active listings in the ZIP; 3,779 units permitted in San Joaquin County in 2024 (0 in 5+ unit buildings).
- At $50,691/mo this rent would consume 876% of the median local household income ($69k/yr) (locally 3292% of renters already pay >50% of income on rent) — very limited rent-growth headroom before tenants either downsize or default.
Forward outlook
- Local home prices are declining (-3.0%/yr); year-one equity from $32k of loan paydown is wiped out by about $139k of value loss. Plan a longer hold.
- San Joaquin County population projected at +17% by 2050 — long-run rental-demand tailwind backs the buy-and-hold thesis.
Negotiation context
- Only 1 days on market — expect competitive offers; lowballing is unlikely to land.
- 2 sale attempts since 2y ago; this cycle's ask is 343233% above the opening price — seller raised mid-cycle; expect resistance to lowballs.
- Current owner paid $1.95M; list at $4.63M implies a 138% gain — meaningful room to come down on a strong offer.
Risks & watch-outs
- Climate carrying-cost: extreme-heat days projected 7→15/yr by 2055 (HVAC capex compounding) — expect insurance premiums to compound above CPI over the hold.
Questions for the listing agent
- Can we see the unit-by-unit rent roll, current vacancy, and any below-market leases? What's the average tenancy length?
- What capital expenditures (roof, boiler, parking lot, exteriors) have been made in the last 5 years, and what's planned in the next 2?
- Built in 1968 — when were the roof, HVAC, electrical panel, plumbing, and water heater last replaced?
- Is there a deadline driving the sale (1031 exchange, divorce, estate, relocation)? That informs how much negotiation room exists.
- Schools are D-rated, which usually means shorter tenancies and higher turnover. Who's the typical renter profile here, and what's been the actual vacancy rate?
- Crime grade is F in this area — have there been break-ins, vandalism, or insurance claims at this property in the last 3 years? What carrier currently insures it and at what premium?
- What's the average days-on-market for RENTAL listings here right now (not sales)? A rising rental-DOM trend means longer vacancies and softer asking-rent achievability than the comps imply.
- What's the recent tenant-quality profile in this submarket — average credit score on applications, eviction rate, late-payment / NSF rate, and stable-employment percentage? A property-management company in the area should have these aggregated.
- How much new apartment / multifamily construction is in the pipeline within 1–3 miles? Heavy new supply (>2% of stock underway) typically softens rents 12–24 months out; light construction supports rent growth.
Investment metrics
- 1% rule
- 1.09% ✓
- Cap rate
- 9.27%
- Cash-on-cash
- 10.63%
- DSCR
- 1.47
- GRM
- 7.6
CMA / ARV
No comps found within radius.
Projected returns pro-forma
-3.0% appreciation · 2.69% rent growth · sell at horizon
- IRR
- -0.7%
- Equity multiple
- 0.97×
- Total profit
- $-36,166
- Equity at exit
- $691,094
- IRR
- 8.6%
- Equity multiple
- 1.65×
- Total profit
- $841,268
- Equity at exit
- $400,750
Cash invested: $1,297,800 (down + closing). Projections, not guarantees.
Landlord ↔ Tenant lean methodology
- Overall (STATE)
- 18 Strongly Tenant-Friendly
- State California
- 18 Strongly Tenant-Friendly · D+13
- County
- — inherits STATE
- City
- — inherits STATE
ZIP-level market 95207
- Rents YoY
- 2.7%
- Active inventory
- 171
- Price-to-rent
- 246.2×
Monthly cashflow live
- Estimated rent
- $50,691 high interval (Pro) →
- Mortgage (P&I)
- −$24,306
- Tax from tax record
- −$2,314 /mo · $27,774/yr
- Insurance
- −$1,931
- HOA
- −$0
- Vacancy / Maint / Mgmt
- −$10,645
- Net cashflow
- $11,494
Break-even live
31-unit breakdown (identical units grouped — click to expand)
| Units | Beds | Baths | Est. rent |
|---|---|---|---|
| 15× units | 2 | 0 | $23,535 |
| #1 | 2 | 0 | $1,569 |
| #2 | 2 | 0 | $1,569 |
| #3 | 2 | 0 | $1,569 |
| #4 | 2 | 0 | $1,569 |
| #5 | 2 | 0 | $1,569 |
| #6 | 2 | 0 | $1,569 |
| #7 | 2 | 0 | $1,569 |
| #8 | 2 | 0 | $1,569 |
| #9 | 2 | 0 | $1,569 |
| #10 | 2 | 0 | $1,569 |
| #11 | 2 | 0 | $1,569 |
| #12 | 2 | 0 | $1,569 |
| #13 | 2 | 0 | $1,569 |
| #14 | 2 | 0 | $1,569 |
| #15 | 2 | 0 | $1,569 |
| 16× units | 3 | 0 | $27,168 |
| #16 | 3 | 0 | $1,698 |
| #17 | 3 | 0 | $1,698 |
| #18 | 3 | 0 | $1,698 |
| #19 | 3 | 0 | $1,698 |
| #20 | 3 | 0 | $1,698 |
| #21 | 3 | 0 | $1,698 |
| #22 | 3 | 0 | $1,698 |
| #23 | 3 | 0 | $1,698 |
| #24 | 3 | 0 | $1,698 |
| #25 | 3 | 0 | $1,698 |
| #26 | 3 | 0 | $1,698 |
| #27 | 3 | 0 | $1,698 |
| #28 | 3 | 0 | $1,698 |
| #29 | 3 | 0 | $1,698 |
| #30 | 3 | 0 | $1,698 |
| #31 | 3 | 0 | $1,698 |
| Total (31 units) | $50,691 | ||
UW: 25.0% down · 7.5% · 30yr · 1.5% tax · 5.0% vac · 8.0% maint · 8.0% mgmt
Financing live
Cash to close
- Down payment
- $1,158,750
- Closing costs
- $139,050
- Reserves months
- —
- Total cash needed
- —
Loan-product check · same deal, 3 products live
Conventional
25% down · 7.5% · 30yr
- Down + closing
- —
- Monthly P&I
- —
- Monthly cashflow
- —
- DSCR
- —
- Eligible?
- —
Personal DTI + credit; lowest rate.
DSCR
20% down · 8.5% · 30yr
- Down + closing
- —
- Monthly P&I
- —
- Monthly cashflow
- —
- DSCR
- —
- Eligible?
- —
No personal income docs; deal must DSCR.
Hard money
10% down · 12.0% · 12mo
- Down + closing
- —
- Monthly P&I
- —
- Monthly cashflow
- —
- DSCR
- —
- Eligible?
- —
Short-term bridge; refi at stabilization.
Listing history 9 events
-
2024-03-14historical $1,350
-
2024-01-18historical $1,350
-
2024-01-18$1,350
-
2024-01-04$1,500
-
2023-07-28historical
-
2017-12-22soldstatus $1,950,000
-
2003-06-30soldstatus $2,300,000
-
2000-11-22soldstatus $800,000
-
1986-12-31soldstatus $166,000
ⓘ Source: listings_history table (triggers on properties + properties_extension) + one-shot
backfill from property_details.listing_events for pre-trigger history.
Tax reassessment forecast CA · Resets to sale price
- Current annual tax
- $27,774 · $2,314/mo
- Projected year-2 tax
- $35,226 · $2,936/mo
- Expected delta
- +$7,452/yr (+$621/mo · 26.8%)
ⓘ Screening estimate from a state-policy table — verify with the county assessor before closing.
Climate risk First Street
- Flood 1/10 Low FEMA zone X · 0% chance over 30 yrs
- Wildfire 3/10 Moderate
- Heat 7/10 Severe 7 d/yr ≥102°F today · 15 d/yr by 30 yrs out
- Wind 1/10 Low
- Air quality 10/10 Extreme 30 unhealthy d/yr today · 30 by 30 yrs out
Nearby sold comps map
Loading sold comps map…
Walkable amenities ~0.75 mi
Loading nearby amenities…
Taxation est. · year 1
- Rental income
- $608,292
- − Mortgage interest
- −$259,632
- − Property taxes
- −$27,774
- − Insurance
- −$23,175
- − Repairs & maintenance
- −$48,663
- − Management
- −$48,663
- − Depreciation
- −$134,836
- Taxable income
- $65,548
- Est. tax owed @ 24.0%
- −$15,731
- After-tax cash flow
- $122,193/yr
For passive investors: Depreciation is non-cash, so a rental often shows a tax loss while cash-flowing — sheltering income. Rental losses are passive: they offset passive income freely, and up to $25,000/yr can offset ordinary (W-2) income if you actively participate and your MAGI is under $100k (phasing out to $0 by $150k); unused losses carry forward. On sale, claimed depreciation is recaptured at up to 25%, and gains may owe capital-gains tax (a 1031 exchange can defer both). Figures are a year-1 estimate at your 24.0% rate — not tax advice; consult a CPA.
Schools (NCES district)
- District
- Stockton Unified
- NCES district ID
- 0638010
- Math proficiency
- 23% ▲ 2.00%
- Reading proficiency
- 46% ▲ 16.00%
- Median HH income
- $37,563
- Composite
- 28.65/100
- National rank
- #6701
- State rank
- #295 of 517 in CA
Livability — Stockton
- Score
- 57/100
- State rank
- #734
- US rank
- #21638
Category grades
Schools grade is shown separately in the Schools card above.
Census & demographics
- Census place
- Stockton, CA
- County
- San Joaquin County · 729,570 people
- City population
- 332,006
- Metro
- Stockton, CA
- Population (ZIP)
- 52,414
- Household income
- $69,455
- Rent vs Own
- Severe rent burden
- 3292.0
Population outlook (San Joaquin County) Hauer SSP2
- Today (2025)
- 796,965 people
- By 2030
- 828,849 · +4.0%
- By 2040
- 885,611 · +11.1%
- By 2050
- 929,798 · +16.7%
- By 2075
- 994,578 · +24.8%
- By 2100
- 971,291 · +21.9%
Race, ethnicity, and origin ACS 2023
- Neighborhood character
- Highly diverse neighborhood (Simpson 0.73)
- Race & ethnicity
- Hispanic / Latino 43% Two or more races 24% White 23% Black 14% Asian 13%
- Hispanic origin (detail)
- Mexican 38%
- Common ancestry
- Russian 1% Italian 1% Lithuanian 1%
- Foreign-born
- 18% · Canada, China, Vietnam
- Languages at home
- 66% English-only · Spanish 22% Other Asian/Pacific 4% Tagalog/Filipino 2%
Political lean MEDSL · San Joaquin
- 2024 margin
- Toss-up / Even · D 48.0% · R 48.9% · Other 3.0%
- 2008→2024 swing
- -11.6pp toward R · 2008: 10.7pp · 2024: -0.9pp
- All cycles
- 2024: R+0.9 2020: D+13.9 2016: D+12.9 2012: D+8.9 2008: D+10.7
Not yet ingested
- Civics
- —
Market trends
- HPI YoY
- ▼ -454.91%
- Current HPI
- 358.6024
- Rent YoY
- ▲ 2.69%
- Metro
- Stockton, CA
- State GDP YoY
- ▲ 3.21%
- F500 in state
- 116
Industry mix (Fortune 500 HQ in CA)
| Industry | F500 HQs | Revenue |
|---|---|---|
| Technology | 27 | $1,492B |
|
||
| Financial Services | 3 | $174B |
|
||
| Retail | 3 | $44B |
|
||
| Insurance | 3 | $26B |
|
||
| Media / Entertainment | 2 | $115B |
|
||
| Pharmaceuticals / Biotech | 2 | $62B |
|
||
Price history
-99.2% since first listed9 events — show timeline
- 2024-03-14 Rental Removed $1,350 APPFOLIO
- 2024-01-18 Rental Removed $1,350 APPFOLIO
- 2024-01-18 Listed for Rent $1,350 APPFOLIO
- 2024-01-04 Listed for Rent $1,500 APPFOLIO
- 2023-07-28 Rental Removed — APPFOLIO
- 2017-12-22 Sold (Public Records) $1,950,000 Public Records
- 2003-06-30 Sold (Public Records) $2,300,000 Public Records
- 2000-11-22 Sold (Public Records) $800,000 Public Records
- 1986-12-31 Sold (Public Records) $166,000 Public Records
Property tax history
-0.8%/yrLatest (2025): $27,774 · +1.6% YoY. Source: county tax records.
Cash-flow waterfall
monthlySold comps — $/sqft
last 12 mo · ≤1 miLoading sold comps…