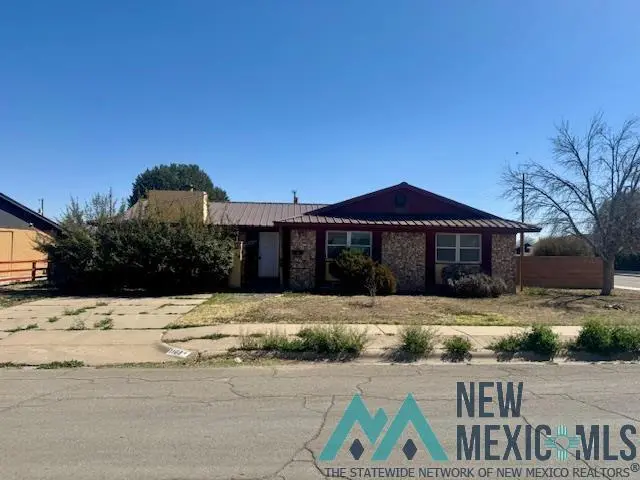
1109 Avenida Manana St · Roswell, NM
Flood risk 1/10 · Minimal
- FEMA flood zone
- X (shaded)
- Chance of flooding over 30 yrs
- 0.0%
- Est. flood insurance / yr
- $507 – $1,088
Fire risk 6/10 · Moderate
- Est. fire insurance / yr
- $706 – $1,312
Heat risk 5/10 · Moderate
- Hot days now (above 99°F)
- 7 days/yr
- Hot days in 30 yrs
- 20 days/yr
Wind risk 2/10 · Minimal
- Chance of severe wind over 30 yrs
- —
Air-quality risk 1/10 · Minimal
- Unhealthy air days now
- 0 days/yr
- Unhealthy air days in 30 yrs
- 0 days/yr
Risk factors via First Street. Map © Google.
Why this score? — see what drove the B- grade
The composite is a weighted blend of 9 inputs, each scored 0–100. Each bar is that input's sub-score; the figure is the points it added to the 100-point composite (weight × sub-score).
- Cash flow +30.0/30.0
- DSCR +10.0/10.0
- 1% rule +9.4/10.0
- ARV discount +7.5/15.0
- Livability +3.8/5.0
- Schools +2.6/10.0
- Rent growth +2.5/5.0
- Condition / age +2.5/5.0
- Appreciation +0.0/10.0
$105,000
🖨 Deal sheet 📄 Offer letter ✓ Due diligence
Listing remarks MLS
This Beautiful Corner lot Brick Home! Won't last long! near shopping, school, and restaurants and located in Southwest neighborhood, at 1,635 sq. ft. has 3 bedrooms, 2 baths that have been recently remodeled, Living room, Family room with fireplace, Kitchen/Dining room combo with a huge pantry room, common area in front with privacy gate, covered patio in fenced in backyard and storage shed, per owner, new roof and HVAC unit in 2017, new fixtures, carpet and fans thru-out, and so much more! Must see!
Key facts
- Large corner lot
- Completely gutted
- Brick home
Tags
Neighborhood map
What this means for you Summary
Snapshot
- This is a 3-bed/2.0-bath single-family listed at $105k.
Deal economics
- At list price, monthly cash flow is $495 ($6k/yr) — positive.
- The deal already cash-flows at list — no discount required.
- Meets the 1% rule at list price ($2k rent vs $105k).
- Recommended offer: $103k (1.5% below list) — sets the bar for market timing.
Location & tenants
- Location reads 75/100 on livability (#8 in NM, #4,339 nationally) — a middle-class / working-renter tenant base. Strengths: commute A+, cost of living A+, housing A+; Watch: employment D, schools F, crime F.
- Roswell Independent Schools (town): math 11% / reading 52% proficiency, ranked #16 of 29 in NM (top 55%) — families likely to look elsewhere, expect single-tenant / working-renter base with shorter leases; 75% free/reduced lunch — lower-income household profile, screen leases tightly.
- Market conditions: 177 active listings in the ZIP; 6 comparable units currently listed for rent nearby; rentals lingering (median 44d on market — plan ~5-8 weeks vacancy on turnover, expect pricing pressure); 100% of comp listings sitting > 30 days — soft ceiling on asking rent; lower-income renter base — watch delinquency; 88 units permitted in Chaves County in 2024 (0 in 5+ unit buildings).
- This rent runs 43% of the median local income ($42k/yr) — at the standard rent-burdened threshold; future hikes will face affordability resistance.
Forward outlook
- Local home prices are declining (-3.0%/yr); year-one equity from $726 of loan paydown is wiped out by about $3k of value loss. Plan a longer hold.
- At projected returns (-3.0% appreciation + 3.0% rent growth), your $29k cash investment doubles in ~6 years — after that, you're playing with house money.
Negotiation context
- It's been on market 22 days — a 2% lower offer ($103k) is reasonable based on typical stale-listing flexibility.
- 2 sale attempts since 5y ago with the ask held roughly flat each time — persistent listings suggest the price (not the market) is what's stuck; bring a comps-based counter.
Risks & watch-outs
- Climate carrying-cost: major wildfire risk; extreme-heat days projected 7→20/yr by 2055 (HVAC capex compounding) — expect insurance premiums to compound above CPI over the hold.
Questions for the listing agent
- Is there a deadline driving the sale (1031 exchange, divorce, estate, relocation)? That informs how much negotiation room exists.
- Schools are F-rated, which usually means shorter tenancies and higher turnover. Who's the typical renter profile here, and what's been the actual vacancy rate?
- Crime grade is F in this area — have there been break-ins, vandalism, or insurance claims at this property in the last 3 years? What carrier currently insures it and at what premium?
- What's the average days-on-market for RENTAL listings here right now (not sales)? A rising rental-DOM trend means longer vacancies and softer asking-rent achievability than the comps imply.
- What's the recent tenant-quality profile in this submarket — average credit score on applications, eviction rate, late-payment / NSF rate, and stable-employment percentage? A property-management company in the area should have these aggregated.
- How much new for-sale + rental construction is in the pipeline within 1–3 miles? Heavy new supply typically softens prices + rents 12–24 months out; constrained supply supports both.
Investment metrics
- 1% rule
- 1.44% ✓
- Cap rate
- 11.95%
- Cash-on-cash
- 20.20%
- DSCR
- 1.90
- GRM
- 5.8
CMA / ARV
No comps found within radius.
Projected returns pro-forma
-3.0% appreciation · 3.0% rent growth · sell at horizon
- IRR
- 12.4%
- Equity multiple
- 1.49×
- Total profit
- $14,520
- Equity at exit
- $15,656
- IRR
- 21.3%
- Equity multiple
- 2.81×
- Total profit
- $53,274
- Equity at exit
- $9,078
Cash invested: $29,400 (down + closing). Projections, not guarantees.
Landlord ↔ Tenant lean methodology
- Overall (STATE)
- 55 Moderately Landlord-Leaning
- State New Mexico
- 55 Moderately Landlord-Leaning · D+3
- County
- — inherits STATE
- City
- — inherits STATE
ZIP-level market 88203
- Home prices YoY
- -34.1%
- Active inventory
- 177
- Price-to-rent
- 5.8×
Monthly cashflow live
- Estimated rent
- $1,517 high interval (Pro) →
- Mortgage (P&I)
- −$551
- Tax from tax record
- −$109 /mo · $1,309/yr
- Insurance
- −$44
- HOA
- −$0
- Vacancy / Maint / Mgmt
- −$319
- Net cashflow
- $495
Break-even live
UW: 25.0% down · 7.5% · 30yr · 1.5% tax · 5.0% vac · 8.0% maint · 8.0% mgmt
Financing live
Cash to close
- Down payment
- $26,250
- Closing costs
- $3,150
- Reserves months
- —
- Total cash needed
- —
Loan-product check · same deal, 3 products live
Conventional
25% down · 7.5% · 30yr
- Down + closing
- —
- Monthly P&I
- —
- Monthly cashflow
- —
- DSCR
- —
- Eligible?
- —
Personal DTI + credit; lowest rate.
DSCR
20% down · 8.5% · 30yr
- Down + closing
- —
- Monthly P&I
- —
- Monthly cashflow
- —
- DSCR
- —
- Eligible?
- —
No personal income docs; deal must DSCR.
Hard money
10% down · 12.0% · 12mo
- Down + closing
- —
- Monthly P&I
- —
- Monthly cashflow
- —
- DSCR
- —
- Eligible?
- —
Short-term bridge; refi at stabilization.
Rent comps 6 comps
| Address | Beds | Baths | Sqft | Rent | $/sqft | DOM | Units | Dist |
|---|---|---|---|---|---|---|---|---|
| 1014 Plaza del Sol Roswell, NM | 2.0 | 2.0 | 1150 | $1,275 | $1.11 | 44d | 1 | 0.49mi |
| 1049 W Poe St Roswell, NM | 2.0 | 1.5 | 1413 | $1,200 | $0.85 | 44d | 1 | 1.01mi |
| 613 S Hemlock Ave Roswell, NM | 3.0 | 1.0 | 1078 | $1,150 | $1.07 | 44d | 1 | 1.09mi |
| 1915 S Pennsylvania Ave Roswell, NM | 4.0 | 2.0 | 1757 | $1,800 | $1.02 | 44d | 1 | 1.18mi |
| 2614 Palomar Pl Roswell, NM | 3.0 | 2.0 | 1278 | $1,400 | $1.10 | 44d | 1 | 1.39mi |
| 2703 S Onyx Dr Roswell, NM | 3.0 | 2.0 | 1400 | $1,900 | $1.36 | 44d | 1 | 1.46mi |
Listing history 5 events
-
2026-04-22status Pending
-
2026-03-31$105,000 Active
-
2021-02-19soldstatus 505-char remark
Show marketing remark (505 chars)
This Beautiful Corner lot Brick Home! Won't last long! near shopping, school, and restaurants and located in Southwest neighborhood, at 1,635 sq. ft. has 3 bedrooms, 2 baths that have been recently remodeled, Living room, Family room with fireplace, Kitchen/Dining room combo with a huge pantry room, common area in front with privacy gate, covered patio in fenced in backyard and storage shed, per owner, new roof and HVAC unit in 2017, new fixtures, carpet and fans thru-out, and so much more! Must see!
-
2021-02-19soldstatus
Show marketing remark (505 chars)
This Beautiful Corner lot Brick Home! Won't last long! near shopping, school, and restaurants and located in Southwest neighborhood, at 1,635 sq. ft. has 3 bedrooms, 2 baths that have been recently remodeled, Living room, Family room with fireplace, Kitchen/Dining room combo with a huge pantry room, common area in front with privacy gate, covered patio in fenced in backyard and storage shed, per owner, new roof and HVAC unit in 2017, new fixtures, carpet and fans thru-out, and so much more! Must see!
-
2021-01-01$159,900 505-char remark
Show marketing remark (505 chars)
This Beautiful Corner lot Brick Home! Won't last long! near shopping, school, and restaurants and located in Southwest neighborhood, at 1,635 sq. ft. has 3 bedrooms, 2 baths that have been recently remodeled, Living room, Family room with fireplace, Kitchen/Dining room combo with a huge pantry room, common area in front with privacy gate, covered patio in fenced in backyard and storage shed, per owner, new roof and HVAC unit in 2017, new fixtures, carpet and fans thru-out, and so much more! Must see!
ⓘ Source: listings_history table (triggers on properties + properties_extension) + one-shot
backfill from property_details.listing_events for pre-trigger history.
Tax reassessment forecast NM · Resets to sale price
- Current annual tax
- $1,309 · $109/mo
- Projected year-2 tax
- $1,309 · $109/mo
- Expected delta
- $0/yr ($0/mo · 0.0%)
ⓘ Screening estimate from a state-policy table — verify with the county assessor before closing.
Climate risk First Street
- Flood 1/10 Low FEMA zone X (shaded) · 0% chance over 30 yrs
- Wildfire 6/10 Major
- Heat 5/10 Major 7 d/yr ≥99°F today · 20 d/yr by 30 yrs out
- Wind 2/10 Low
- Air quality 1/10 Low 0 unhealthy d/yr today · 0 by 30 yrs out
Nearby sold comps map
Loading sold comps map…
Walkable amenities ~0.75 mi
Loading nearby amenities…
Taxation est. · year 1
- Rental income
- $18,204
- − Mortgage interest
- −$5,882
- − Property taxes
- −$1,309
- − Insurance
- −$525
- − Repairs & maintenance
- −$1,456
- − Management
- −$1,456
- − Depreciation
- −$3,055
- Taxable income
- $4,521
- Est. tax owed @ 24.0%
- −$1,085
- After-tax cash flow
- $4,855/yr
For passive investors: Depreciation is non-cash, so a rental often shows a tax loss while cash-flowing — sheltering income. Rental losses are passive: they offset passive income freely, and up to $25,000/yr can offset ordinary (W-2) income if you actively participate and your MAGI is under $100k (phasing out to $0 by $150k); unused losses carry forward. On sale, claimed depreciation is recaptured at up to 25%, and gains may owe capital-gains tax (a 1031 exchange can defer both). Figures are a year-1 estimate at your 24.0% rate — not tax advice; consult a CPA.
Schools (NCES district)
- District
- Roswell Independent Schools
- NCES district ID
- 3502250
- Math proficiency
- 11% ▼ -9.00%
- Reading proficiency
- 52% ▲ 23.00%
- Median HH income
- $38,848
- Composite
- 26.21/100
- National rank
- #7262
- State rank
- #16 of 29 in NM
Livability — Roswell
- Score
- 75/100
- State rank
- #8
- US rank
- #4339
Category grades
Schools grade is shown separately in the Schools card above.
Census & demographics
- Census place
- Roswell, NM
- County
- Chaves County · 56,277 people
- City population
- 56,277
- Metro
- Roswell, NM
- Population (ZIP)
- 28,753
- Household income
- $42,207
- Rent vs Own
- Severe rent burden
- 995.0
Population outlook (Chaves County) Hauer SSP2
- Today (2025)
- 66,122 people
- By 2030
- 66,351 · +0.3%
- By 2040
- 66,818 · +1.1%
- By 2050
- 66,928 · +1.2%
- By 2075
- 65,474 · -1.0%
- By 2100
- 58,943 · -10.9%
Race, ethnicity, and origin ACS 2023
- Neighborhood character
- Predominantly Hispanic (65%)
- Race & ethnicity
- Hispanic / Latino 65% White 31% Two or more races 22% Black 2% Native American 1%
- Hispanic origin (detail)
- Mexican 58%
- Common ancestry
- Slovak 1% Serbian 1% Lithuanian 1%
- Foreign-born
- 12% · Canada
- Languages at home
- 62% English-only · Spanish 38%
Political lean MEDSL · Chaves
- 2024 margin
- Solid R (+44.8) · D 26.8% · R 71.6% · Other 1.6%
- 2008→2024 swing
- -20.2pp toward R · 2008: -24.7pp · 2024: -44.8pp
- All cycles
- 2024: R+44.8 2020: R+41.3 2016: R+36.4 2012: R+32.4 2008: R+24.7
Not yet ingested
- Civics
- —
Market trends
- HPI YoY
- ▼ -78.30%
- Current HPI
- 151.1401
- Rent YoY
- —
- Metro
- Roswell, NM
- State GDP YoY
- —
- F500 in state
- 0
Price history
-34.3% since first listed5 events — show timeline
- 2026-04-22 Pending — NMMLS
- 2026-03-31 Listed $105,000 NMMLS
- 2021-02-19 Sold (Public Records) — Public Records
- 2021-02-19 Sold (MLS) — NMMLS
- 2021-01-01 Listed $159,900 NMMLS
Property tax history
+3.1%/yrLatest (2025): $1,309 · -0.9% YoY. Source: county tax records.
Cash-flow waterfall
monthlySold comps — $/sqft
last 12 mo · ≤1 miLoading sold comps…