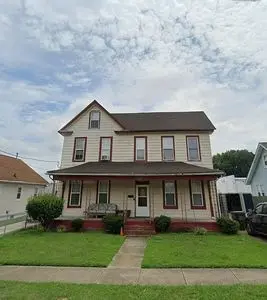
1424 26th St · Newport News, VA
Flood risk 9/10 · Severe
- FEMA flood zone
- AE
- Chance of flooding over 30 yrs
- 0.99%
- Est. flood insurance / yr
- $1,737 – $8,500
Fire risk 1/10 · Minimal
- Est. fire insurance / yr
- $666 – $1,236
Heat risk 9/10 · Severe
- Hot days now (above 106°F)
- 7 days/yr
- Hot days in 30 yrs
- 16 days/yr
Wind risk 8/10 · Major
- Chance of severe wind over 30 yrs
- 80.0%
Air-quality risk 2/10 · Minimal
- Unhealthy air days now
- 1 days/yr
- Unhealthy air days in 30 yrs
- 1 days/yr
Risk factors via First Street. Map © Google.
Why this score? — see what drove the B+ grade
The composite is a weighted blend of 9 inputs, each scored 0–100. Each bar is that input's sub-score; the figure is the points it added to the 100-point composite (weight × sub-score).
- Cash flow +27.8/30.0
- ARV discount +14.3/15.0
- DSCR +9.8/10.0
- 1% rule +7.4/10.0
- Appreciation +4.6/10.0
- Schools +3.8/10.0
- Livability +3.8/5.0
- Rent growth +3.2/5.0
- Condition / age +2.5/5.0
$165,000
🖨 Deal sheet (PDF) 📄 Offer letter ✓ Due diligence
Listing remarks
This is a great house centrally located in a really nice neighborhood. The house boasts mostly hardwood floors throughout. The bedrooms are all nicely sized. The house has 2 dens, each having a fireplace available for those cozy winters nights. There& apos; s a bonus 3rd floor that has the flexibility to serve as a play area for the kids, or as the man (or woman) cave you always wanted. The roof was recently replaced with architectural shingles. And, for your outdoor entertainment, the backyard is huge and fenced in and is ready to provide fun for the kids or cookouts. Come see your beautiful home and meet your new friendly neighbors. Make your offer now before it& apos; s too late!
Key facts
- 2 dens
- Bonus play area
- 3rd floor
Tags
Property features AI
Exterior
- Home design: Built in 1935; Single-family property
- Construction: Construction date: 1935
- Exterior features: Located in the South Newport News subdivision
Neighborhood map
What this means for you Summary
Snapshot
- This is a 3-bed/1.0-bath single-family listed at $165k.
Deal economics
- At list price, monthly cash flow is $75 ($900/yr) — positive.
- The deal already cash-flows at list — no discount required.
- Meets the 1% rule at list price ($2k rent vs $165k).
- Recommended offer: $160k (3.0% below list) — sets the bar for market timing.
- Cap rate 9.9% vs local median 4.2% in Newport News — top-decile yield for the area; either an underpriced asset or a hidden risk that comps aren't pricing in. Stress-test before assuming the spread holds.
Location & tenants
- Location reads 75/100 on livability (#123 in VA, #4,018 nationally) — a middle-class / working-renter tenant base. Strengths: health & safety A+, cost of living A, housing A; Watch: crime F, commute F.
- Newport News City Public School District (urban): math 34% / reading 54% proficiency, ranked #112 of 131 in VA (top 86%) — families likely to look elsewhere, expect single-tenant / working-renter base with shorter leases.
- Zoned schools: Discovery Stem Academy (math 14% / reading 35%, grade F, #1,051 of 1,108 statewide, top 96%, 543 students, 91% FRL); Huntington Middle (math 2% / reading 27%, grade F, #341 of 342 statewide, top 100%, 411 students, 87% FRL); Heritage High (math 49% / reading 67%, grade C, #262 of 319 statewide, top 82%, 1,111 students, 85% FRL) — zoned schools average 88% FRL vs 55% district-wide (33 pts higher); higher-poverty schools than district average — tighter screening recommended.
- Market conditions: Rents rising (+2.9%/yr); 130 active listings in the ZIP; 18 comparable units currently listed for rent nearby; rentals at typical pace (median 25d on market — plan ~3-4 weeks tenant-placement turnaround); lower-income renter base — watch delinquency; 522 units permitted in Newport News city in 2024 (458 in 5+ unit buildings).
- At $2,052/mo this rent would consume 58% of the median local household income ($42k/yr) (locally 2008% of renters already pay >50% of income on rent) — very limited rent-growth headroom before tenants either downsize or default.
Forward outlook
- Local home prices are declining (-0.8%/yr); year-one equity from $1k of loan paydown is wiped out by about $1k of value loss. Plan a longer hold.
- Newport News County population projected to shrink 8% by 2050 — rents likely to lag national; underwrite the cash flow, not the appreciation.
Negotiation context
- It's been on market 40 days — a 3% lower offer ($160k) is reasonable based on typical stale-listing flexibility.
Risks & watch-outs
- Watch-outs: flood insurance adds $427/mo; built in 1935 — expect roof / HVAC / electrical / plumbing capex.
- Climate carrying-cost: in FEMA flood zone AE (mandatory federal flood insurance); severe wind risk, 80% chance of damaging wind over 30y; extreme-heat days projected 7→16/yr by 2055 (HVAC capex compounding) — expect insurance premiums to compound above CPI over the hold.
Questions for the listing agent
- It's been on market 40 days. Have you received any prior offers? Is the seller open to a 3% concession, seller financing, or rate buy-down credit?
- Built in 1935 — when were the roof, HVAC, electrical panel, plumbing, and water heater last replaced?
- What's the actual annual flood-insurance premium (NFIP or private), and is the property in a SFHA with mandatory coverage?
- Is there a deadline driving the sale (1031 exchange, divorce, estate, relocation)? That informs how much negotiation room exists.
- Schools are B-rated — typically a magnet for longer-tenancy family renters. What's the average tenant stay here, and is there a school-zone premium baked into asking?
- Crime grade is F in this area — have there been break-ins, vandalism, or insurance claims at this property in the last 3 years? What carrier currently insures it and at what premium?
- What's the average days-on-market for RENTAL listings here right now (not sales)? A rising rental-DOM trend means longer vacancies and softer asking-rent achievability than the comps imply.
- What's the recent tenant-quality profile in this submarket — average credit score on applications, eviction rate, late-payment / NSF rate, and stable-employment percentage? A property-management company in the area should have these aggregated.
- How much new for-sale + rental construction is in the pipeline within 1–3 miles? Heavy new supply typically softens prices + rents 12–24 months out; constrained supply supports both.
Investment metrics
- 1% rule
- 1.24% ✓
- Cap rate
- 9.94%
- Cash-on-cash
- 13.03%
- DSCR
- 1.58
- GRM
- 6.7
CMA / ARV
- ARV (on-the-fly)
- $194,583
- Comps found
- 12
Show comp detail 12 sales within ~0.75 mi
| Address | Dist | Beds/Ba | Sqft | Sold | Price | $/sf | Match |
|---|---|---|---|---|---|---|---|
| 1329 22nd St | 0.23mi | 3/2.0 | 1,759 (+0%) | 3mo | $120,000 | $68 | 82 |
| 2501 Parish Ave | 0.08mi | 4/— (+1) | 1,507 (-14%) | 3mo | $55,000 | $36 | 65 |
| 227 Blair Ave | 0.45mi | 4/2.5 (+1) | 1,758 (+0%) | 3mo | $195,000 | $111 | 65 |
| 1236 27th St | 0.31mi | 3/2.0 | 1,550 (-12%) | 2mo | $245,000 | $158 | 61 |
| 1145 24th St | 0.46mi | 3/2.0 | 1,640 (-6%) | 4mo | $195,000 | $119 | 61 |
| 2011 Chestnut Ave | 0.51mi | 4/2.0 (+1) | 1,687 (-4%) | 1mo | $165,000 | $98 | 60 |
| 1220 29th St | 0.38mi | 3/1.0 | 1,509 (-14%) | 2mo | $121,000 | $80 | 58 |
| 1016 31st St | 0.71mi | 4/2.5 (+1) | 1,768 (+1%) | 1mo | $282,000 | $160 | 54 |
| 1121 Hampton Ave | 0.55mi | 4/1.5 (+1) | 1,877 (+7%) | 4mo | $110,000 | $59 | 52 |
| 1034 26th St | 0.62mi | 4/2.0 (+1) | 1,579 (-10%) | 0mo | $139,000 | $88 | 45 |
| 1038 24th St | 0.62mi | 4/2.5 (+1) | 1,950 (+11%) | 0mo | $317,200 | $163 | 41 |
| 1809 Roanoke Ave | 0.71mi | 4/2.0 (+1) | 1,500 (-14%) | 3mo | $268,000 | $179 | 31 |
Match score weights: distance 35% · size 25% · config 20% · recency 20%. Top-matched comps best support the ARV.
Projected returns pro-forma
-0.84% appreciation · 2.91% rent growth · sell at horizon
- IRR
- -3.1%
- Equity multiple
- 0.86×
- Total profit
- $-6,359
- Equity at exit
- $41,096
- IRR
- 3.5%
- Equity multiple
- 1.34×
- Total profit
- $15,672
- Equity at exit
- $44,244
Cash invested: $46,200 (down + closing). Projections, not guarantees.
Landlord ↔ Tenant lean methodology
- Overall (STATE)
- 55 Moderately Landlord-Leaning
- State Virginia
- 55 Moderately Landlord-Leaning · D+2
- County
- — inherits STATE
- City
- — inherits STATE
ZIP-level market 23607
- Home prices YoY
- -0.3%
- Rents YoY
- 2.9%
- Active inventory
- 130
- Price-to-rent
- 6.7×
Monthly cashflow live
- Estimated rent
- $2,052 high interval (Pro) →
- Mortgage (P&I)
- −$865
- Tax from tax record
- −$186 /mo · $2,226/yr
- Insurance
- −$69
- Flood insurance flood zone
- −$427 /mo · $5,118/yr
- HOA
- −$0
- Vacancy / Maint / Mgmt
- −$431
- Net cashflow
- $75
Break-even live
Sensitivity live
| Price | -10% $168 | -5% $122 | +0% $75 | +5% $28 | +10% $-18 |
|---|---|---|---|---|---|
| Rent | -10% $-87 | -5% $-6 | +0% $75 | +5% $156 | +10% $237 |
| Rate | -1.0pp $158 | -0.5pp $117 | base $75 | +0.5pp $32 | +1.0pp $-11 |
UW: 25.0% down · 7.5% · 30yr · 1.5% tax · 5.0% vac · 8.0% maint · 8.0% mgmt
Financing live
Cash to close
- Down payment
- $41,250
- Closing costs
- $4,950
- Reserves months
- —
- Total cash needed
- —
Loan-product check · same deal, 3 products live
Conventional
25% down · 7.5% · 30yr
- Down + closing
- —
- Monthly P&I
- —
- Monthly cashflow
- —
- DSCR
- —
- Eligible?
- —
Personal DTI + credit; lowest rate.
DSCR
20% down · 8.5% · 30yr
- Down + closing
- —
- Monthly P&I
- —
- Monthly cashflow
- —
- DSCR
- —
- Eligible?
- —
No personal income docs; deal must DSCR.
Hard money
10% down · 12.0% · 12mo
- Down + closing
- —
- Monthly P&I
- —
- Monthly cashflow
- —
- DSCR
- —
- Eligible?
- —
Short-term bridge; refi at stabilization.
Rent comps 18 comps
| Address | Beds | Baths | Sqft | Rent | $/sqft | DOM | Units | Dist |
|---|---|---|---|---|---|---|---|---|
| 1242 26th St Newport News, VA | 3.0 | 4.0 | 1704 | $2,400 | $1.41 | 4d | 1 | 0.29mi |
| 321 Pine Ave Newport News, VA | 3.0 | 2.5 | 1349 | $1,990 | $1.48 | 25d | 1 | 0.31mi |
| 40 Buxton Ave Unit C Newport News, VA | 3.0 | 1.0 | 1750 | $1,795 | $1.03 | 45d | 1 | 0.42mi |
| 1227 31st St Newport News, VA | 3.0 | 2.0 | 1500 | $2,495 | $1.66 | 3d | 1 | 0.44mi |
| 1216 21st St Newport News, VA | 3.0 | 3.5 | 1446 | $1,700 | $1.18 | 25d | 1 | 0.45mi |
| 1110 21st St Newport News, VA | 4.0 | 2.0 | 1613 | $1,850 | $1.15 | 45d | 1 | 0.60mi |
| 1124 33rd St Newport News, VA | 3.0 | 1.5 | 1386 | $1,600 | $1.15 | 25d | 1 | 0.62mi |
| 1034 26th St Newport News, VA | 4.0 | 2.0 | 1579 | $1,600 | $1.01 | 45d | 1 | 0.63mi |
| 1035 23rd St Newport News, VA | 3.0 | 2.0 | 1378 | $1,600 | $1.16 | 45d | 1 | 0.63mi |
| 327 Locust Ave Hampton, VA | 4.0 | 2.0 | 1500 | $2,000 | $1.33 | 45d | 1 | 0.64mi |
| 1020 23rd St Newport News, VA | 4.0 | 3.0 | 1710 | $2,195 | $1.28 | 45d | 1 | 0.67mi |
| 729 Chesapeake Ave Hampton, VA | 4.0 | 3.0 | 2239 | $2,975 | $1.33 | 4d | 1 | 0.72mi |
| 2104 Marshall Ave Newport News, VA | 4.0 | 2.0 | 1568 | $2,200 | $1.40 | 17d | 1 | 0.99mi |
| 2102 Marshall Ave Newport News, VA | 4.0 | 2.0 | 1780 | $1,500 | $0.84 | 45d | 1 | 0.99mi |
| 927 11th St Newport News, VA | 4.0 | 4.0 | 2500 | $1,200 | $0.48 | 9d | 1 | 1.05mi |
| 707 Pennsylvania Ave Hampton, VA | 4.0 | 2.5 | 2134 | $2,800 | $1.31 | 25d | 1 | 1.34mi |
| 130 Chancellor Rd Hampton, VA | 4.0 | 1.0 | 2000 | $1,995 | $1.00 | 5d | 1 | 1.36mi |
| 100 Chesterfield Rd Hampton, VA | 3.0 | 1.5 | 1742 | $2,200 | $1.26 | 5d | 1 | 1.49mi |
Listing history 16 events
-
2026-06-21days on market $165,000 Active 40 DOM
-
2026-06-18days on market $165,000 Active 37 DOM
-
2026-06-17days on market $165,000 Active 36 DOM
-
2026-06-16days on market $165,000 Active 35 DOM
-
2026-06-15days on market $165,000 Active 34 DOM
-
2026-06-09days on market $165,000 Active 28 DOM
-
2026-06-08days on market $165,000 Active 27 DOM
-
2026-06-07days on market $165,000 Active 26 DOM
-
2026-06-03days on market $165,000 Active 22 DOM
-
2026-06-02days on market $165,000 Active 21 DOM
-
2026-06-01days on market $165,000 Active 20 DOM
-
2026-05-31days on market $165,000 Active 19 DOM
-
2026-05-12$165,000 Active 677-char remark
-
2006-08-02soldstatus $225,000
-
2005-08-03soldstatus $60,000
-
1995-05-15soldstatus $43,400
ⓘ Source: listings_history table (triggers on properties + properties_extension) + one-shot
backfill from property_details.listing_events for pre-trigger history.
Tax reassessment forecast VA · Resets to sale price
- Current annual tax
- $2,226 · $186/mo
- Projected year-2 tax
- $2,226 · $186/mo
- Expected delta
- $0/yr ($0/mo · 0.0%)
ⓘ Screening estimate from a state-policy table — verify with the county assessor before closing.
Climate risk First Street
- Flood 9/10 Extreme FEMA zone AE · 99% chance over 30 yrs
- Wildfire 1/10 Low
- Heat 9/10 Extreme 7 d/yr ≥106°F today · 16 d/yr by 30 yrs out
- Wind 8/10 Severe 80% chance of damaging wind over 30 yrs
- Air quality 2/10 Low 1 unhealthy d/yr today · 1 by 30 yrs out
Nearby sold comps map
Loading sold comps map…
Walkable amenities ~0.75 mi
Loading nearby amenities…
Taxation est. · year 1
- Rental income
- $24,624
- − Mortgage interest
- −$9,243
- − Property taxes
- −$2,226
- − Insurance
- −$5,944
- − Repairs & maintenance
- −$1,970
- − Management
- −$1,970
- − Depreciation
- −$4,800
- Taxable loss
- −$1,528
- Est. tax savings @ 24.0%
- +$367
- After-tax cash flow
- $1,267/yr
For passive investors: Depreciation is non-cash, so a rental often shows a tax loss while cash-flowing — sheltering income. Rental losses are passive: they offset passive income freely, and up to $25,000/yr can offset ordinary (W-2) income if you actively participate and your MAGI is under $100k (phasing out to $0 by $150k); unused losses carry forward. On sale, claimed depreciation is recaptured at up to 25%, and gains may owe capital-gains tax (a 1031 exchange can defer both). Figures are a year-1 estimate at your 24.0% rate — not tax advice; consult a CPA.
Schools (NCES district)
- District
- Newport News City Public School District
- NCES district ID
- 5102640
- Math proficiency
- 34% ▼ -37.00%
- Reading proficiency
- 54% ▼ -10.00%
- Median HH income
- $49,644
- Composite
- 37.7/100
- National rank
- #4360
- State rank
- #112 of 131 in VA
Livability — Newport News
- Score
- 75/100
- State rank
- #123
- US rank
- #4018
Category grades
Schools grade is shown separately in the Schools card above.
Census & demographics
- Census place
- Newport News, VA
- County
- Newport News City · 178,950 people
- City population
- 178,950
- Metro
- Virginia Beach-Norfolk-Newport News, VA-NC
- Population (ZIP)
- 23,096
- Household income
- $42,334
- Rent vs Own
- Severe rent burden
- 2008.0
Population outlook (Newport News County) Hauer SSP2
- Today (2025)
- 181,076 people
- By 2030
- 179,683 · -0.8%
- By 2040
- 174,649 · -3.5%
- By 2050
- 167,407 · -7.5%
- By 2075
- 147,597 · -18.5%
- By 2100
- 122,144 · -32.5%
Race, ethnicity, and origin ACS 2023
- Neighborhood character
- Predominantly Black (75%)
- Race & ethnicity
- Black 75% White 13% Two or more races 7% Hispanic / Latino 6% Asian 1%
- Hispanic origin (detail)
- Mexican 1% Puerto Rican 2%
- Foreign-born
- 3% · Canada
- Languages at home
- 96% English-only · Spanish 3%
Political lean MEDSL · Newport News
- 2024 margin
- Strong D (+28.8) · D 63.7% · R 34.9% · Other 1.4%
- 2008→2024 swing
- +0.1pp no change · 2008: 28.7pp · 2024: 28.8pp
- All cycles
- 2024: D+28.8 2020: D+32.9 2016: D+25.4 2012: D+30.0 2008: D+28.7
Not yet ingested
- Civics
- —
Market trends
- HPI YoY
- ▼ -0.84%
- Current HPI
- 312.4039
- Rent YoY
- ▲ 2.91%
- Metro
- Virginia Beach-Norfolk-Newport News, VA-NC
- State GDP YoY
- ▲ 2.40%
- F500 in state
- 50
Industry mix (Fortune 500 HQ in VA)
| Industry | F500 HQs | Revenue |
|---|---|---|
| Aerospace / Defense | 4 | $236B |
|
||
| Technology / Defense | 3 | $32B |
|
||
| Financial Services | 2 | $176B |
|
||
| Utilities | 2 | $27B |
|
||
| Insurance | 2 | $25B |
|
||
| Technology | 2 | $15B |
|
||
Price history
+280.2% since first listed4 events — show timeline
- 2026-05-12 Listed $165,000 FSBO.com
- 2006-08-02 Sold (Public Records) $225,000 Public Records
- 2005-08-03 Sold (Public Records) $60,000 Public Records
- 1995-05-15 Sold (Public Records) $43,400 Public Records
Property tax history
+4.6%/yrLatest (2026): $2,226 · +15.0% YoY. Source: county tax records.
Cash-flow waterfall
monthlySold comps — $/sqft
last 12 mo · ≤1 miLoading sold comps…