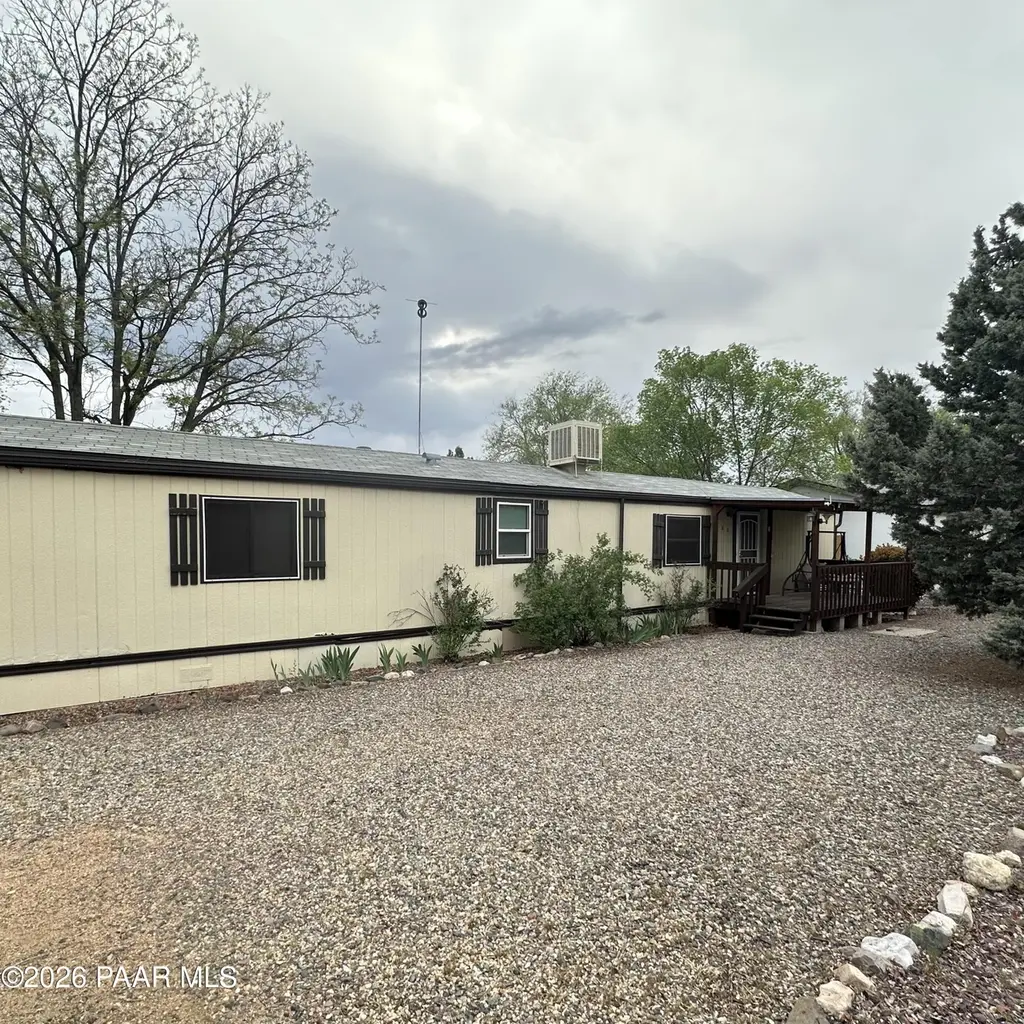
6200 N Wildhorse Dr · Prescott Valley, AZ
Flood risk 1/10 · Minimal
- FEMA flood zone
- X (unshaded)
- Chance of flooding over 30 yrs
- 0.0%
- Est. flood insurance / yr
- $507 – $1,088
Fire risk 5/10 · Moderate
- Est. fire insurance / yr
- $610 – $1,132
Heat risk 4/10 · Minor
- Hot days now (above 94°F)
- 6 days/yr
- Hot days in 30 yrs
- 16 days/yr
Wind risk 1/10 · Minimal
- Chance of severe wind over 30 yrs
- —
Air-quality risk 1/10 · Minimal
- Unhealthy air days now
- 0 days/yr
- Unhealthy air days in 30 yrs
- 0 days/yr
Risk factors via First Street. Map © Google.
Why this score? — see what drove the C- grade
The composite is a weighted blend of 9 inputs, each scored 0–100. Each bar is that input's sub-score; the figure is the points it added to the 100-point composite (weight × sub-score).
- Cash flow +17.8/30.0
- ARV discount +15.0/15.0
- DSCR +5.6/10.0
- 1% rule +3.5/10.0
- Livability +3.1/5.0
- Schools +2.9/10.0
- Rent growth +2.7/5.0
- Condition / age +2.5/5.0
- Appreciation +0.0/10.0
$199,000
🖨 Deal sheet 📄 Offer letter ✓ Due diligence
Listing remarks MLS
Cute Starter home situated on a great fenced lot! 2 bedrooms 2 baths with 3 sheds in backyard and plenty of room. Steel Carport installed 2013 , with a Permit Disclosures: Property is NOT located in a FEMA Special Flood Hazard Area but is listed as a low to moderate flood risk. TV Stays. Most furniture to be removed before close of escrow.***More pictures to come!***
Key facts
- Sheds in backyard
- Fenced lot
- 8,712 sq ft lot
Tags
Neighborhood map
What this means for you Summary
Snapshot
- This is a 2-bed/2.0-bath manufactured listed at $199k.
Deal economics
- At list price, monthly cash flow is $164 ($2k/yr) — positive.
- The deal already cash-flows at list — no discount required.
- To meet the 1% rule (rent ≥ 1% of price), the offer needs to be $169k (15.2% below list).
- Recommended offer: $169k (15.2% below list) — sets the bar for 1% rule.
- Cap rate 7.3% vs local median 3.2% in Prescott Valley — top-decile yield for the area; either an underpriced asset or a hidden risk that comps aren't pricing in. Stress-test before assuming the spread holds.
Location & tenants
- Location reads 62/100 on livability (#126 in AZ) — a middle-class / working-renter tenant base. Strengths: housing A+, crime A-; Watch: schools C-, amenities F, commute F.
- Humboldt Unified District (4469) (suburban): math 31% / reading 37% proficiency, ranked #94 of 249 in AZ (top 38%) — families likely to look elsewhere, expect single-tenant / working-renter base with shorter leases.
- Market conditions: Rents flat; 447 active listings in the ZIP; 9 comparable units currently listed for rent nearby; rentals at typical pace (median 21d on market — plan ~3-4 weeks tenant-placement turnaround); 2,062 units permitted in Yavapai County in 2024 (98 in 5+ unit buildings).
Forward outlook
- Local home prices are declining (-3.0%/yr); year-one equity from $1k of loan paydown is wiped out by about $6k of value loss. Plan a longer hold.
- Yavapai County population projected at +10% by 2050 — modest demand growth; plan on rents tracking national, not racing it.
Negotiation context
- It's been on market 52 days — a 3% lower offer ($193k) is reasonable based on typical stale-listing flexibility.
- 2 sale attempts with the ask held roughly flat each time — persistent listings suggest the price (not the market) is what's stuck; bring a comps-based counter.
- Current owner paid $29k; list at $199k implies a 586% gain — meaningful room to come down on a strong offer.
Risks & watch-outs
- Climate carrying-cost: moderate wildfire risk — expect insurance premiums to compound above CPI over the hold.
Questions for the listing agent
- It's been on market 52 days. Have you received any prior offers? Is the seller open to a 15% concession, seller financing, or rate buy-down credit?
- Is there a deadline driving the sale (1031 exchange, divorce, estate, relocation)? That informs how much negotiation room exists.
- What's the average days-on-market for RENTAL listings here right now (not sales)? A rising rental-DOM trend means longer vacancies and softer asking-rent achievability than the comps imply.
- What's the recent tenant-quality profile in this submarket — average credit score on applications, eviction rate, late-payment / NSF rate, and stable-employment percentage? A property-management company in the area should have these aggregated.
- How much new for-sale + rental construction is in the pipeline within 1–3 miles? Heavy new supply typically softens prices + rents 12–24 months out; constrained supply supports both.
Investment metrics
- 1% rule
- 0.85% ✗
- Cap rate
- 7.28%
- Cash-on-cash
- 3.53%
- DSCR
- 1.16
- GRM
- 9.8
CMA / ARV
- ARV (median comp)
- $258,200
- List price
- $199,000
- Delta
- -22.93%
- Verdict
- UNDERPRICED
- Comps
- 2 within 1.0 mi
Show comp detail 6 sales within ~0.75 mi
| Address | Dist | Beds/Ba | Sqft | Sold | Price | $/sf | Match |
|---|---|---|---|---|---|---|---|
| 7657 E Horseshoe Ln | 0.20mi | 3/2.0 (+1) | 925 (+0%) | 21mo | $235,000 | $254 | 68 |
| 6260 N Union Dr | 0.11mi | 2/2.0 | 981 (+6%) | 21mo | $260,000 | $265 | 67 |
| 6163 N Wildhorse Dr | 0.06mi | 3/2.0 (+1) | 1,056 (+14%) | 5mo | $232,312 | $220 | 64 |
| 7921 E Supai Dr | 0.32mi | 2/2.0 | 854 (-8%) | 23mo | $241,000 | $282 | 53 |
| 6458 N Warbonnet Dr | 0.25mi | 2/2.0 | 1,056 (+14%) | 15mo | $269,000 | $255 | 52 |
| 7883 E Broken Wagon Way | 0.38mi | 2/2.0 | 1,057 (+14%) | 18mo | $215,000 | $203 | 43 |
Match score weights: distance 35% · size 25% · config 20% · recency 20%. Top-matched comps best support the ARV.
Projected returns pro-forma
-3.0% appreciation · 0.97% rent growth · sell at horizon
- IRR
- -12.8%
- Equity multiple
- 0.55×
- Total profit
- $-25,289
- Equity at exit
- $29,672
- IRR
- -6.8%
- Equity multiple
- 0.60×
- Total profit
- $-22,304
- Equity at exit
- $17,206
Cash invested: $55,720 (down + closing). Projections, not guarantees.
Landlord ↔ Tenant lean methodology
- Overall (STATE)
- 87 Strongly Landlord-Friendly
- State Arizona
- 87 Strongly Landlord-Friendly · R+3
- County
- — inherits STATE
- City
- — inherits STATE
ZIP-level market 86314
- Home prices YoY
- -32.3%
- Rents YoY
- 1.0%
- Active inventory
- 447
- Price-to-rent
- 9.8×
Monthly cashflow live
- Estimated rent
- $1,688 high interval (Pro) →
- Mortgage (P&I)
- −$1,044
- Tax from tax record
- −$43 /mo · $517/yr
- Insurance
- −$83
- HOA
- −$0
- Vacancy / Maint / Mgmt
- −$354
- Net cashflow
- $164
Break-even live
UW: 25.0% down · 7.5% · 30yr · 1.5% tax · 5.0% vac · 8.0% maint · 8.0% mgmt
Financing live
Cash to close
- Down payment
- $49,750
- Closing costs
- $5,970
- Reserves months
- —
- Total cash needed
- —
Loan-product check · same deal, 3 products live
Conventional
25% down · 7.5% · 30yr
- Down + closing
- —
- Monthly P&I
- —
- Monthly cashflow
- —
- DSCR
- —
- Eligible?
- —
Personal DTI + credit; lowest rate.
DSCR
20% down · 8.5% · 30yr
- Down + closing
- —
- Monthly P&I
- —
- Monthly cashflow
- —
- DSCR
- —
- Eligible?
- —
No personal income docs; deal must DSCR.
Hard money
10% down · 12.0% · 12mo
- Down + closing
- —
- Monthly P&I
- —
- Monthly cashflow
- —
- DSCR
- —
- Eligible?
- —
Short-term bridge; refi at stabilization.
Rent comps 9 comps
| Address | Beds | Baths | Sqft | Rent | $/sqft | DOM | Units | Dist |
|---|---|---|---|---|---|---|---|---|
| 7438 E Horseshoe Ln #2 Prescott Valley, AZ | 2.0 | 2.0 | 1100 | $1,999 | $1.82 | 13d | 1 | 0.27mi |
| 6260 N Old McDonald Dr Unit 2 Prescott Valley, AZ | 2.0 | 2.0 | 1053 | $1,550 | $1.47 | 13d | 1 | 0.28mi |
| 7174 E Burro Ln #2 Prescott Valley, AZ | 2.0 | 2.0 | 1050 | $1,599 | $1.52 | 13d | 1 | 0.53mi |
| 7159 E Silverlode Dr Unit A Prescott Valley, AZ | 2.0 | 1.5 | 970 | $1,350 | $1.39 | 43d | 1 | 0.55mi |
| 6068 N Peak Cir Unit A Prescott Valley, AZ | 3.0 | 2.0 | 1000 | $1,900 | $1.90 | 21d | 1 | 0.56mi |
| 7020 E Burro Ln Apt A Prescott Valley, AZ | 2.0 | 2.0 | 1011 | $1,650 | $1.63 | 21d | 1 | 0.65mi |
| 8113 E Long Mesa Dr Unit A Prescott Valley, AZ | 1.0 | 1.0 | 616 | $1,500 | $2.44 | 21d | 1 | 0.66mi |
| 8135 E Ashley Dr Apt A Prescott Valley, AZ | 2.0 | 2.0 | 990 | $1,500 | $1.52 | 43d | 1 | 1.33mi |
| 4786 N Jean Ct Apt 01 Prescott Valley, AZ | 2.0 | 1.0 | 758 | $1,150 | $1.52 | 21d | 1 | 1.45mi |
Listing history 7 events
-
2026-04-21status Active 372-char remark
Show marketing remark (372 chars)
Cute Starter home situated on a great fenced lot! 2 bedrooms 2 baths with 3 sheds in backyard and plenty of room. Steel Carport installed 2013 , with a Permit Disclosures: Property is NOT located in a FEMA Special Flood Hazard Area but is listed as a low to moderate flood risk. TV Stays. Most furniture to be removed before close of escrow.***More pictures to come!***
-
2026-04-03historical Active Under Contract 372-char remark
Show marketing remark (372 chars)
Cute Starter home situated on a great fenced lot! 2 bedrooms 2 baths with 3 sheds in backyard and plenty of room. Steel Carport installed 2013 , with a Permit Disclosures: Property is NOT located in a FEMA Special Flood Hazard Area but is listed as a low to moderate flood risk. TV Stays. Most furniture to be removed before close of escrow.***More pictures to come!***
-
2026-03-31$199,000 Active 372-char remark
Show marketing remark (372 chars)
Cute Starter home situated on a great fenced lot! 2 bedrooms 2 baths with 3 sheds in backyard and plenty of room. Steel Carport installed 2013 , with a Permit Disclosures: Property is NOT located in a FEMA Special Flood Hazard Area but is listed as a low to moderate flood risk. TV Stays. Most furniture to be removed before close of escrow.***More pictures to come!***
-
2012-10-12soldstatus $29,000 350-char remark
Show marketing remark (350 chars)
HUD Home - situated on a great lot! 2 bedrooms 2 baths with 2 sheds in backyard and plenty of room. Disclosures: Property is NOT located in a FEMA Special Flood Hazard Area but is listed as a low to moderate flood risk. Manufactured home.For overbidding and/or escrow repair information, please see attached Overbidding and Escrow Repair MLS addendum
-
2007-05-02soldstatus $84,000
-
2007-05-02soldstatus $84,000
-
2004-01-02soldstatus $50,100
ⓘ Source: listings_history table (triggers on properties + properties_extension) + one-shot
backfill from property_details.listing_events for pre-trigger history.
Tax reassessment forecast AZ · Resets to sale price
- Current annual tax
- $517 · $43/mo
- Projected year-2 tax
- $1,313 · $109/mo
- Expected delta
- +$797/yr (+$66/mo · 154.2%)
ⓘ Screening estimate from a state-policy table — verify with the county assessor before closing.
Climate risk First Street
- Flood 1/10 Low FEMA zone X (unshaded) · 0% chance over 30 yrs
- Wildfire 5/10 Major
- Heat 4/10 Moderate 6 d/yr ≥94°F today · 16 d/yr by 30 yrs out
- Wind 1/10 Low
- Air quality 1/10 Low 0 unhealthy d/yr today · 0 by 30 yrs out
Nearby sold comps map
Loading sold comps map…
Walkable amenities ~0.75 mi
Loading nearby amenities…
Taxation est. · year 1
- Rental income
- $20,255
- − Mortgage interest
- −$11,147
- − Property taxes
- −$517
- − Insurance
- −$995
- − Repairs & maintenance
- −$1,620
- − Management
- −$1,620
- − Depreciation
- −$5,789
- Taxable loss
- −$1,434
- Est. tax savings @ 24.0%
- +$344
- After-tax cash flow
- $2,311/yr
For passive investors: Depreciation is non-cash, so a rental often shows a tax loss while cash-flowing — sheltering income. Rental losses are passive: they offset passive income freely, and up to $25,000/yr can offset ordinary (W-2) income if you actively participate and your MAGI is under $100k (phasing out to $0 by $150k); unused losses carry forward. On sale, claimed depreciation is recaptured at up to 25%, and gains may owe capital-gains tax (a 1031 exchange can defer both). Figures are a year-1 estimate at your 24.0% rate — not tax advice; consult a CPA.
Schools (NCES district)
- District
- Humboldt Unified District (4469)
- NCES district ID
- 0403870
- Math proficiency
- 31% ▼ -13.00%
- Reading proficiency
- 37% ▼ -14.00%
- Median HH income
- $45,326
- Composite
- 29.06/100
- National rank
- #6605
- State rank
- #94 of 249 in AZ
Livability — Prescott Valley
- Score
- 62/100
- State rank
- #126
- US rank
- #16160
Category grades
Schools grade is shown separately in the Schools card above.
Census & demographics
- Census place
- Prescott Valley, AZ
- County
- Yavapai County · 190,406 people
- City population
- 63,155
- Metro
- Prescott Valley-Prescott, AZ
- Population (ZIP)
- 40,317
- Household income
- $69,208
- Rent vs Own
- Severe rent burden
- 1236.0
Population outlook (Yavapai County) Hauer SSP2
- Today (2025)
- 241,389 people
- By 2030
- 249,523 · +3.4%
- By 2040
- 259,966 · +7.7%
- By 2050
- 264,736 · +9.7%
- By 2075
- 269,334 · +11.6%
- By 2100
- 256,505 · +6.3%
Race, ethnicity, and origin ACS 2023
- Neighborhood character
- Predominantly White (71%)
- Race & ethnicity
- White 71% Hispanic / Latino 22% Two or more races 15% Asian 1% Native American 1%
- Hispanic origin (detail)
- Mexican 20%
- Common ancestry
- Slovak 4% Lithuanian 3% Romanian 3%
- Foreign-born
- 8% · Canada
- Languages at home
- 83% English-only · Spanish 15%
Political lean MEDSL · Yavapai
- 2024 margin
- Solid R (+33.9) · D 32.6% · R 66.5%
- 2008→2024 swing
- -9.5pp toward R · 2008: -24.4pp · 2024: -33.9pp
- All cycles
- 2024: R+33.9 2020: R+29.3 2016: R+31.4 2012: R+30.7 2008: R+24.4
Not yet ingested
- Civics
- —
Market trends
- HPI YoY
- ▼ -176.27%
- Current HPI
- 370.04
- Rent YoY
- ▲ 0.97%
- Metro
- Prescott Valley-Prescott, AZ
- State GDP YoY
- ▲ 4.54%
- F500 in state
- 20
Industry mix (Fortune 500 HQ in AZ)
| Industry | F500 HQs | Revenue |
|---|---|---|
| Technology | 2 | $13B |
|
||
| Mining / Metals | 1 | $23B |
|
||
| Environmental Services | 1 | $16B |
|
||
| Metals / Steel | 1 | $14B |
|
||
| Technology Distribution | 1 | $9B |
|
||
| Homebuilding | 1 | $8B |
|
||
Price history
+297.2% since first listed7 events — show timeline
- 2026-04-21 Relisted — PAARMLS as Distributed by MLS Grid
- 2026-04-03 Contingent — PAARMLS as Distributed by MLS Grid
- 2026-03-31 Listed $199,000 PAARMLS as Distributed by MLS Grid
- 2012-10-12 Sold (MLS) $29,000 PAARMLS as Distributed by MLS Grid
- 2007-05-02 Sold (Public Records) $84,000 Public Records
- 2007-05-02 Sold (Public Records) $84,000 Public Records
- 2004-01-02 Sold (Public Records) $50,100 Public Records
Property tax history
+4.2%/yrLatest (2025): $517 · +1.1% YoY. Source: county tax records.
Cash-flow waterfall
monthlySold comps — $/sqft
last 12 mo · ≤1 miLoading sold comps…