5940 21st St N #11 · Lealman, FL
Flood risk 4/10 · Minor
- FEMA flood zone
- X (unshaded)
- Chance of flooding over 30 yrs
- 0.13%
- Est. flood insurance / yr
- $507 – $1,088
Fire risk 1/10 · Minimal
- Est. fire insurance / yr
- $947 – $1,759
Heat risk 10/10 · Severe
- Hot days now (above 106°F)
- 7 days/yr
- Hot days in 30 yrs
- 28 days/yr
Wind risk 10/10 · Severe
- Chance of severe wind over 30 yrs
- 99.0%
Air-quality risk 4/10 · Minor
- Unhealthy air days now
- 4 days/yr
- Unhealthy air days in 30 yrs
- 4 days/yr
Risk factors via First Street. Map © Google.
Why this score? — see what drove the B grade
The composite is a weighted blend of 9 inputs, each scored 0–100. Each bar is that input's sub-score; the figure is the points it added to the 100-point composite (weight × sub-score).
- Cash flow +30.0/30.0
- 1% rule +10.0/10.0
- DSCR +10.0/10.0
- ARV discount +7.5/15.0
- Schools +4.3/10.0
- Livability +4.0/5.0
- Condition / age +2.5/5.0
- Rent growth +2.0/5.0
- Appreciation +0.0/10.0
$79,900
🖨 Deal sheet 📄 Offer letter ✓ Due diligence
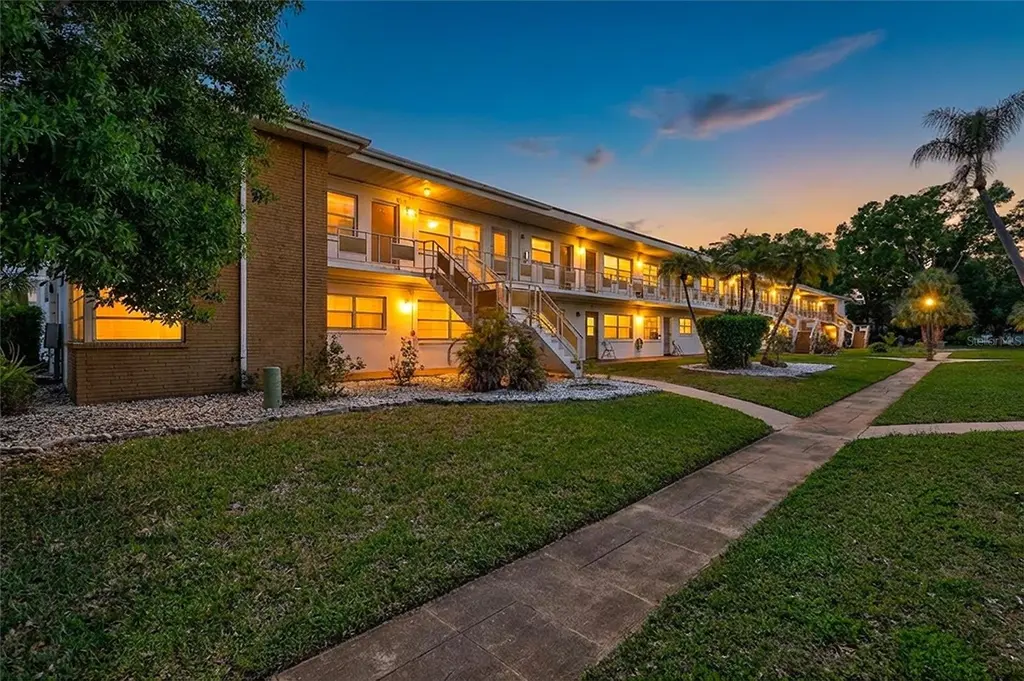
Listing remarks
Enjoy easy Florida living at an affordable price in this well-maintained 2-bedroom, 1-bath condo located in a quiet 55+ community in St. Petersburg far away from any flood zone. With 800 square feet, UPDATED DOUBLE-PANE WINDOWS, laminate flooring, and an HVAC system in good working order, this unit offers a comfortable, low-maintenance option for year-round living or a seasonal Florida retreat. Inside, the layout is practical and inviting, with bright, functional living spaces and two bedrooms that offer flexibility for guests, hobbies, or a home office. The front entry is surrounded by beautiful gardens, creating a welcoming first impression, while carport parking right out back adds every
Key facts
- Laminate flooring
- 30-year metal roof
- Carport parking
Tags
Property features AI
Finance
- Other: Association name: Joseph Borruso
- Financial info: Total monthly fees $448; total annual fees $5,376; Lease restrictions apply
- HOA & community: Monthly condo fee of $448 (includes cable TV, pool, escrow reserves, fidelity bond, gas, insurance, internet, maintenance - structure & grounds, management, private road, recreational facilities, security, sewer, trash, water); Association amenities: clubhouse, laundry, maintenance, pool, recreation facilities, shuffleboard court, spa/hot tub, storage; Community features: clubhouse, fitness center, pool, sidewalks, community mailbox, deed restrictions, wheelchair access, buyer approval required, special community restrictions; Senior community; Pets not allowed; Association approval required
Exterior
- Parking: Assigned parking; Covered parking; Guest parking; Off-street parking; 1-car carport
- Security: Association-provided security
- Utilities: Public water; Public sewer; Cable available and connected; Electricity available and connected; Natural gas available and connected; Water available and connected; Sewer available and connected
- Home design: Condominium; Residential property; 2 total stories; Faces north
- Construction: Block construction; Membrane roof; Block foundation; Built as part of multi-unit building
- Exterior features: Enclosed patio/porch; Exterior lighting; Sidewalk; Exterior storage; Irrigation equipment; Trees / landscaped
Interior
- Kitchen: Range; Refrigerator
- Bedrooms: 2 bedrooms
- Flooring: Laminate flooring
- Bathrooms: 1 full bathroom
- Heating & cooling: Central heating; Central air conditioning
- Interior features: Ceiling fans; Living room / dining room combo; Open floorplan; Window treatments; Bonus room; Other interior features
- Laundry & utility: Laundry inside; Common area laundry
Neighborhood map
What this means for you Summary
Snapshot
- This is a 2-bed/1.0-bath condo listed at $80k.
Deal economics
- At list price, monthly cash flow is $408 ($5k/yr) — positive.
- The deal already cash-flows at list — no discount required.
- Meets the 1% rule at list price ($2k rent vs $80k).
- Recommended offer: $75k (6.0% below list) — sets the bar for market timing.
- Cap rate 12.4% vs local median 4.7% in Lealman — top-decile yield for the area; either an underpriced asset or a hidden risk that comps aren't pricing in. Stress-test before assuming the spread holds.
Location & tenants
- Location reads 81/100 on livability (#83 in FL, #1,394 nationally) — a professional / high-income tenant draw. Strengths: commute A+, cost of living A+, housing A+; Watch: crime D+, schools F, employment F.
- Pinellas (suburban): math 51% / reading 51% proficiency, ranked #31 of 73 in FL (top 42%) — acceptable for families but not a draw, mixed tenant base, ~2y average lease.
- Market conditions: Rents soft (-2.1%/yr); 165 active listings in the ZIP; 39 comparable units currently listed for rent nearby; rentals at typical pace (median 18d on market — plan ~3-4 weeks tenant-placement turnaround); 2,676 units permitted in Pinellas County in 2024 (1,422 in 5+ unit buildings).
- At $1,815/mo this rent would consume 46% of the median local household income ($47k/yr) (locally 915% of renters already pay >50% of income on rent) — very limited rent-growth headroom before tenants either downsize or default.
Forward outlook
- Local home prices are declining (-3.0%/yr); year-one equity from $552 of loan paydown is wiped out by about $2k of value loss. Plan a longer hold.
- Pinellas County population projected at +14% by 2050 — modest demand growth; plan on rents tracking national, not racing it.
- At projected returns (-3.0% appreciation + 0.0% rent growth), your $22k cash investment doubles in ~9 years — after that, you're playing with house money.
Negotiation context
- It's been on market 83 days — a 6% lower offer ($75k) is reasonable based on typical stale-listing flexibility.
- 2 sale attempts with the ask held roughly flat each time — persistent listings suggest the price (not the market) is what's stuck; bring a comps-based counter.
- Current owner paid $22k; list at $80k implies a 263% gain — meaningful room to come down on a strong offer.
Risks & watch-outs
- Watch-outs: HOA is 25% of rent.
- Climate carrying-cost: severe wind risk, 99% chance of damaging wind over 30y; extreme-heat days projected 7→28/yr by 2055 (HVAC capex compounding) — expect insurance premiums to compound above CPI over the hold.
Questions for the listing agent
- It's been on market 83 days. Have you received any prior offers? Is the seller open to a 6% concession, seller financing, or rate buy-down credit?
- Built in 1965 — when were the roof, HVAC, electrical panel, plumbing, and water heater last replaced?
- What does the HOA fee cover, when was the last increase, and are there any pending special assessments or reserve-fund shortfalls?
- Any open or pending special assessments — roof, HVAC, plumbing, elevator, façade? What's the per-unit balance and payoff schedule, and is the seller paying it off at close or rolling it to the buyer?
- Why hasn't it sold? Are there any deal-killer items the seller is aware of (foundation, flood, title, zoning, code violations)?
- Is there a deadline driving the sale (1031 exchange, divorce, estate, relocation)? That informs how much negotiation room exists.
- Schools are F-rated, which usually means shorter tenancies and higher turnover. Who's the typical renter profile here, and what's been the actual vacancy rate?
- Crime grade is D in this area — have there been break-ins, vandalism, or insurance claims at this property in the last 3 years? What carrier currently insures it and at what premium?
- What's the average days-on-market for RENTAL listings here right now (not sales)? A rising rental-DOM trend means longer vacancies and softer asking-rent achievability than the comps imply.
- What's the recent tenant-quality profile in this submarket — average credit score on applications, eviction rate, late-payment / NSF rate, and stable-employment percentage? A property-management company in the area should have these aggregated.
- How much new apartment / multifamily construction is in the pipeline within 1–3 miles? Heavy new supply (>2% of stock underway) typically softens rents 12–24 months out; light construction supports rent growth.
Investment metrics
- 1% rule
- 2.27% ✓
- Cap rate
- 12.42%
- Cash-on-cash
- 21.88%
- DSCR
- 1.97
- GRM
- 3.7
CMA / ARV
No comps found within radius.
Projected returns pro-forma
-3.0% appreciation · 0.0% rent growth · sell at horizon
- IRR
- 9.6%
- Equity multiple
- 1.36×
- Total profit
- $8,030
- Equity at exit
- $11,913
- IRR
- 14.7%
- Equity multiple
- 1.95×
- Total profit
- $21,180
- Equity at exit
- $6,908
Cash invested: $22,372 (down + closing). Projections, not guarantees.
Landlord ↔ Tenant lean methodology
- Overall (STATE)
- 87 Strongly Landlord-Friendly
- State Florida
- 87 Strongly Landlord-Friendly · R+3
- County
- — inherits STATE
- City
- — inherits STATE
ZIP-level market 33714
- Home prices YoY
- -30.9%
- Rents YoY
- -2.1%
- Active inventory
- 165
- Price-to-rent
- 3.7×
Monthly cashflow live
- Estimated rent
- $1,815 high interval (Pro) →
- Mortgage (P&I)
- −$419
- Tax from tax record
- −$126 /mo · $1,508/yr
- Insurance
- −$33
- HOA
- −$448
- Vacancy / Maint / Mgmt
- −$381
- Net cashflow
- $408
Break-even live
UW: 25.0% down · 7.5% · 30yr · 1.5% tax · 5.0% vac · 8.0% maint · 8.0% mgmt
Financing live
Cash to close
- Down payment
- $19,975
- Closing costs
- $2,397
- Reserves months
- —
- Total cash needed
- —
Loan-product check · same deal, 3 products live
Conventional
25% down · 7.5% · 30yr
- Down + closing
- —
- Monthly P&I
- —
- Monthly cashflow
- —
- DSCR
- —
- Eligible?
- —
Personal DTI + credit; lowest rate.
DSCR
20% down · 8.5% · 30yr
- Down + closing
- —
- Monthly P&I
- —
- Monthly cashflow
- —
- DSCR
- —
- Eligible?
- —
No personal income docs; deal must DSCR.
Hard money
10% down · 12.0% · 12mo
- Down + closing
- —
- Monthly P&I
- —
- Monthly cashflow
- —
- DSCR
- —
- Eligible?
- —
Short-term bridge; refi at stabilization.
Rent comps 39 comps
| Address | Beds | Baths | Sqft | Rent | $/sqft | DOM | Units | Dist |
|---|---|---|---|---|---|---|---|---|
| 5850 18th St N St Petersburg, FL | 1.0–2.0 | 1.0–2.0 | 727 | $1,400 | $1.92 | 24d | 2 | 0.19mi |
| 5920 18th St N #14 Saint Petersburg, FL | 2.0 | 2.0 | 950 | $1,400 | $1.47 | 24d | 1 | 0.21mi |
| 5850 18th St N #23 Saint Petersburg, FL | 2.0 | 2.0 | 870 | $1,400 | $1.61 | 17d | 1 | 0.21mi |
| 2275 62nd Ave N #203 St Petersburg, FL | 2.0 | 2.0 | 940 | $1,975 | $2.10 | 24d | 1 | 0.33mi |
| 5924 15th Way N Saint Petersburg, FL | 3.0 | 2.0 | 1104 | $3,200 | $2.90 | 4d | 1 | 0.47mi |
| 2734 62nd Ave N Apt 3 St. Petersburg, FL | 2.0 | 1.5 | 833 | $1,895 | $2.27 | 24d | 1 | 0.53mi |
| 2715 63rd Ter N Unit B St. Petersburg, FL | 2.0 | 2.0 | 1030 | $1,900 | $1.84 | 24d | 1 | 0.56mi |
| 2600 52nd Ave N Unit B St. Petersburg, FL | 2.0 | 2.0 | 857 | $2,275 | $2.65 | 2d | 1 | 0.65mi |
| 2600 52nd Ave N Unit A St. Petersburg, FL | 2.0 | 2.0 | 1018 | $2,225 | $2.19 | 2d | 1 | 0.65mi |
| 1145 54th Ave N Saint Petersburg, FL | 2.0 | 1.0 | 810 | $1,850 | $2.28 | 24d | 1 | 0.77mi |
| 4660 24th St N Saint Petersburg, FL | 3.0 | 1.0 | 600 | $2,250 | $3.75 | 24d | 1 | 0.80mi |
| 7260 17th Way N Saint Petersburg, FL | 3.0 | 1.0 | 912 | $3,650 | $4.00 | 4d | 1 | 0.86mi |
| 3114 58th Ave N Saint Petersburg, FL | 2.0 | 1.0 | 800 | $1,950 | $2.44 | 4d | 1 | 0.89mi |
| 3132 56th Ave N Saint Petersburg, FL | 3.0 | 2.0 | 1063 | $2,850 | $2.68 | 24d | 1 | 0.91mi |
| 5200 28th St N Unit 628 St. Petersburg, FL | 2.0 | 1.0 | 872 | $2,200 | $2.52 | 24d | 1 | 0.94mi |
| 5200 28th St N Unit 402 St. Petersburg, FL | 2.0 | 2.0 | 850 | $1,995 | $2.35 | 16d | 1 | 0.94mi |
| 4481 Crestwood Dr N Saint Petersburg, FL | 2.0 | 1.0 | 720 | $1,950 | $2.71 | 4d | 1 | 0.97mi |
| 6910 Dr Martin Luther King Jr St N Saint Petersburg, FL | 2.0 | 1.0 | 780 | $1,850 | $2.37 | 24d | 1 | 1.10mi |
| 660 62nd Ave N #1204 Saint Petersburg, FL | 1.0 | 1.0 | 656 | $1,400 | $2.13 | 23d | 1 | 1.17mi |
| 4104 1/2 Haines Rd N Unit 1 St. Petersburg, FL | 2.0 | 1.0 | 1000 | $1,850 | $1.85 | 24d | 1 | 1.26mi |
| 3584 54th Ave N Saint Petersburg, FL | 3.0 | 1.0 | 1012 | $1,950 | $1.93 | 4d | 1 | 1.28mi |
| 5519 Commonwealth Ave N Saint Petersburg, FL | 2.0 | 1.0 | 852 | $2,900 | $3.40 | 4d | 1 | 1.28mi |
| 2519 39th Ave N Saint Petersburg, FL | 3.0 | 2.0 | 1005 | $2,750 | $2.74 | 24d | 1 | 1.31mi |
| 209 NW Jefferson Cir N Unit 15 St. Petersburg, FL | 2.0 | 1.0 | 740 | $1,275 | $1.72 | 24d | 1 | 1.33mi |
| 209 NW Jefferson Cir N Unit JEFFERSON209-15 St. Petersburg, FL | 2.0 | 1.0 | 740 | $1,275 | $1.72 | 3d | 1 | 1.33mi |
| 3580 49th Ave N St. Petersburg, FL | 2.0 | 1.0 | 790 | $1,425 | $1.80 | 3d | 1 | 1.36mi |
| 3560 49th Ave N St. Petersburg, FL | 2.0 | 1.0 | 790 | $1,425 | $1.80 | 13d | 1 | 1.37mi |
| 3560 49th Ave N St. Petersburg, FL | 2.0 | 1.0 | 790 | $1,425 | $1.80 | 11d | 1 | 1.37mi |
| 3600 49th Ave N Saint Petersburg, FL | 1.0–2.0 | 1.0 | 680 | $1,600 | $2.35 | 3d | 8 | 1.37mi |
| 4163 31st St N unit Unit D Saint Petersburg, FL | 1.0 | 1.0 | 600 | $1,490 | $2.48 | 13d | 1 | 1.37mi |
| 3725 18th St N Saint Petersburg, FL | 2.0 | 1.0 | 700 | $1,795 | $2.56 | 16d | 1 | 1.39mi |
| 550 50th Ave N Saint Petersburg, FL | 2.0 | 1.0 | 765 | $1,700 | $2.22 | 7d | 2 | 1.39mi |
| 5364 4th St N St. Petersburg, FL | 1.0 | 1.0 | 570 | $1,150 | $2.02 | 24d | 1 | 1.40mi |
| 426 Palm Ave N Unit 9 St. Petersburg, FL | 2.0 | 1.0 | 850 | $1,500 | $1.76 | 24d | 1 | 1.41mi |
| 4129 32nd St N Unit B St. Petersburg, FL | 3.0 | 1.0 | 1000 | $2,150 | $2.15 | 24d | 1 | 1.41mi |
| 3715 66th Ave N Unit B Pinellas Park, FL | 2.0 | 1.0 | 750 | $1,475 | $1.97 | 21d | 1 | 1.42mi |
| 1001 77th Ave N #308 Saint Petersburg, FL | 1.0 | 1.0 | 650 | $1,325 | $2.04 | 4d | 1 | 1.48mi |
| 440 50th Ave N Saint Petersburg, FL | 1.0 | 1.0 | 825 | $2,100 | $2.55 | 24d | 1 | 1.49mi |
| 547 46th Ave N Saint Petersburg, FL | 2.0 | 1.0 | 837 | $2,000 | $2.39 | 7d | 1 | 1.49mi |
HOA detail condo
- Monthly dues
- $448 · $5,376/yr
- Assessments
- None detected in remarks — confirm with the listing agent.
Listing history 17 events
-
2026-06-18days on market $79,900 Active 83 DOM
-
2026-06-17days on market $79,900 Active 82 DOM
-
2026-06-16days on market $79,900 Active 81 DOM
-
2026-06-15days on market $79,900 Active 80 DOM
-
2026-06-13days on market $79,900 Active 78 DOM
-
2026-06-09days on market $79,900 Active 74 DOM
-
2026-06-08days on market $79,900 Active 73 DOM
-
2026-06-07days on market $79,900 Active 72 DOM
-
2026-06-04days on market $79,900 Active 69 DOM
-
2026-06-03days on market $79,900 Active 68 DOM
-
2026-06-01days on market $79,900 Active 66 DOM
-
2026-05-31days on market $79,900 Active 65 DOM
-
2026-03-27$79,900 Active
-
2026-03-15historical
-
2026-01-10price $95,000
-
2025-04-23$105,900 Active
-
2013-02-11soldstatus $22,000
ⓘ Source: listings_history table (triggers on properties + properties_extension) + one-shot
backfill from property_details.listing_events for pre-trigger history.
Tax reassessment forecast FL · Resets to sale price
- Current annual tax
- $1,508 · $126/mo
- Projected year-2 tax
- $1,508 · $126/mo
- Expected delta
- $0/yr ($0/mo · 0.0%)
ⓘ Screening estimate from a state-policy table — verify with the county assessor before closing.
Climate risk First Street
- Flood 4/10 Moderate FEMA zone X (unshaded) · 13% chance over 30 yrs
- Wildfire 1/10 Low
- Heat 10/10 Extreme 7 d/yr ≥106°F today · 28 d/yr by 30 yrs out
- Wind 10/10 Extreme 99% chance of damaging wind over 30 yrs
- Air quality 4/10 Moderate 4 unhealthy d/yr today · 4 by 30 yrs out
Nearby sold comps map
Loading sold comps map…
Walkable amenities ~0.75 mi
Loading nearby amenities…
Taxation est. · year 1
- Rental income
- $21,780
- − Mortgage interest
- −$4,476
- − Property taxes
- −$1,508
- − Insurance
- −$400
- − Repairs & maintenance
- −$1,742
- − Management
- −$1,742
- − HOA
- −$5,376
- − Depreciation
- −$2,324
- Taxable income
- $4,211
- Est. tax owed @ 24.0%
- −$1,011
- After-tax cash flow
- $3,884/yr
For passive investors: Depreciation is non-cash, so a rental often shows a tax loss while cash-flowing — sheltering income. Rental losses are passive: they offset passive income freely, and up to $25,000/yr can offset ordinary (W-2) income if you actively participate and your MAGI is under $100k (phasing out to $0 by $150k); unused losses carry forward. On sale, claimed depreciation is recaptured at up to 25%, and gains may owe capital-gains tax (a 1031 exchange can defer both). Figures are a year-1 estimate at your 24.0% rate — not tax advice; consult a CPA.
Schools (NCES district)
- District
- Pinellas
- NCES district ID
- 1201560
- Math proficiency
- 51% ▼ -5.00%
- Reading proficiency
- 51% ▼ -3.00%
- Median HH income
- $46,270
- Composite
- 43.27/100
- National rank
- #3046
- State rank
- #31 of 73 in FL
Livability — Lealman
- Score
- 81/100
- State rank
- #83
- US rank
- #1394
Category grades
Schools grade is shown separately in the Schools card above.
Census & demographics
- Census place
- Lealman, FL
- County
- Pinellas County · 939,478 people
- City population
- 20,103
- Metro
- Tampa-St. Petersburg-Clearwater, FL
- Population (ZIP)
- 19,227
- Household income
- $47,487
- Rent vs Own
- Severe rent burden
- 915.0
Population outlook (Pinellas County) Hauer SSP2
- Today (2025)
- 1,027,532 people
- By 2030
- 1,063,586 · +3.5%
- By 2040
- 1,125,020 · +9.5%
- By 2050
- 1,168,637 · +13.7%
- By 2075
- 1,265,188 · +23.1%
- By 2100
- 1,260,357 · +22.7%
Race, ethnicity, and origin ACS 2023
- Neighborhood character
- Diverse neighborhood (Simpson 0.55)
- Race & ethnicity
- White 64% Hispanic / Latino 13% Two or more races 12% Black 10% Asian 6%
- Hispanic origin (detail)
- Mexican 2% Puerto Rican 2% Cuban 6% Dominican 1%
- Common ancestry
- Slovak 2% Italian 2% Romanian 2%
- Foreign-born
- 16% · Canada, Vietnam
- Languages at home
- 79% English-only · Spanish 11% Russian/Polish/Slavic 4% Vietnamese 3%
Political lean MEDSL · Pinellas
- 2024 margin
- Lean R (+5.2) · D 46.9% · R 52.1%
- 2008→2024 swing
- -13.5pp toward R · 2008: 8.3pp · 2024: -5.2pp
- All cycles
- 2024: R+5.2 2020: D+0.2 2016: R+1.1 2012: D+5.6 2008: D+8.3
Not yet ingested
- Civics
- —
Market trends
- HPI YoY
- ▼ -179.12%
- Current HPI
- 399.6253
- Rent YoY
- ▼ -2.08%
- Metro
- Tampa-St. Petersburg-Clearwater, FL
- State GDP YoY
- ▲ 3.28%
- F500 in state
- 36
Industry mix (Fortune 500 HQ in FL)
| Industry | F500 HQs | Revenue |
|---|---|---|
| Industrial Technology | 2 | $29B |
|
||
| Insurance | 2 | $17B |
|
||
| Retail | 1 | $60B |
|
||
| Technology Distribution | 1 | $58B |
|
||
| Homebuilding | 1 | $35B |
|
||
| Technology Manufacturing | 1 | $35B |
|
||
Price history
+263.2% since first listed5 events — show timeline
- 2026-03-27 Listed $79,900 Stellar MLS as Distributed by MLS Grid
- 2026-03-15 Listing Removed — Stellar MLS as Distributed by MLS Grid
- 2026-01-10 Price Changed $95,000 Stellar MLS as Distributed by MLS Grid
- 2025-04-23 Listed $105,900 Stellar MLS as Distributed by MLS Grid
- 2013-02-11 Sold (Public Records) $22,000 Public Records
Property tax history
+10.0%/yrLatest (2025): $1,508 · +6.0% YoY. Source: county tax records.
Cash-flow waterfall
monthlySold comps — $/sqft
last 12 mo · ≤1 miLoading sold comps…