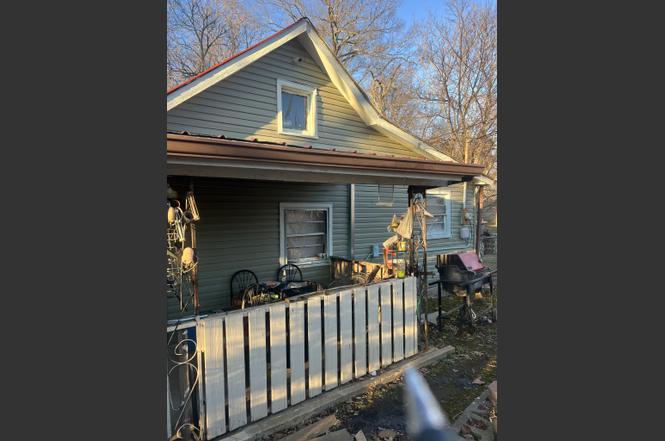
2077 Holders Cove Rd · Winchester, TN
Flood risk 3/10 · Minor
- FEMA flood zone
- X (unshaded)
- Chance of flooding over 30 yrs
- 0.2%
- Est. flood insurance / yr
- $473 – $860
Fire risk 4/10 · Minor
- Est. fire insurance / yr
- $949 – $1,763
Heat risk 5/10 · Moderate
- Hot days now (above 104°F)
- 7 days/yr
- Hot days in 30 yrs
- 18 days/yr
Wind risk 4/10 · Minor
- Chance of severe wind over 30 yrs
- 16.0%
Air-quality risk 2/10 · Minimal
- Unhealthy air days now
- 2 days/yr
- Unhealthy air days in 30 yrs
- 2 days/yr
Risk factors via First Street. Map © Google.
Why this score? — see what drove the B- grade
The composite is a weighted blend of 9 inputs, each scored 0–100. Each bar is that input's sub-score; the figure is the points it added to the 100-point composite (weight × sub-score).
- Cash flow +30.0/30.0
- 1% rule +10.0/10.0
- DSCR +10.0/10.0
- ARV discount +7.5/15.0
- Livability +3.2/5.0
- Rent growth +2.5/5.0
- Condition / age +2.5/5.0
- Schools +1.7/10.0
- Appreciation +0.0/10.0
$150,000
🖨 Deal sheet (PDF) 📄 Offer letter ✓ Due diligence
Listing remarks
This home is a perfect opportunity for those looking to remodel. It does need significant repairs, offering a blank slate to create your dream home. The spacious 2-acre lot adds potential, giving you room to create your space inside and out. This home offers 4 rooms, one of which is ideal as a home office.
Key facts
- 2 acre lot
- Home office
- 2 acre lot
Tags
Property features AI
Exterior
- Parking: No covered parking; No dedicated parking spaces listed
- Utilities: Public water; Private sewer; Water available
- Home design: Single-family residence; One story
- Construction: Vinyl siding; Metal roof; Existing construction
- Exterior features: 2-acre lot
Interior
- Kitchen: No appliances listed
- Bedrooms: 4 bedrooms (all on the main level)
- Flooring: Carpet; Laminate; Tile
- Bathrooms: 1 full bathroom
- Heating & cooling: Central heating; Central air conditioning
- Interior features: Unfinished basement; Carpet, laminate and tile flooring
- Laundry & utility: No laundry appliances listed
Neighborhood map
What this means for you Summary
Snapshot
- This is a 4-bed/1.0-bath single-family listed at $150k.
Deal economics
- At list price, monthly cash flow is $959 ($12k/yr) — positive.
- The deal already cash-flows at list — no discount required.
- Meets the 1% rule at list price ($2k rent vs $150k).
- Recommended offer: $132k (12.0% below list) — sets the bar for market timing.
- Cap rate 14.0% vs local median 3.0% in Winchester — top-decile yield for the area; either an underpriced asset or a hidden risk that comps aren't pricing in. Stress-test before assuming the spread holds.
Location & tenants
- Location reads 65/100 on livability (#149 in TN) — a middle-class / working-renter tenant base. Strengths: cost of living A+, housing A+; Watch: employment C-, crime D, amenities D-.
- Franklin County (town): math 18% / reading 22% proficiency, ranked #111 of 139 in TN (top 80%) — low school quality limits family demand, transient renter base, plan for 1-2y turnover.
- Zoned schools: Cowan Elementary (math 32% / reading 17%, grade F, #546 of 952 statewide, top 61%, 279 students, 0% FRL); South Middle School (math 11% / reading 13%, grade F, #242 of 333 statewide, top 74%, 292 students, 0% FRL); Franklin Co High School (math 5% / reading 22%, grade F, #255 of 332 statewide, top 77%, 1,180 students, 0% FRL) — zoned schools average 0% FRL vs 48% district-wide (48 pts lower); this property's tenant base skews higher-income than the district average.
- Market conditions: 325 active listings in the ZIP; 422 units permitted in Franklin County in 2024 (5 in 5+ unit buildings).
Forward outlook
- Local home prices are declining (-3.0%/yr); year-one equity from $1k of loan paydown is wiped out by about $4k of value loss. Plan a longer hold.
- Franklin County population projected at +6% by 2050 — modest demand growth; plan on rents tracking national, not racing it.
- At projected returns (-3.0% appreciation + 3.0% rent growth), your $42k cash investment doubles in ~5 years — after that, you're playing with house money.
Negotiation context
- It's been on market 143 days — a 12% lower offer ($132k) is reasonable based on typical stale-listing flexibility.
- 2 sale attempts; this cycle's ask has dropped $40k (21%) from the opening price — seller is motivated, your offer sets the floor, not the list.
- Current owner paid $25k; list at $150k implies a 500% gain — meaningful room to come down on a strong offer.
Risks & watch-outs
- Watch-outs: built in 1951 — expect roof / HVAC / electrical / plumbing capex.
- Climate carrying-cost: extreme-heat days projected 7→18/yr by 2055 (HVAC capex compounding) — expect insurance premiums to compound above CPI over the hold.
Questions for the listing agent
- It's been on market 143 days. Have you received any prior offers? Is the seller open to a 12% concession, seller financing, or rate buy-down credit?
- Built in 1951 — when were the roof, HVAC, electrical panel, plumbing, and water heater last replaced?
- Why hasn't it sold? Are there any deal-killer items the seller is aware of (foundation, flood, title, zoning, code violations)?
- Is there a deadline driving the sale (1031 exchange, divorce, estate, relocation)? That informs how much negotiation room exists.
- Schools are F-rated, which usually means shorter tenancies and higher turnover. Who's the typical renter profile here, and what's been the actual vacancy rate?
- Crime grade is D in this area — have there been break-ins, vandalism, or insurance claims at this property in the last 3 years? What carrier currently insures it and at what premium?
- What's the average days-on-market for RENTAL listings here right now (not sales)? A rising rental-DOM trend means longer vacancies and softer asking-rent achievability than the comps imply.
- What's the recent tenant-quality profile in this submarket — average credit score on applications, eviction rate, late-payment / NSF rate, and stable-employment percentage? A property-management company in the area should have these aggregated.
- How much new for-sale + rental construction is in the pipeline within 1–3 miles? Heavy new supply typically softens prices + rents 12–24 months out; constrained supply supports both.
Investment metrics
- 1% rule
- 1.58% ✓
- Cap rate
- 13.97%
- Cash-on-cash
- 27.41%
- DSCR
- 2.22
- GRM
- 5.3
CMA / ARV
No comps found within radius.
Projected returns pro-forma
-3.0% appreciation · 3.0% rent growth · sell at horizon
- IRR
- 21.4%
- Equity multiple
- 1.88×
- Total profit
- $36,752
- Equity at exit
- $22,365
- IRR
- 29.5%
- Equity multiple
- 3.63×
- Total profit
- $110,514
- Equity at exit
- $12,969
Cash invested: $42,000 (down + closing). Projections, not guarantees.
Landlord ↔ Tenant lean methodology
- Overall (STATE)
- 87 Strongly Landlord-Friendly
- State Tennessee
- 87 Strongly Landlord-Friendly · R+13
- County
- — inherits STATE
- City
- — inherits STATE
ZIP-level market 37398
- Home prices YoY
- -21.1%
- Active inventory
- 325
- Price-to-rent
- 5.3×
Monthly cashflow live
- Estimated rent
- $2,370 medium interval (Pro) →
- Mortgage (P&I)
- −$787
- Tax from tax record
- −$64 /mo · $769/yr
- Insurance
- −$62
- HOA
- −$0
- Lot rent
- −$0
- Vacancy / Maint / Mgmt
- −$498
- Net cashflow
- $959
Break-even live
Sensitivity live
| Price | -10% $1,044 | -5% $1,002 | +0% $959 | +5% $917 | +10% $874 |
|---|---|---|---|---|---|
| Rent | -10% $772 | -5% $866 | +0% $959 | +5% $1,053 | +10% $1,147 |
| Rate | -1.0pp $1,035 | -0.5pp $997 | base $959 | +0.5pp $920 | +1.0pp $881 |
UW: 25.0% down · 7.5% · 30yr · 1.5% tax · 5.0% vac · 8.0% maint · 8.0% mgmt
Financing live
Cash to close
- Down payment
- $37,500
- Closing costs
- $4,500
- Reserves months
- —
- Total cash needed
- —
Loan-product check · same deal, 3 products live
Conventional
25% down · 7.5% · 30yr
- Down + closing
- —
- Monthly P&I
- —
- Monthly cashflow
- —
- DSCR
- —
- Eligible?
- —
Personal DTI + credit; lowest rate.
DSCR
20% down · 8.5% · 30yr
- Down + closing
- —
- Monthly P&I
- —
- Monthly cashflow
- —
- DSCR
- —
- Eligible?
- —
No personal income docs; deal must DSCR.
Hard money
10% down · 12.0% · 12mo
- Down + closing
- —
- Monthly P&I
- —
- Monthly cashflow
- —
- DSCR
- —
- Eligible?
- —
Short-term bridge; refi at stabilization.
Listing history 25 events
-
2026-06-22days on market $150,000 Active 143 DOM
-
2026-06-19days on market $150,000 Active 140 DOM
-
2026-06-18days on market $150,000 Active 139 DOM
-
2026-06-17days on market $150,000 Active 138 DOM
-
2026-06-16days on market $150,000 Active 137 DOM
-
2026-06-15days on market $150,000 Active 136 DOM
-
2026-06-14days on market $150,000 Active 134 DOM
-
2026-06-13days on market $150,000 Active 133 DOM
-
2026-06-10days on market $150,000 Active 131 DOM
-
2026-06-09days on market $150,000 Active 130 DOM
-
2026-06-08days on market $150,000 Active 129 DOM
-
2026-06-07days on market $150,000 Active 128 DOM
-
2026-06-05statusdays on market $150,000 Active 125 DOM
-
2026-06-03days on market $150,000 Active Under Contract 124 DOM
-
2026-06-02days on market $150,000 Active Under Contract 123 DOM
-
2026-06-01days on market $150,000 Active Under Contract 122 DOM
-
2026-05-31days on market $150,000 Active Under Contract 121 DOM
-
2026-05-30days on market $150,000 Active Under Contract 120 DOM
-
2026-05-13historical Active Under Contract
-
2026-03-25status Active
-
2026-03-12historical Active Under Contract
-
2026-02-26price $150,000
-
2026-01-30$190,000 Active
-
2011-08-17soldstatus $25,000
-
2011-08-17soldstatus $25,000
ⓘ Source: listings_history table (triggers on properties + properties_extension) + one-shot
backfill from property_details.listing_events for pre-trigger history.
Tax reassessment forecast TN · Resets to sale price
- Current annual tax
- $769 · $64/mo
- Projected year-2 tax
- $1,065 · $89/mo
- Expected delta
- +$296/yr (+$25/mo · 38.5%)
ⓘ Screening estimate from a state-policy table — verify with the county assessor before closing.
Climate risk First Street
- Flood 3/10 Moderate FEMA zone X (unshaded) · 20% chance over 30 yrs
- Wildfire 4/10 Moderate
- Heat 5/10 Major 7 d/yr ≥104°F today · 18 d/yr by 30 yrs out
- Wind 4/10 Moderate 16% chance of damaging wind over 30 yrs
- Air quality 2/10 Low 2 unhealthy d/yr today · 2 by 30 yrs out
Nearby sold comps map
Loading sold comps map…
Walkable amenities ~0.75 mi
Loading nearby amenities…
Taxation est. · year 1
- Rental income
- $28,443
- − Mortgage interest
- −$8,402
- − Property taxes
- −$769
- − Insurance
- −$750
- − Repairs & maintenance
- −$2,275
- − Management
- −$2,275
- − Depreciation
- −$4,364
- Taxable income
- $9,607
- Est. tax owed @ 24.0%
- −$2,306
- After-tax cash flow
- $9,206/yr
For passive investors: Depreciation is non-cash, so a rental often shows a tax loss while cash-flowing — sheltering income. Rental losses are passive: they offset passive income freely, and up to $25,000/yr can offset ordinary (W-2) income if you actively participate and your MAGI is under $100k (phasing out to $0 by $150k); unused losses carry forward. On sale, claimed depreciation is recaptured at up to 25%, and gains may owe capital-gains tax (a 1031 exchange can defer both). Figures are a year-1 estimate at your 24.0% rate — not tax advice; consult a CPA.
Schools (NCES district)
- District
- Franklin County
- NCES district ID
- 4701290
- Math proficiency
- 18% ▼ -9.00%
- Reading proficiency
- 22% ▼ -8.00%
- Median HH income
- $43,108
- Composite
- 17.24/100
- National rank
- #9094
- State rank
- #111 of 139 in TN
Livability — Winchester
- Score
- 65/100
- State rank
- #149
- US rank
- #13341
Category grades
Schools grade is shown separately in the Schools card above.
Census & demographics
- Population (ZIP)
- 15,712
Population outlook (Franklin County) Hauer SSP2
- Today (2025)
- 42,858 people
- By 2030
- 43,540 · +1.6%
- By 2040
- 44,623 · +4.1%
- By 2050
- 45,523 · +6.2%
- By 2075
- 48,954 · +14.2%
- By 2100
- 50,170 · +17.1%
Race, ethnicity, and origin ACS 2023
- Neighborhood character
- Predominantly White (81%)
- Race & ethnicity
- White 81% Hispanic / Latino 7% Black 7% Two or more races 6% Asian 1%
- Hispanic origin (detail)
- Mexican 4%
- Common ancestry
- Serbian 2% Lithuanian 2% Slovak 1%
- Foreign-born
- 4% · Canada
- Languages at home
- 93% English-only · Spanish 5% Other Indo-European 1% German/W. Germanic 1%
Political lean MEDSL · Franklin
- 2024 margin
- Solid R (+53.2) · D 23.0% · R 76.1%
- 2008→2024 swing
- -30.6pp toward R · 2008: -22.5pp · 2024: -53.2pp
- All cycles
- 2024: R+53.2 2020: R+47.7 2016: R+43.7 2012: R+28.9 2008: R+22.5
Not yet ingested
- Civics
- —
Market trends
- HPI YoY
- ▼ -89.03%
- Current HPI
- 333.839
- Rent YoY
- —
- Metro
- —
- State GDP YoY
- ▲ 2.78%
- F500 in state
- 22
Industry mix (Fortune 500 HQ in TN)
| Industry | F500 HQs | Revenue |
|---|---|---|
| Healthcare | 3 | $91B |
|
||
| Retail | 3 | $72B |
|
||
| Transportation / Logistics | 1 | $88B |
|
||
| Paper / Packaging | 1 | $19B |
|
||
| Insurance | 1 | $13B |
|
||
| Energy | 1 | $12B |
|
||
Price history
+500.0% since first listed7 events — show timeline
- 2026-05-13 Contingent — REALTRACS as Distributed by MLS Grid
- 2026-03-25 Relisted — REALTRACS as Distributed by MLS Grid
- 2026-03-12 Contingent — REALTRACS as Distributed by MLS Grid
- 2026-02-26 Price Changed $150,000 REALTRACS as Distributed by MLS Grid
- 2026-01-30 Listed $190,000 REALTRACS as Distributed by MLS Grid
- 2011-08-17 Sold (Public Records) $25,000 Public Records
- 2011-08-17 Sold (Public Records) $25,000 Public Records
Property tax history
+5.8%/yrLatest (2025): $769 · +0.0% YoY. Source: county tax records.
Cash-flow waterfall
monthlySold comps — $/sqft
last 12 mo · ≤1 miLoading sold comps…