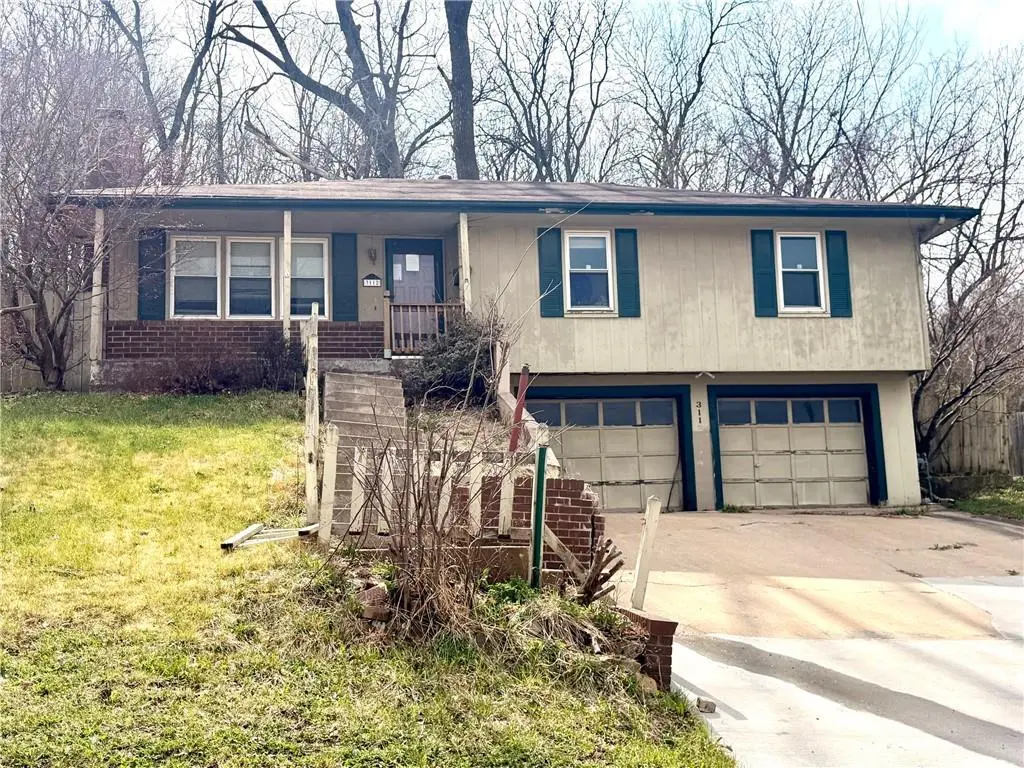
3112 Hampton Rd · St. Joseph, MO
Flood risk 1/10 · Minimal
- FEMA flood zone
- X
- Chance of flooding over 30 yrs
- 0.0%
- Est. flood insurance / yr
- $473 – $860
Fire risk 1/10 · Minimal
- Est. fire insurance / yr
- $1,054 – $1,958
Heat risk 3/10 · Minor
- Hot days now (above 106°F)
- 7 days/yr
- Hot days in 30 yrs
- 16 days/yr
Wind risk 2/10 · Minimal
- Chance of severe wind over 30 yrs
- —
Air-quality risk 2/10 · Minimal
- Unhealthy air days now
- 1 days/yr
- Unhealthy air days in 30 yrs
- 1 days/yr
Risk factors via First Street. Map © Google.
Why this score? — see what drove the D- grade
The composite is a weighted blend of 9 inputs, each scored 0–100. Each bar is that input's sub-score; the figure is the points it added to the 100-point composite (weight × sub-score).
- ARV discount +15.0/15.0
- Cash flow +7.9/30.0
- Schools +2.8/10.0
- Rent growth +2.5/5.0
- Livability +2.5/5.0
- Condition / age +2.5/5.0
- 1% rule +2.2/10.0
- DSCR +2.0/10.0
- Appreciation +0.0/10.0
$129,900
🖨 Deal sheet (PDF) 📄 Offer letter ✓ Due diligence
Listing remarks MLS
RAISED RANCH WITH 3 BEDROOMS, 2.5 BATHROOMS, FINISHED BASEMENT, PARTIALLY FENCED YARD, 2 CAR ATTACHED GARAGE, CENTRALLY LOCATED, DECK OF THE KITCHEN FOR ENTERTAINING.
Key facts
- Centrally located
- Finished basement
- Deck of the kitchen
Tags
Neighborhood map
What this means for you Summary
Snapshot
- This is a 3-bed/2.5-bath single-family listed at $130k.
Deal economics
- At list price, monthly cash flow is $-138 ($-2k/yr) — negative.
- To cash-flow at today's rent, offer at most $105k (18.8% below list).
- To meet the 1% rule (rent ≥ 1% of price), the offer needs to be $93k (28.5% below list).
- Recommended offer: $93k (28.5% below list) — sets the bar for 1% rule.
Location & tenants
- Location reads: area grade D — affects rentability + tenant quality, not the cash-flow math above.
- St. Joseph (urban): math 28% / reading 38% proficiency, ranked #241 of 324 in MO (top 74%) — families likely to look elsewhere, expect single-tenant / working-renter base with shorter leases.
- Market conditions: 126 active listings in the ZIP; 3 comparable units currently listed for rent nearby; rentals lingering (median 45d on market — plan ~5-8 weeks vacancy on turnover, expect pricing pressure); 100% of comp listings sitting > 30 days — soft ceiling on asking rent; 70 units permitted in Buchanan County in 2024 (0 in 5+ unit buildings).
Forward outlook
- Local home prices are declining (-3.0%/yr); year-one equity from $898 of loan paydown is wiped out by about $4k of value loss. Plan a longer hold.
- Buchanan County population projected to shrink 6% by 2050 — rents likely to lag national; underwrite the cash flow, not the appreciation.
Negotiation context
- It's been on market 77 days — a 6% lower offer ($122k) is reasonable based on typical stale-listing flexibility.
Questions for the listing agent
- What do current leases actually rent for vs. the listed asking? Can we see a recent rent roll and the last 12 months of T-12 income?
- It's been on market 77 days. Have you received any prior offers? Is the seller open to a 28% concession, seller financing, or rate buy-down credit?
- Why hasn't it sold? Are there any deal-killer items the seller is aware of (foundation, flood, title, zoning, code violations)?
- Is there a deadline driving the sale (1031 exchange, divorce, estate, relocation)? That informs how much negotiation room exists.
- The area grade is low — what's the realistic commute time and amenity access for the typical tenant pool here? Any planned neighborhood developments (good or bad) we should know about?
- What's the average days-on-market for RENTAL listings here right now (not sales)? A rising rental-DOM trend means longer vacancies and softer asking-rent achievability than the comps imply.
- What's the recent tenant-quality profile in this submarket — average credit score on applications, eviction rate, late-payment / NSF rate, and stable-employment percentage? A property-management company in the area should have these aggregated.
- How much new for-sale + rental construction is in the pipeline within 1–3 miles? Heavy new supply typically softens prices + rents 12–24 months out; constrained supply supports both.
Investment metrics
- 1% rule
- 0.72% ✗
- Cap rate
- 5.02%
- Cash-on-cash
- -4.56%
- DSCR
- 0.80
- GRM
- 11.6
CMA / ARV
- ARV (median comp)
- $197,370
- List price
- $129,900
- Delta
- -34.18%
- Verdict
- UNDERPRICED
- Comps
- 20 within 1.0 mi
Show comp detail 12 sales within ~0.75 mi
| Address | Dist | Beds/Ba | Sqft | Sold | Price | $/sf | Match |
|---|---|---|---|---|---|---|---|
| 2327 Goff Ave | 0.53mi | 3/1.0 | 1,200 (+0%) | 1mo | $199,000 | $166 | 68 |
| 1511 6th Ave | 0.29mi | 3/1.0 | 1,284 (+7%) | 2mo | $135,000 | $105 | 67 |
| 709 Randolph St | 0.58mi | 4/2.0 (+1) | 1,200 (+0%) | 11mo | $189,900 | $158 | 56 |
| 1805 6th Ave | 0.28mi | 2/1.5 (-1) | 1,345 (+12%) | 1mo | $190,000 | $141 | 56 |
| 3123 N 10th St | 0.42mi | 2/1.0 (-1) | 1,288 (+8%) | 3mo | $95,000 | $74 | 54 |
| 1012 Logan St | 0.42mi | 3/2.0 | 1,373 (+15%) | 1mo | $139,900 | $102 | 53 |
| 1101 Myrtle Ave | 0.61mi | 2/1.5 (-1) | 1,249 (+4%) | 3mo | $350,000 | $280 | 53 |
| 2114 Eugene Field Ave | 0.47mi | 2/2.0 (-1) | 1,272 (+6%) | 10mo | $215,000 | $169 | 53 |
| 521 Madison St | 0.68mi | 3/2.0 | 1,296 (+8%) | 9mo | $179,900 | $139 | 44 |
| 2915 Saint Joseph Ave | 0.42mi | 2/1.0 (-1) | 1,040 (-13%) | 10mo | $110,000 | $106 | 40 |
| 1806 N 22nd St | 0.69mi | 2/1.0 (-1) | 1,068 (-11%) | 0mo | $123,900 | $116 | 39 |
| 2219 Marion St | 0.53mi | 3/1.0 | 1,026 (-14%) | 11mo | $190,000 | $185 | 37 |
Match score weights: distance 35% · size 25% · config 20% · recency 20%. Top-matched comps best support the ARV.
Projected returns pro-forma
-3.0% appreciation · 3.0% rent growth · sell at horizon
- IRR
- -24.0%
- Equity multiple
- 0.18×
- Total profit
- $-29,851
- Equity at exit
- $19,369
- IRR
- -19.2%
- Equity multiple
- -0.03×
- Total profit
- $-37,332
- Equity at exit
- $11,231
Cash invested: $36,372 (down + closing). Projections, not guarantees.
Landlord ↔ Tenant lean methodology
- Overall (STATE)
- 81 Strongly Landlord-Friendly
- State Missouri
- 81 Strongly Landlord-Friendly · R+10
- County
- — inherits STATE
- City
- — inherits STATE
ZIP-level market 64505
- Active inventory
- 126
- Price-to-rent
- 11.6×
Monthly cashflow live
- Estimated rent
- $929 medium interval (Pro) →
- Mortgage (P&I)
- −$681
- Tax from tax record
- −$137 /mo · $1,644/yr
- Insurance
- −$54
- HOA
- −$0
- Vacancy / Maint / Mgmt
- −$195
- Net cashflow
- $-138
Break-even live
Sensitivity live
| Price | -10% $-65 | -5% $-101 | +0% $-138 | +5% $-175 | +10% $-212 |
|---|---|---|---|---|---|
| Rent | -10% $-212 | -5% $-175 | +0% $-138 | +5% $-101 | +10% $-65 |
| Rate | -1.0pp $-73 | -0.5pp $-105 | base $-138 | +0.5pp $-172 | +1.0pp $-206 |
UW: 25.0% down · 7.5% · 30yr · 1.5% tax · 5.0% vac · 8.0% maint · 8.0% mgmt
Financing live
Cash to close
- Down payment
- $32,475
- Closing costs
- $3,897
- Reserves months
- —
- Total cash needed
- —
Loan-product check · same deal, 3 products live
Conventional
25% down · 7.5% · 30yr
- Down + closing
- —
- Monthly P&I
- —
- Monthly cashflow
- —
- DSCR
- —
- Eligible?
- —
Personal DTI + credit; lowest rate.
DSCR
20% down · 8.5% · 30yr
- Down + closing
- —
- Monthly P&I
- —
- Monthly cashflow
- —
- DSCR
- —
- Eligible?
- —
No personal income docs; deal must DSCR.
Hard money
10% down · 12.0% · 12mo
- Down + closing
- —
- Monthly P&I
- —
- Monthly cashflow
- —
- DSCR
- —
- Eligible?
- —
Short-term bridge; refi at stabilization.
Rent comps 3 comps
| Address | Beds | Baths | Sqft | Rent | $/sqft | DOM | Units | Dist |
|---|---|---|---|---|---|---|---|---|
| 917 N 24th St Unit 1 St Joseph, MO | 2.0 | 1.0 | 933 | $925 | $0.99 | 44d | 1 | 1.29mi |
| 2901 Frederick Ave Saint Joseph, MO | 2.0–3.0 | 1.0 | 900 | $1,000 | $1.11 | 44d | 1 | 1.39mi |
| 1416 N 3rd St Unit 1418 St Joseph, MO | 2.0 | 1.0 | 750 | $850 | $1.13 | 44d | 1 | 1.39mi |
Listing history 18 events
-
2026-06-19days on market $129,900 Active 77 DOM
-
2026-06-18days on market $129,900 Active 76 DOM
-
2026-06-17days on market $129,900 Active 75 DOM
-
2026-06-16days on market $129,900 Active 74 DOM
-
2026-06-16price $129,900 Active 73 DOM
-
2026-06-15days on market $139,900 Active 73 DOM
-
2026-06-14days on market $139,900 Active 71 DOM
-
2026-06-12days on market $139,900 Active 70 DOM
-
2026-06-09days on market $139,900 Active 67 DOM
-
2026-06-08days on market $139,900 Active 66 DOM
-
2026-06-07days on market $139,900 Active 65 DOM
-
2026-06-03days on market $139,900 Active 61 DOM
-
2026-06-02days on market $139,900 Active 60 DOM
-
2026-06-01days on market $139,900 Active 59 DOM
-
2026-05-31days on market $139,900 Active 58 DOM
-
2026-05-30days on market $139,900 Active 57 DOM
-
2026-04-03$139,900 Active 166-char remark
Show marketing remark (166 chars)
RAISED RANCH WITH 3 BEDROOMS, 2.5 BATHROOMS, FINISHED BASEMENT, PARTIALLY FENCED YARD, 2 CAR ATTACHED GARAGE, CENTRALLY LOCATED, DECK OF THE KITCHEN FOR ENTERTAINING.
-
1999-05-12soldstatus
ⓘ Source: listings_history table (triggers on properties + properties_extension) + one-shot
backfill from property_details.listing_events for pre-trigger history.
Tax reassessment forecast MO · Resets to sale price
- Current annual tax
- $1,644 · $137/mo
- Projected year-2 tax
- $1,644 · $137/mo
- Expected delta
- $0/yr ($0/mo · 0.0%)
ⓘ Screening estimate from a state-policy table — verify with the county assessor before closing.
Climate risk First Street
- Flood 1/10 Low FEMA zone X · 0% chance over 30 yrs
- Wildfire 1/10 Low
- Heat 3/10 Moderate 7 d/yr ≥106°F today · 16 d/yr by 30 yrs out
- Wind 2/10 Low
- Air quality 2/10 Low 1 unhealthy d/yr today · 1 by 30 yrs out
Nearby sold comps map
Loading sold comps map…
Walkable amenities ~0.75 mi
Loading nearby amenities…
Taxation est. · year 1
- Rental income
- $11,152
- − Mortgage interest
- −$7,276
- − Property taxes
- −$1,644
- − Insurance
- −$650
- − Repairs & maintenance
- −$892
- − Management
- −$892
- − Depreciation
- −$3,779
- Taxable loss
- −$3,981
- Est. tax savings @ 24.0%
- +$956
- After-tax cash flow
- $-703/yr
For passive investors: Depreciation is non-cash, so a rental often shows a tax loss while cash-flowing — sheltering income. Rental losses are passive: they offset passive income freely, and up to $25,000/yr can offset ordinary (W-2) income if you actively participate and your MAGI is under $100k (phasing out to $0 by $150k); unused losses carry forward. On sale, claimed depreciation is recaptured at up to 25%, and gains may owe capital-gains tax (a 1031 exchange can defer both). Figures are a year-1 estimate at your 24.0% rate — not tax advice; consult a CPA.
Schools (NCES district)
- District
- St. Joseph
- NCES district ID
- 2927060
- Math proficiency
- 28% ▼ -6.00%
- Reading proficiency
- 38% ▼ -1.00%
- Median HH income
- $43,007
- Composite
- 27.99/100
- National rank
- #6853
- State rank
- #241 of 324 in MO
Livability — St. Joseph
No livability data for this city. (Only ~50 U.S. cities are tracked.)
Census & demographics
- Census place
- St. Joseph, MO
- City population
- 44,382
- Population (ZIP)
- 13,875
Population outlook (Buchanan County) Hauer SSP2
- Today (2025)
- 89,041 people
- By 2030
- 88,401 · -0.7%
- By 2040
- 86,220 · -3.2%
- By 2050
- 83,603 · -6.1%
- By 2075
- 76,750 · -13.8%
- By 2100
- 67,623 · -24.1%
Race, ethnicity, and origin ACS 2023
- Neighborhood character
- Predominantly White (81%)
- Race & ethnicity
- White 81% Hispanic / Latino 8% Two or more races 6% Black 3% Asian 3% Pacific Islander 1%
- Hispanic origin (detail)
- Mexican 6%
- Common ancestry
- Slovak 2% Lithuanian 2% Portuguese 1%
- Foreign-born
- 4% · Canada, China
- Languages at home
- 92% English-only · Spanish 5% Chinese 2% Other Asian/Pacific 1%
Political lean MEDSL · Buchanan
- 2024 margin
- Strong R (+28.0) · D 35.2% · R 63.3% · Other 1.5%
- 2008→2024 swing
- -28.2pp toward R · 2008: 0.1pp · 2024: -28.0pp
- All cycles
- 2024: R+28.0 2020: R+24.6 2016: R+26.2 2012: R+8.7 2008: D+0.1
Not yet ingested
- Civics
- —
Market trends
- HPI YoY
- ▼ -139.45%
- Current HPI
- 207.1403
- Rent YoY
- —
- Metro
- —
- State GDP YoY
- ▲ 1.84%
- F500 in state
- 20
Industry mix (Fortune 500 HQ in MO)
| Industry | F500 HQs | Revenue |
|---|---|---|
| Healthcare | 1 | $163B |
|
||
| Insurance | 1 | $21B |
|
||
| Industrial Technology | 1 | $17B |
|
||
| Retail | 1 | $16B |
|
||
| Industrial Distribution | 1 | $10B |
|
||
| Utilities | 1 | $9B |
|
||
Price history
2 events — show timeline
- 2026-04-03 Listed $139,900 Heartland MLS as Distributed by MLS Grid
- 1999-05-12 Sold (Public Records) — Public Records
Property tax history
+1.5%/yrLatest (2025): $1,644 · +6.1% YoY. Source: county tax records.
Cash-flow waterfall
monthlySold comps — $/sqft
last 12 mo · ≤1 miLoading sold comps…