 🔨 Auction
6025 Winchester Rd NW · Carroll, OH
Flood risk 10/10 · Severe
- FEMA flood zone
- X (unshaded)
- Chance of flooding over 30 yrs
- 0.99%
- Est. flood insurance / yr
- $507 – $1,088
Fire risk 1/10 · Minimal
- Est. fire insurance / yr
- $713 – $1,323
Heat risk 3/10 · Minor
- Hot days now (above 99°F)
- 7 days/yr
- Hot days in 30 yrs
- 18 days/yr
Wind risk 2/10 · Minimal
- Chance of severe wind over 30 yrs
- 1.0%
Air-quality risk 2/10 · Minimal
- Unhealthy air days now
- 1 days/yr
- Unhealthy air days in 30 yrs
- 2 days/yr
Risk factors via First Street. Map © Google.
Why this score? — see what drove the F grade
The composite is a weighted blend of 9 inputs, each scored 0–100. Each bar is that input's sub-score; the figure is the points it added to the 100-point composite (weight × sub-score).
- ARV discount +7.5/15.0
- Schools +5.7/10.0
- Livability +3.2/5.0
- Rent growth +2.5/5.0
- Cash flow +2.1/30.0
- Condition / age +1.0/5.0
- 1% rule +0.0/10.0
- DSCR +0.0/10.0
- Appreciation +0.0/10.0
$60,000
🖨 Deal sheet (PDF) 📄 Offer letter ✓ Due diligence
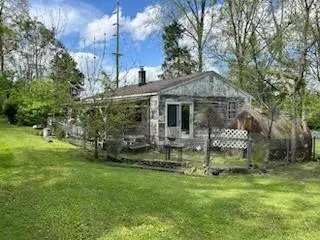
Listing remarks
Auction Wed. May 27th 2026 @ 5pm, at the property. 3 BR 1 BA ranch style home with 1192 SF. Situated on 2 Parcels totaling 7.02 acres. 60 X 100 pole building and another small building. Home will need work. Tons of potential. Convenient to Rt 33. Bloom Carroll Schools. Reserve 60K. Terms 2500.00 DN (Cashiers check to Howard Hanna) Balance due at closing within 30 days. Sold as is in all respects. Seller is not taking offers prior to auction.
Key facts
- 2 parcels
- 7.02 acres
- Ranch style home
Tags
Property features AI
Finance
- Other: Listing offered via auction and standard sale
- Financial info: Taxes recorded for 2025
Exterior
- Parking: Farm building for parking
- Utilities: Private sewer; Well water
- Home design: Single-family residence; One level; Built in 1961; No shared/common walls
- Construction: Block foundation
- Exterior features: Lot size about 7.02 acres; Additional parcel included
Interior
- Bedrooms: 3 main-level bedrooms
- Flooring: Wood flooring; Carpet flooring
- Bathrooms: 1 full bathroom
- Heating & cooling: Oil heating
- Interior features: Crawl space basement; Living area approximately 1,192
Neighborhood map
What this means for you Summary
Snapshot
- This is a 3-bed/1.0-bath single-family listed at $60k. Condition is rated poor.
Deal economics
- At list price, monthly cash flow is $-1k ($-13k/yr) — negative.
- The deal already cash-flows at list — no discount required.
- Meets the 1% rule at list price ($1k rent vs $60k).
- Recommended offer: $59k (1.5% below list) — sets the bar for market timing.
Location & tenants
- Location reads 65/100 on livability (#733 in OH) — a middle-class / working-renter tenant base. Strengths: cost of living A+, housing A+, schools A-; Watch: employment C-, amenities F, commute F.
- Bloom-Carroll Local (rural): math 58% / reading 71% proficiency, ranked #179 of 656 in OH (top 27%) — acceptable for families but not a draw, mixed tenant base, ~2y average lease; only 16% free/reduced lunch — higher-income household profile.
- Market conditions: 20 active listings in the ZIP; solid renter incomes; 475 units permitted in Fairfield County in 2024 (0 in 5+ unit buildings).
- This rent is only 14% of the median local income ($98k/yr) — well below the 30% rent-burden line; pricing power to push rent on renewal without tenant pushback.
Forward outlook
- Local home prices are declining (-3.0%/yr); year-one equity from $2k of loan paydown is wiped out by about $8k of value loss. Plan a longer hold.
- Fairfield County population projected at +8% by 2050 — modest demand growth; plan on rents tracking national, not racing it.
Negotiation context
- It's been on market 29 days — a 2% lower offer ($59k) is reasonable based on typical stale-listing flexibility.
Risks & watch-outs
- Watch-outs: property tax is 7.0% of price; flood insurance adds $66/mo.
- Climate carrying-cost: severe flood risk — expect insurance premiums to compound above CPI over the hold.
Questions for the listing agent
- What do current leases actually rent for vs. the listed asking? Can we see a recent rent roll and the last 12 months of T-12 income?
- Have any recent inspections been done? Can we get a copy of the seller's disclosures and any deferred-maintenance estimates?
- Built in 1961 — when were the roof, HVAC, electrical panel, plumbing, and water heater last replaced?
- Property tax is high relative to price — has the assessment been appealed recently, and will the sale trigger a re-assessment?
- What's the actual annual flood-insurance premium (NFIP or private), and is the property in a SFHA with mandatory coverage?
- Is there a deadline driving the sale (1031 exchange, divorce, estate, relocation)? That informs how much negotiation room exists.
- Schools are A-rated — typically a magnet for longer-tenancy family renters. What's the average tenant stay here, and is there a school-zone premium baked into asking?
- The area grade is low — what's the realistic commute time and amenity access for the typical tenant pool here? Any planned neighborhood developments (good or bad) we should know about?
- What's the average days-on-market for RENTAL listings here right now (not sales)? A rising rental-DOM trend means longer vacancies and softer asking-rent achievability than the comps imply.
- What's the recent tenant-quality profile in this submarket — average credit score on applications, eviction rate, late-payment / NSF rate, and stable-employment percentage? A property-management company in the area should have these aggregated.
- How much new for-sale + rental construction is in the pipeline within 1–3 miles? Heavy new supply typically softens prices + rents 12–24 months out; constrained supply supports both.
Investment metrics
- 1% rule
- 0.41% ✗
- Cap rate
- 1.90%
- Cash-on-cash
- -15.70%
- DSCR
- 0.30
- GRM
- 20.3
CMA / ARV
- ARV (median comp)
- $281,250
- List price
- $60,000
- Delta
- -78.67%
- Verdict
- UNDERPRICED
- Comps
- 17 within 1.0 mi
Show comp detail 6 sales within ~0.75 mi
| Address | Dist | Beds/Ba | Sqft | Sold | Price | $/sf | Match |
|---|---|---|---|---|---|---|---|
| 71 Market St | 0.25mi | 3/2.0 | 1,170 (-2%) | 11mo | $285,000 | $244 | 72 |
| 61 Highland St | 0.37mi | 2/1.0 (-1) | 1,230 (+3%) | 2mo | $320,000 | $260 | 71 |
| 64 1/2 N Beaver St | 0.45mi | 3/2.0 | 1,176 (-1%) | 10mo | $274,900 | $234 | 64 |
| 6415 Winchester Rd NW | 0.46mi | 3/1.5 | 1,296 (+9%) | 8mo | $307,000 | $237 | 56 |
| 53 S Beaver St | 0.43mi | 3/1.5 | 1,370 (+15%) | 8mo | $315,000 | $230 | 46 |
| 70 Highland St | 0.39mi | 2/2.0 (-1) | 1,356 (+14%) | 16mo | $304,000 | $224 | 37 |
Match score weights: distance 35% · size 25% · config 20% · recency 20%. Top-matched comps best support the ARV.
Projected returns pro-forma
-3.0% appreciation · 3.0% rent growth · sell at horizon
- IRR
- -49.2%
- Equity multiple
- -0.46×
- Total profit
- $-115,360
- Equity at exit
- $41,935
- IRR
- -96.2%
- Equity multiple
- -1.41×
- Total profit
- $-190,151
- Equity at exit
- $24,317
Cash invested: $78,750 (down + closing). Projections, not guarantees.
Landlord ↔ Tenant lean methodology
- Overall (STATE)
- 73 Landlord-Friendly
- State Ohio
- 73 Landlord-Friendly · R+6
- County
- — inherits STATE
- City
- — inherits STATE
ZIP-level market 43112
- Home prices YoY
- -30.8%
- Active inventory
- 20
- Price-to-rent
- 4.3×
Monthly cashflow live
- Estimated rent
- $1,156 medium interval (Pro) →
- Mortgage (P&I)
- −$1,475
- Tax est. 1.5%
- −$352 /mo · $4,219/yr
- Insurance
- −$117
- Flood insurance flood zone
- −$66 /mo · $798/yr
- HOA
- −$0
- Vacancy / Maint / Mgmt
- −$243
- Net cashflow
- $-1,097
Break-even live
Sensitivity live
| Price | -10% $-902 | -5% $-999 | +0% $-1,097 | +5% $-1,194 | +10% $-1,291 |
|---|---|---|---|---|---|
| Rent | -10% $-1,188 | -5% $-1,142 | +0% $-1,097 | +5% $-1,051 | +10% $-1,005 |
| Rate | -1.0pp $-955 | -0.5pp $-1,025 | base $-1,097 | +0.5pp $-1,169 | +1.0pp $-1,244 |
UW: 25.0% down · 7.5% · 30yr · 1.5% tax · 5.0% vac · 8.0% maint · 8.0% mgmt
Financing live
Cash to close
- Down payment
- $70,312
- Closing costs
- $8,437
- Reserves months
- —
- Total cash needed
- —
Loan-product check · same deal, 3 products live
Conventional
25% down · 7.5% · 30yr
- Down + closing
- —
- Monthly P&I
- —
- Monthly cashflow
- —
- DSCR
- —
- Eligible?
- —
Personal DTI + credit; lowest rate.
DSCR
20% down · 8.5% · 30yr
- Down + closing
- —
- Monthly P&I
- —
- Monthly cashflow
- —
- DSCR
- —
- Eligible?
- —
No personal income docs; deal must DSCR.
Hard money
10% down · 12.0% · 12mo
- Down + closing
- —
- Monthly P&I
- —
- Monthly cashflow
- —
- DSCR
- —
- Eligible?
- —
Short-term bridge; refi at stabilization.
Listing history 1 events
-
2026-04-29$60,000 Active 445-char remark
ⓘ Source: listings_history table (triggers on properties + properties_extension) + one-shot
backfill from property_details.listing_events for pre-trigger history.
Climate risk First Street
- Flood 10/10 Extreme FEMA zone X (unshaded) · 99% chance over 30 yrs
- Wildfire 1/10 Low
- Heat 3/10 Moderate 7 d/yr ≥99°F today · 18 d/yr by 30 yrs out
- Wind 2/10 Low 100% chance of damaging wind over 30 yrs
- Air quality 2/10 Low 1 unhealthy d/yr today · 2 by 30 yrs out
Nearby sold comps map
Loading sold comps map…
Walkable amenities ~0.75 mi
Loading nearby amenities…
Taxation est. · year 1
- Rental income
- $13,876
- − Mortgage interest
- −$15,754
- − Property taxes
- −$4,219
- − Insurance
- −$2,204
- − Repairs & maintenance
- −$1,110
- − Management
- −$1,110
- − Depreciation
- −$8,182
- Taxable loss
- −$18,703
- Est. tax savings @ 24.0%
- +$4,489
- After-tax cash flow
- $-8,671/yr
For passive investors: Depreciation is non-cash, so a rental often shows a tax loss while cash-flowing — sheltering income. Rental losses are passive: they offset passive income freely, and up to $25,000/yr can offset ordinary (W-2) income if you actively participate and your MAGI is under $100k (phasing out to $0 by $150k); unused losses carry forward. On sale, claimed depreciation is recaptured at up to 25%, and gains may owe capital-gains tax (a 1031 exchange can defer both). Figures are a year-1 estimate at your 24.0% rate — not tax advice; consult a CPA.
Condition & rehab AI · 13 photos
This property requires extensive repairs and updates to its exterior, interior, and systems, significantly impacting its current condition and value. Significant investment is needed to bring it up to a livable standard.
Repairs flagged
- Major exterior siding — The siding is visibly damaged and peeling, indicating a major repair is needed.
- Major roof — The roof shows significant damage, requiring a major repair or replacement.
- Major interior walls and paint — The interior walls and paint are in poor condition, indicating a major repair or replacement is needed.
- Major HVAC and mechanical systems — The overall condition suggests these systems may need significant repair or replacement.
Value-add opportunities
- Both exterior siding and roof repair/replacement — These repairs will significantly improve the home's curb appeal and overall condition, making it more attractive to potential buyers and renters.
- Both interior paint and wall repair — Updating the interior paint and walls will improve the home's appearance and make it more marketable for both resale and rental.
- Both HVAC and mechanical systems repair or replacement — Upgrading the HVAC and mechanical systems will improve the home's comfort and energy efficiency, making it more attractive to potential buyers and renters.
Renovation cost estimate screening
| Repair item | Severity | Est. cost |
|---|---|---|
| exterior siding · The siding is visibly damaged and peeling, indicating a major repair is needed. | Major | $15,000–50,000 |
| roof · The roof shows significant damage, requiring a major repair or replacement. | Major | $15,000–50,000 |
| interior walls and paint · The interior walls and paint are in poor condition, indicating a major repair or replacement is needed. | Major | $15,000–50,000 |
| HVAC and mechanical systems · The overall condition suggests these systems may need significant repair or replacement. | Major | $15,000–50,000 |
| Total estimated repair cost · 4 items | $60,000–200,000 |
Value-add ROI direction
- Both exterior siding and roof repair/replacement — These repairs will significantly improve the home's curb appeal and overall condition, making it more attractive to potential buyers and renters. ↑
- Both interior paint and wall repair — Updating the interior paint and walls will improve the home's appearance and make it more marketable for both resale and rental. ↑
- Both HVAC and mechanical systems repair or replacement — Upgrading the HVAC and mechanical systems will improve the home's comfort and energy efficiency, making it more attractive to potential buyers and renters. ↑
ⓘ Cost ranges are severity-bucket heuristics (US national rule-of-thumb). Get contractor quotes + a written scope before underwriting a rehab budget.
Schools (NCES district)
- District
- Bloom-Carroll Local
- NCES district ID
- 3904686
- Math proficiency
- 58% ▼ -15.00%
- Reading proficiency
- 71% ▼ -5.00%
- Median HH income
- $76,614
- Composite
- 57.3/100
- National rank
- #1089
- State rank
- #179 of 656 in OH
Livability — Carroll
- Score
- 65/100
- State rank
- #733
- US rank
- #13250
Category grades
Schools grade is shown separately in the Schools card above.
Census & demographics
- County
- Fairfield · 186,676 people
- Metro
- Columbus, OH
- Population (ZIP)
- 4,961
- Household income
- $98,430
- Rent vs Own
- Severe rent burden
- 1.9
Population outlook (Fairfield County) Hauer SSP2
- Today (2025)
- 162,442 people
- By 2030
- 166,796 · +2.7%
- By 2040
- 172,835 · +6.4%
- By 2050
- 174,822 · +7.6%
- By 2075
- 174,938 · +7.7%
- By 2100
- 160,988 · -0.9%
Race, ethnicity, and origin ACS 2023
- Neighborhood character
- Predominantly White (99%)
- Race & ethnicity
- White 99%
- Common ancestry
- Slovak 3% Romanian 2% Italian 2%
- Foreign-born
- 0%
- Languages at home
- 99% English-only · Spanish 1%
Political lean MEDSL · Fairfield
- 2024 margin
- Strong R (+24.1) · D 37.5% · R 61.6%
- 2008→2024 swing
- -6.9pp toward R · 2008: -17.1pp · 2024: -24.1pp
- All cycles
- 2024: R+24.1 2020: R+23.5 2016: R+27.0 2012: R+16.1 2008: R+17.1
Not yet ingested
- Civics
- —
Market trends
- HPI YoY
- ▼ -111.28%
- Current HPI
- 250.5075
- Rent YoY
- —
- Metro
- —
- State GDP YoY
- ▲ 1.98%
- F500 in state
- 48
Industry mix (Fortune 500 HQ in OH)
| Industry | F500 HQs | Revenue |
|---|---|---|
| Insurance | 3 | $145B |
|
||
| Industrial Machinery | 3 | $49B |
|
||
| Financial Services | 3 | $24B |
|
||
| Consumer Goods | 2 | $93B |
|
||
| Aerospace / Defense | 2 | $47B |
|
||
| Utilities | 2 | $33B |
|
||
Price history
2 events — show timeline
- 2026-05-28 Pending — CBRMLS
- 2026-04-29 Listed $60,000 CBRMLS
Cash-flow waterfall
monthlySold comps — $/sqft
last 12 mo · ≤1 miLoading sold comps…