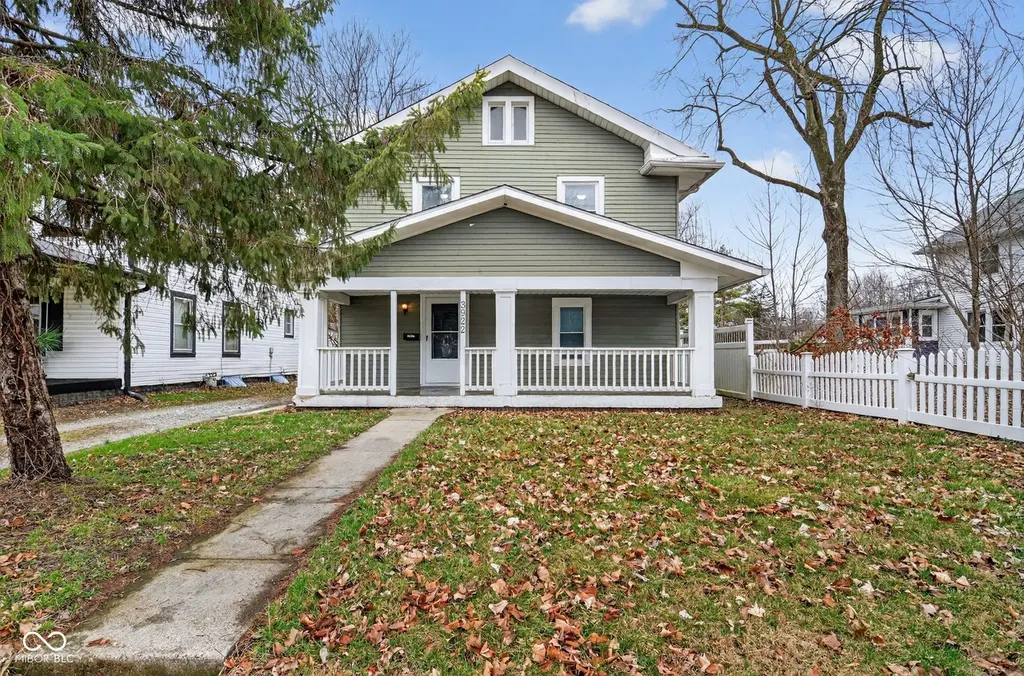
3922 Rookwood Ave · Indianapolis city (balance), IN
Flood risk 4/10 · Minor
- FEMA flood zone
- X (unshaded)
- Chance of flooding over 30 yrs
- 0.22%
- Est. flood insurance / yr
- $473 – $860
Fire risk 1/10 · Minimal
- Est. fire insurance / yr
- $717 – $1,331
Heat risk 4/10 · Minor
- Hot days now (above 101°F)
- 7 days/yr
- Hot days in 30 yrs
- 19 days/yr
Wind risk 2/10 · Minimal
- Chance of severe wind over 30 yrs
- 0.0%
Air-quality risk 4/10 · Minor
- Unhealthy air days now
- 5 days/yr
- Unhealthy air days in 30 yrs
- 7 days/yr
Risk factors via First Street. Map © Google.
Why this score? — see what drove the C- grade
The composite is a weighted blend of 9 inputs, each scored 0–100. Each bar is that input's sub-score; the figure is the points it added to the 100-point composite (weight × sub-score).
- Cash flow +15.5/30.0
- ARV discount +14.6/15.0
- 1% rule +5.4/10.0
- DSCR +4.8/10.0
- Rent growth +4.1/5.0
- Livability +2.5/5.0
- Condition / age +2.5/5.0
- Schools +1.4/10.0
- Appreciation +0.0/10.0
$189,900
🖨 Deal sheet (PDF) 📄 Offer letter ✓ Due diligence
Listing remarks
Positioned at 3922 Rookwood AVE, INDIANAPOLIS, IN, USA, this single family residence presents itself as an inviting home, thoroughly prepared for immediate enjoyment. The living room presents an atmosphere of refined comfort, where elegant crown molding enhances the architectural details, providing a sense of timeless sophistication. A welcoming fireplace stands ready to offer warmth and a focal point for relaxation, creating a perfect setting for quiet evenings. The kitchen, a space designed for daily living, features tasteful crown molding that adds a touch of classic elegance. This area provides a practical and pleasing environment for preparing meals and enjoying everyday moments. Const
Key facts
- Luminous sunroom
- Charming porch
- Welcoming fireplace
Tags
Property features AI
Exterior
- Parking: No parking
- Utilities: Public water; Municipal sewer connected; Solid waste service available
- Home design: Single family residence; Two levels
- Construction: Vinyl siding; Block foundation
- Exterior features: Lot under 1/4 acre (0.2 acres)
Interior
- Kitchen: Refrigerator; Dishwasher; Range hood
- Bedrooms: Three bedrooms on the upper level (one is 13x13, another 11x13, another 13x11)
- Bathrooms: One full bath (upper level); One half bath (main level)
- Heating & cooling: Forced air heating; Central air conditioning
- Interior features: Living room fireplace; Unfinished basement with interior entry; Smoke alarm; Has a view
- Laundry & utility: Gas water heater; Water heater
Neighborhood map
What this means for you Summary
Snapshot
- This is a 6-bed/1.5-bath single-family listed at $190k.
Deal economics
- At list price, monthly cash flow is $76 ($906/yr) — positive.
- The deal already cash-flows at list — no discount required.
- Meets the 1% rule at list price ($2k rent vs $190k).
- Recommended offer: $184k (3.0% below list) — sets the bar for market timing.
- Cap rate 6.8% vs local median 4.4% in Indianapolis city (balance) — top-decile yield for the area; either an underpriced asset or a hidden risk that comps aren't pricing in. Stress-test before assuming the spread holds.
Location & tenants
- Location reads: area grade C — affects rentability + tenant quality, not the cash-flow math above.
- Indianapolis Public Schools (urban): math 14% / reading 20% proficiency, ranked #286 of 301 in IN (top 95%) — low school quality limits family demand, transient renter base, plan for 1-2y turnover; 77% free/reduced lunch — lower-income household profile, screen leases tightly.
- Zoned schools: Center For Inquiry School 84 (math 64% / reading 69%, grade B+, #65 of 994 statewide, top 7%, 469 students, 8% FRL); H L Harshman Middle School (math 3% / reading 16%, grade F, #316 of 330 statewide, top 96%, 549 students, 84% FRL) — zoned schools average 46% FRL vs 77% district-wide (31 pts lower); this property's tenant base skews higher-income than the district average.
- Zoned-school proficiency averages 38% at this address vs 17% district-wide (+21 pts) — the actual schools serving this property are materially stronger than the Indianapolis Public Schools average implies; a family-tenant draw the district grade alone would hide.
- Market conditions: Rents rising fast (+6.4%/yr); 283 active listings in the ZIP; 1,906 units permitted in Marion County in 2024 (621 in 5+ unit buildings).
- This rent runs 39% of the median local income ($60k/yr) — at the standard rent-burdened threshold; future hikes will face affordability resistance.
Forward outlook
- Local home prices are declining (-3.0%/yr); year-one equity from $1k of loan paydown is wiped out by about $6k of value loss. Plan a longer hold.
- Marion County population projected at +18% by 2050 — long-run rental-demand tailwind backs the buy-and-hold thesis.
Negotiation context
- It's been on market 42 days — a 3% lower offer ($184k) is reasonable based on typical stale-listing flexibility.
- 4 sale attempts since 23y ago; this cycle's ask has dropped $10k (5%) from the opening price — seller is motivated, your offer sets the floor, not the list.
- Current owner paid $38k; list at $190k implies a 400% gain — meaningful room to come down on a strong offer.
Risks & watch-outs
- Watch-outs: property tax is 2.6% of price; built in 1920 — expect roof / HVAC / electrical / plumbing capex.
Questions for the listing agent
- It's been on market 42 days. Have you received any prior offers? Is the seller open to a 3% concession, seller financing, or rate buy-down credit?
- Built in 1920 — when were the roof, HVAC, electrical panel, plumbing, and water heater last replaced?
- Property tax is high relative to price — has the assessment been appealed recently, and will the sale trigger a re-assessment?
- Is there a deadline driving the sale (1031 exchange, divorce, estate, relocation)? That informs how much negotiation room exists.
- What's the average days-on-market for RENTAL listings here right now (not sales)? A rising rental-DOM trend means longer vacancies and softer asking-rent achievability than the comps imply.
- What's the recent tenant-quality profile in this submarket — average credit score on applications, eviction rate, late-payment / NSF rate, and stable-employment percentage? A property-management company in the area should have these aggregated.
- How much new for-sale + rental construction is in the pipeline within 1–3 miles? Heavy new supply typically softens prices + rents 12–24 months out; constrained supply supports both.
Investment metrics
- 1% rule
- 1.04% ✓
- Cap rate
- 6.77%
- Cash-on-cash
- 1.70%
- DSCR
- 1.08
- GRM
- 8.0
CMA / ARV
- ARV (on-the-fly)
- $225,624
- Comps found
- 1
Show comp detail 1 sale within ~0.75 mi
| Address | Dist | Beds/Ba | Sqft | Sold | Price | $/sf | Match |
|---|---|---|---|---|---|---|---|
| 3442 N Capitol Ave | 0.68mi | 5/4.0 (-1) | 2,025 (+7%) | 11mo | $240,000 | $119 | 33 |
Match score weights: distance 35% · size 25% · config 20% · recency 20%. Top-matched comps best support the ARV.
Projected returns pro-forma
-3.0% appreciation · 6.43% rent growth · sell at horizon
- IRR
- -9.3%
- Equity multiple
- 0.65×
- Total profit
- $-18,781
- Equity at exit
- $28,315
- IRR
- 4.7%
- Equity multiple
- 1.40×
- Total profit
- $21,421
- Equity at exit
- $16,419
Cash invested: $53,172 (down + closing). Projections, not guarantees.
Landlord ↔ Tenant lean methodology
- Overall (STATE)
- 90 Strongly Landlord-Friendly
- State Indiana
- 90 Strongly Landlord-Friendly · R+11
- County
- — inherits STATE
- City
- — inherits STATE
ZIP-level market 46208
- Rents YoY
- 6.4%
- Active inventory
- 283
- Price-to-rent
- 8.0×
Monthly cashflow live
- Estimated rent
- $1,974 medium interval (Pro) →
- Mortgage (P&I)
- −$996
- Tax from tax record
- −$409 /mo · $4,909/yr
- Insurance
- −$79
- HOA
- −$0
- Vacancy / Maint / Mgmt
- −$415
- Net cashflow
- $76
Break-even live
Sensitivity live
| Price | -10% $183 | -5% $129 | +0% $76 | +5% $22 | +10% $-32 |
|---|---|---|---|---|---|
| Rent | -10% $-80 | -5% $-2 | +0% $76 | +5% $153 | +10% $231 |
| Rate | -1.0pp $171 | -0.5pp $124 | base $76 | +0.5pp $26 | +1.0pp $-24 |
UW: 25.0% down · 7.5% · 30yr · 1.5% tax · 5.0% vac · 8.0% maint · 8.0% mgmt
Financing live
Cash to close
- Down payment
- $47,475
- Closing costs
- $5,697
- Reserves months
- —
- Total cash needed
- —
Loan-product check · same deal, 3 products live
Conventional
25% down · 7.5% · 30yr
- Down + closing
- —
- Monthly P&I
- —
- Monthly cashflow
- —
- DSCR
- —
- Eligible?
- —
Personal DTI + credit; lowest rate.
DSCR
20% down · 8.5% · 30yr
- Down + closing
- —
- Monthly P&I
- —
- Monthly cashflow
- —
- DSCR
- —
- Eligible?
- —
No personal income docs; deal must DSCR.
Hard money
10% down · 12.0% · 12mo
- Down + closing
- —
- Monthly P&I
- —
- Monthly cashflow
- —
- DSCR
- —
- Eligible?
- —
Short-term bridge; refi at stabilization.
Listing history 12 events
-
2026-04-29status Pending
-
2026-04-16price $189,900
-
2026-04-06price $194,900
-
2026-03-17$199,900 Active
-
2020-11-25historical
-
2020-11-24status Pending
-
2020-11-04status Pending
-
2020-11-04$950,000 Active
-
2018-07-16status Pending
-
2018-05-25$1,100,000 Active
-
2003-03-26soldstatus $38,000
-
2003-02-07$39,900
ⓘ Source: listings_history table (triggers on properties + properties_extension) + one-shot
backfill from property_details.listing_events for pre-trigger history.
Tax reassessment forecast IN · Partial reset (capped growth)
- Current annual tax
- $4,909 · $409/mo
- Projected year-2 tax
- $4,909 · $409/mo
- Expected delta
- $0/yr ($0/mo · 0.0%)
ⓘ Screening estimate from a state-policy table — verify with the county assessor before closing.
Climate risk First Street
- Flood 4/10 Moderate FEMA zone X (unshaded) · 22% chance over 30 yrs
- Wildfire 1/10 Low
- Heat 4/10 Moderate 7 d/yr ≥101°F today · 19 d/yr by 30 yrs out
- Wind 2/10 Low 0% chance of damaging wind over 30 yrs
- Air quality 4/10 Moderate 5 unhealthy d/yr today · 7 by 30 yrs out
Nearby sold comps map
Loading sold comps map…
Walkable amenities ~0.75 mi
Loading nearby amenities…
Taxation est. · year 1
- Rental income
- $23,689
- − Mortgage interest
- −$10,637
- − Property taxes
- −$4,909
- − Insurance
- −$950
- − Repairs & maintenance
- −$1,895
- − Management
- −$1,895
- − Depreciation
- −$5,524
- Taxable loss
- −$2,121
- Est. tax savings @ 24.0%
- +$509
- After-tax cash flow
- $1,415/yr
For passive investors: Depreciation is non-cash, so a rental often shows a tax loss while cash-flowing — sheltering income. Rental losses are passive: they offset passive income freely, and up to $25,000/yr can offset ordinary (W-2) income if you actively participate and your MAGI is under $100k (phasing out to $0 by $150k); unused losses carry forward. On sale, claimed depreciation is recaptured at up to 25%, and gains may owe capital-gains tax (a 1031 exchange can defer both). Figures are a year-1 estimate at your 24.0% rate — not tax advice; consult a CPA.
Schools (NCES district)
- District
- Indianapolis Public Schools
- NCES district ID
- 1804770
- Math proficiency
- 14% ▼ -7.00%
- Reading proficiency
- 20% ▼ -3.00%
- Median HH income
- $32,034
- Composite
- 13.69/100
- National rank
- #9499
- State rank
- #286 of 301 in IN
Livability — Indianapolis city (balance)
No livability data for this city. (Only ~50 U.S. cities are tracked.)
Census & demographics
- Census place
- Indianapolis city (balance), IN
- County
- Marion County · 998,460 people
- City population
- 881,119
- Metro
- Indianapolis-Carmel-Anderson, IN
- Population (ZIP)
- 22,379
- Household income
- $60,062
- Rent vs Own
- Severe rent burden
- 978.0
Population outlook (Marion County) Hauer SSP2
- Today (2025)
- 1,025,572 people
- By 2030
- 1,065,727 · +3.9%
- By 2040
- 1,141,577 · +11.3%
- By 2050
- 1,208,920 · +17.9%
- By 2075
- 1,367,288 · +33.3%
- By 2100
- 1,438,201 · +40.2%
Race, ethnicity, and origin ACS 2023
- Neighborhood character
- Diverse neighborhood (Simpson 0.62)
- Race & ethnicity
- White 46% Black 40% Hispanic / Latino 8% Two or more races 6% Asian 2%
- Hispanic origin (detail)
- Mexican 4%
- Common ancestry
- Romanian 2% Slovak 2% Italian 1%
- Foreign-born
- 4% · Canada
- Languages at home
- 93% English-only · Spanish 5% French/Haitian/Cajun 1% Other Indo-European 1%
Political lean MEDSL · Marion
- 2024 margin
- Strong D (+27.7) · D 63.0% · R 35.3% · Other 1.7%
- 2008→2024 swing
- -0.7pp no change · 2008: 28.4pp · 2024: 27.7pp
- All cycles
- 2024: D+27.7 2020: D+29.1 2016: D+22.8 2012: D+22.2 2008: D+28.4
Not yet ingested
- Civics
- —
Market trends
- HPI YoY
- ▼ -324.63%
- Current HPI
- 319.7725
- Rent YoY
- ▲ 6.43%
- Metro
- Indianapolis-Carmel-Anderson, IN
- State GDP YoY
- ▲ 2.90%
- F500 in state
- 18
Industry mix (Fortune 500 HQ in IN)
| Industry | F500 HQs | Revenue |
|---|---|---|
| Industrial Machinery | 2 | $37B |
|
||
| Healthcare | 1 | $177B |
|
||
| Pharmaceuticals | 1 | $45B |
|
||
| Metals / Steel | 1 | $18B |
|
||
| Agriculture | 1 | $17B |
|
||
| Packaging | 1 | $12B |
|
||
Price history
+375.9% since first listed12 events — show timeline
- 2026-04-29 Pending — MIBOR as Distributed by MLS Grid
- 2026-04-16 Price Changed $189,900 MIBOR as Distributed by MLS Grid
- 2026-04-06 Price Changed $194,900 MIBOR as Distributed by MLS Grid
- 2026-03-17 Listed $199,900 MIBOR as Distributed by MLS Grid
- 2020-11-25 Listing Removed — MIBOR as Distributed by MLS Grid
- 2020-11-24 Pending — MIBOR as Distributed by MLS Grid
- 2020-11-04 Pending — MIBOR as Distributed by MLS Grid
- 2020-11-04 Listed $950,000 MIBOR as Distributed by MLS Grid
- 2018-07-16 Pending — MIBOR as Distributed by MLS Grid
- 2018-05-25 Listed $1,100,000 MIBOR as Distributed by MLS Grid
- 2003-03-26 Sold (MLS) $38,000 MIBOR as Distributed by MLS Grid
- 2003-02-07 Listed $39,900 MIBOR as Distributed by MLS Grid
Property tax history
+8.0%/yrLatest (2025): $4,909 · +22.9% YoY. Source: county tax records.
Cash-flow waterfall
monthlySold comps — $/sqft
last 12 mo · ≤1 miLoading sold comps…