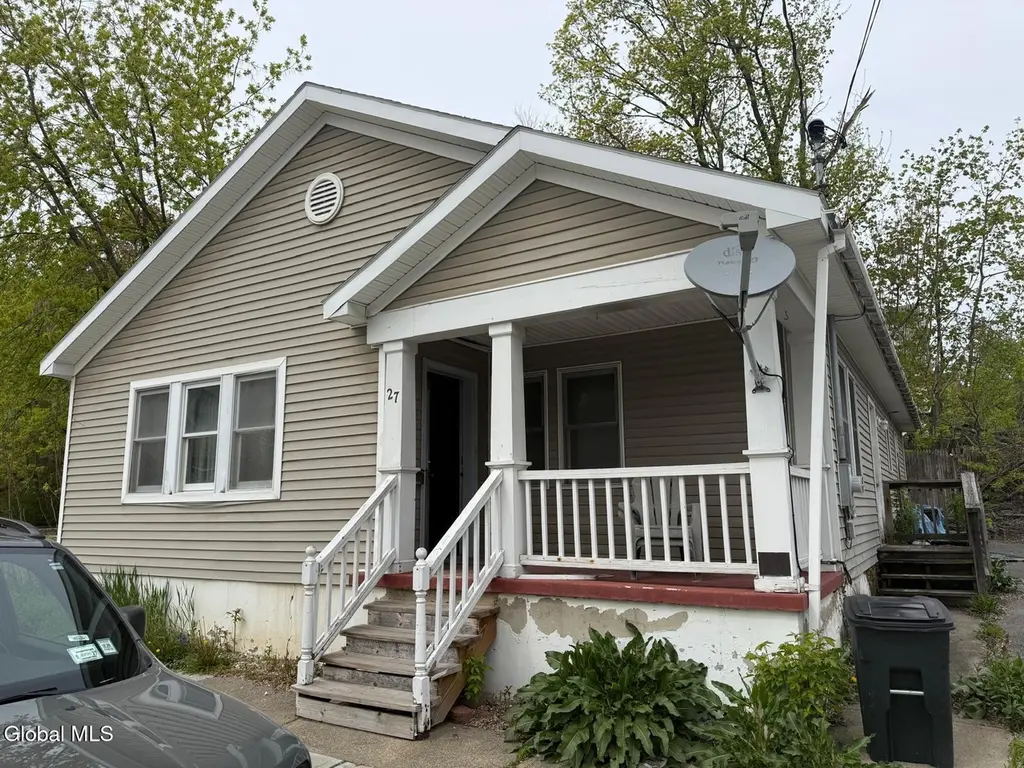
27 Osborne St · Albany, NY
Flood risk 1/10 · Minimal
- FEMA flood zone
- X (unshaded)
- Chance of flooding over 30 yrs
- 0.0%
- Est. flood insurance / yr
- $507 – $1,088
Fire risk 1/10 · Minimal
- Est. fire insurance / yr
- $691 – $1,283
Heat risk 4/10 · Minor
- Hot days now (above 98°F)
- 7 days/yr
- Hot days in 30 yrs
- 17 days/yr
Wind risk 3/10 · Minor
- Chance of severe wind over 30 yrs
- 6.0%
Air-quality risk 1/10 · Minimal
- Unhealthy air days now
- 0 days/yr
- Unhealthy air days in 30 yrs
- 0 days/yr
Risk factors via First Street. Map © Google.
Why this score? — see what drove the A grade
The composite is a weighted blend of 9 inputs, each scored 0–100. Each bar is that input's sub-score; the figure is the points it added to the 100-point composite (weight × sub-score).
- Cash flow +29.4/30.0
- ARV discount +15.0/15.0
- DSCR +10.0/10.0
- Appreciation +10.0/10.0
- 1% rule +9.6/10.0
- Rent growth +4.7/5.0
- Livability +4.0/5.0
- Schools +3.2/10.0
- Condition / age +2.5/5.0
$125,000
🖨 Deal sheet (PDF) 📄 Offer letter ✓ Due diligence
Listing remarks
Good investment property, shared driveway, Open house on Saturday 5/9/26 3:00 to 5:00
Key facts
- 8,276 sq ft lot
- Built 1996
- Listed 8 days
Property features AI
Exterior
- Utilities: Public water; Public sewer
- Home design: Single-family residence
- Construction: Vinyl siding construction
- Exterior features: Vinyl siding; Lot is approximately 0.19 acres
Interior
- Kitchen: Range
- Bedrooms: Three bedrooms on the first floor
- Bathrooms: One full bathroom on the first floor; One half bathroom on the first floor
- Heating & cooling: Natural gas heating
- Interior features: Five total rooms; Slab foundation (no basement)
Neighborhood map
What this means for you Summary
Snapshot
- This is a 3-bed/1.5-bath single-family listed at $125k.
Deal economics
- At list price, monthly cash flow is $445 ($5k/yr) — positive.
- The deal already cash-flows at list — no discount required.
- Meets the 1% rule at list price ($2k rent vs $125k).
- Cap rate 10.6% vs local median 5.7% in Albany — top-decile yield for the area; either an underpriced asset or a hidden risk that comps aren't pricing in. Stress-test before assuming the spread holds.
Location & tenants
- Location reads 79/100 on livability (#129 in NY, #2,083 nationally) — a middle-class / working-renter tenant base. Strengths: amenities A+, commute A+, housing A+; Watch: employment C-, crime F.
- Albany City School District (urban): math 37% / reading 40% proficiency, ranked #543 of 590 in NY (top 92%) — families likely to look elsewhere, expect single-tenant / working-renter base with shorter leases; 66% free/reduced lunch — lower-income household profile, screen leases tightly.
- Market conditions: Rents rising fast (+8.7%/yr); 58 active listings in the ZIP; 40 comparable units currently listed for rent nearby; rentals at typical pace (median 25d on market — plan ~3-4 weeks tenant-placement turnaround); 42% of comp listings sitting > 30 days — soft ceiling on asking rent; 675 units permitted in Albany County in 2024 (451 in 5+ unit buildings).
- This rent runs 41% of the median local income ($53k/yr) — at the standard rent-burdened threshold; future hikes will face affordability resistance.
Forward outlook
- In year one you build about $13k of equity ($864 loan paydown + $12k appreciation (10.0% local appreciation)).
- Albany County population projected at +9% by 2050 — modest demand growth; plan on rents tracking national, not racing it.
- At projected returns (10.0% appreciation + 8.0% rent growth), your $35k cash investment doubles in ~2 years — after that, you're playing with house money.
- By year 3, paydown + projected appreciation supports a ~$34k cash-out refi (75% LTV) — recoverable capital for the next deal without selling this one.
Negotiation context
- Only 8 days on market — expect competitive offers; lowballing is unlikely to land.
- Current owner paid $75k; list at $125k implies a 67% gain — meaningful room to come down on a strong offer.
Risks & watch-outs
- Watch-outs: property tax is 2.8% of price.
Questions for the listing agent
- Property tax is high relative to price — has the assessment been appealed recently, and will the sale trigger a re-assessment?
- Is there a deadline driving the sale (1031 exchange, divorce, estate, relocation)? That informs how much negotiation room exists.
- Crime grade is F in this area — have there been break-ins, vandalism, or insurance claims at this property in the last 3 years? What carrier currently insures it and at what premium?
- What's the average days-on-market for RENTAL listings here right now (not sales)? A rising rental-DOM trend means longer vacancies and softer asking-rent achievability than the comps imply.
- What's the recent tenant-quality profile in this submarket — average credit score on applications, eviction rate, late-payment / NSF rate, and stable-employment percentage? A property-management company in the area should have these aggregated.
- How much new for-sale + rental construction is in the pipeline within 1–3 miles? Heavy new supply typically softens prices + rents 12–24 months out; constrained supply supports both.
Investment metrics
- 1% rule
- 1.46% ✓
- Cap rate
- 10.57%
- Cash-on-cash
- 15.26%
- DSCR
- 1.68
- GRM
- 5.7
CMA / ARV
- ARV (median comp)
- $163,081
- List price
- $125,000
- Delta
- -23.35%
- Verdict
- UNDERPRICED
- Comps
- 20 within 1.0 mi
Show comp detail 12 sales within ~0.75 mi
| Address | Dist | Beds/Ba | Sqft | Sold | Price | $/sf | Match |
|---|---|---|---|---|---|---|---|
| 79 Broad St | 0.24mi | 3/1.0 | 1,364 (-4%) | 2mo | $147,000 | $108 | 78 |
| 144 S Hawk St | 0.20mi | 4/1.0 (+1) | 1,449 (+2%) | 10mo | $95,000 | $66 | 73 |
| 1A Providence Pl | 0.57mi | 3/1.0 | 1,360 (-5%) | 6mo | $225,000 | $165 | 59 |
| 30 Park Ave | 0.19mi | 3/1.0 | 1,220 (-15%) | 8mo | $275,000 | $225 | 58 |
| 2 Sand St | 0.55mi | 3/1.0 | 1,252 (-12%) | 0mo | $165,000 | $132 | 51 |
| 16 Regent St | 0.47mi | 3/1.5 | 1,640 (+15%) | 5mo | $205,000 | $125 | 49 |
| 49 Mccarty Ave | 0.58mi | 3/1.5 | 1,600 (+12%) | 8mo | $181,500 | $113 | 46 |
| 3 Carroll Ter | 0.72mi | 4/2.0 (+1) | 1,536 (+8%) | 6mo | $245,723 | $160 | 41 |
| 286 2nd Ave | 0.66mi | 4/1.5 (+1) | 1,276 (-11%) | 10mo | $250,000 | $196 | 38 |
| 42 O Connell St | 0.65mi | 2/1.0 (-1) | 1,249 (-12%) | 11mo | $155,000 | $124 | 33 |
| 224-226 Myrtle Ave | 0.59mi | 2/2.5 (-1) | 1,600 (+12%) | 12mo | $260,000 | $163 | 33 |
| 257 Myrtle Ave | 0.72mi | 3/1.0 | 1,229 (-14%) | 11mo | $208,250 | $169 | 32 |
Match score weights: distance 35% · size 25% · config 20% · recency 20%. Top-matched comps best support the ARV.
Projected returns pro-forma
10.0% appreciation · 8.0% rent growth · sell at horizon
- IRR
- 38.3%
- Equity multiple
- 4.03×
- Total profit
- $106,166
- Equity at exit
- $112,610
- IRR
- 35.1%
- Equity multiple
- 9.98×
- Total profit
- $314,427
- Equity at exit
- $242,848
Cash invested: $35,000 (down + closing). Projections, not guarantees.
Landlord ↔ Tenant lean methodology
- Overall (STATE)
- 15 Strongly Tenant-Friendly
- State New York
- 15 Strongly Tenant-Friendly · D+10
- County
- — inherits STATE
- City
- — inherits STATE
ZIP-level market 12202
- Home prices YoY
- 14.3%
- Rents YoY
- 8.7%
- Active inventory
- 58
- Price-to-rent
- 5.7×
Monthly cashflow live
- Estimated rent
- $1,823 high interval (Pro) →
- Mortgage (P&I)
- −$656
- Tax from tax record
- −$287 /mo · $3,447/yr
- Insurance
- −$52
- HOA
- −$0
- Vacancy / Maint / Mgmt
- −$383
- Net cashflow
- $445
Break-even live
Sensitivity live
| Price | -10% $516 | -5% $480 | +0% $445 | +5% $410 | +10% $374 |
|---|---|---|---|---|---|
| Rent | -10% $301 | -5% $373 | +0% $445 | +5% $517 | +10% $589 |
| Rate | -1.0pp $508 | -0.5pp $477 | base $445 | +0.5pp $413 | +1.0pp $380 |
UW: 25.0% down · 7.5% · 30yr · 1.5% tax · 5.0% vac · 8.0% maint · 8.0% mgmt
Financing live
Cash to close
- Down payment
- $31,250
- Closing costs
- $3,750
- Reserves months
- —
- Total cash needed
- —
Loan-product check · same deal, 3 products live
Conventional
25% down · 7.5% · 30yr
- Down + closing
- —
- Monthly P&I
- —
- Monthly cashflow
- —
- DSCR
- —
- Eligible?
- —
Personal DTI + credit; lowest rate.
DSCR
20% down · 8.5% · 30yr
- Down + closing
- —
- Monthly P&I
- —
- Monthly cashflow
- —
- DSCR
- —
- Eligible?
- —
No personal income docs; deal must DSCR.
Hard money
10% down · 12.0% · 12mo
- Down + closing
- —
- Monthly P&I
- —
- Monthly cashflow
- —
- DSCR
- —
- Eligible?
- —
Short-term bridge; refi at stabilization.
Rent comps 40 comps
| Address | Beds | Baths | Sqft | Rent | $/sqft | DOM | Units | Dist |
|---|---|---|---|---|---|---|---|---|
| 25 Bleecker Pl #1 Albany, NY | 2.0 | 1.0 | 1150 | $1,350 | $1.17 | 46d | 1 | 0.27mi |
| 119 Grand St Albany, NY | 3.0 | 1.0 | 1600 | $1,300 | $0.81 | 45d | 1 | 0.28mi |
| 168 S Pearl St Albany, NY | 3.0 | 1.5 | 1044 | $1,800 | $1.72 | 25d | 1 | 0.38mi |
| 164 Madison Ave Albany, NY | 2.0 | 1.0 | 1200 | $1,500 | $1.25 | 45d | 1 | 0.38mi |
| 475 S Pearl St #3 Albany, NY | 4.0 | 2.0 | 1200 | $1,850 | $1.54 | 22d | 1 | 0.39mi |
| 475 S Pearl St #3 Albany, NY | 4.0 | 2.0 | 1200 | $1,850 | $1.54 | 16d | 1 | 0.39mi |
| 151 S Pearl St Albany, NY | 2.0 | 1.0 | 1000 | $1,600 | $1.60 | 16d | 1 | 0.41mi |
| 135 Madison Ave Unit 2 Albany, NY | 2.0 | 1.0 | 1000 | $1,400 | $1.40 | 45d | 1 | 0.43mi |
| 201 Park Ave Unit 10 Albany, NY | 3.0 | 2.0 | 1600 | $2,100 | $1.31 | 45d | 1 | 0.48mi |
| 4 Irving St Unit 2nd Floor Albany, NY | 3.0 | 1.0 | 1000 | $1,695 | $1.70 | 45d | 1 | 0.49mi |
| 346 Madison Ave Unit 3 Albany, NY | 3.0 | 2.0 | 1110 | $2,725 | $2.45 | 45d | 1 | 0.59mi |
| 346 Madison Ave Albany, NY | 3.0 | 2.0 | 1500 | $2,495 | $1.66 | 25d | 1 | 0.60mi |
| 341 Madison Ave Albany, NY | 2.0 | 1.0 | 1000 | $1,800 | $1.80 | 16d | 1 | 0.60mi |
| 364 Madison Ave Albany, NY | 2.0 | 2.0 | 1150 | $1,850 | $1.61 | 22d | 1 | 0.63mi |
| 98 Mount Hope Dr Albany, NY | 2.0 | 1.5 | 1200 | $2,000 | $1.67 | 16d | 1 | 0.74mi |
| 149 Jay St Albany, NY | 2.0 | 1.0 | 1000 | $1,750 | $1.75 | 45d | 1 | 0.74mi |
| 409 Madison Ave Albany, NY | 2.0 | 2.0 | 1050 | $2,094 | $1.99 | 25d | 1 | 0.75mi |
| 154 Lancaster St Unit 1 Albany, NY | 2.0 | 1.5 | 1500 | $2,200 | $1.47 | 25d | 1 | 0.78mi |
| 292 Lark St Albany, NY | 2.0 | 1.0 | 1100 | $1,500 | $1.36 | 45d | 1 | 0.79mi |
| 22 Hurlbut St Albany, NY | 3.0 | 1.0 | 1209 | $2,050 | $1.70 | 45d | 1 | 0.82mi |
| 48 N Pearl St Albany, NY | 2.0 | 1.0–2.5 | 1251 | $3,500 | $2.80 | 16d | 17 | 0.83mi |
| 31 Bertha St Albany, NY | 4.0 | 1.0 | 1116 | $2,000 | $1.79 | 25d | 1 | 0.85mi |
| 88 Willett St Albany, NY | 3.0 | 1.0 | 825 | $2,080 | $2.52 | 16d | 10 | 0.86mi |
| 227 Jay St Albany, NY | 2.0 | 2.0 | 1710 | $2,150 | $1.26 | 45d | 1 | 0.86mi |
| 520 Madison Ave Unit 1 Albany, NY | 3.0 | 1.0 | 1080 | $1,700 | $1.57 | 45d | 1 | 0.95mi |
| 99 New Broadway Rensselaer, NY | 2.0 | 1.0–2.0 | 946 | $2,495 | $2.64 | 16d | 5 | 0.96mi |
| 352 State St Albany, NY | 2.0 | 2.0 | 1143 | $2,500 | $2.19 | 25d | 1 | 0.96mi |
| 199 Lark St Albany, NY | 3.0 | 1.0 | 1000 | $1,800 | $1.80 | 45d | 1 | 0.99mi |
| 15 Stanwix St Albany, NY | 4.0 | 1.5 | 1660 | $2,500 | $1.51 | 16d | 1 | 1.00mi |
| 100 New Broadway Rensselaer, NY | 2.0 | 2.0 | 1248 | $2,212 | $1.77 | 16d | 2 | 1.05mi |
| 86 Hackett Blvd Albany, NY | 2.0 | 1.0 | 1100 | $1,900 | $1.73 | 25d | 1 | 1.06mi |
| 240 Washington Ave Albany, NY | 2.0 | 2.0 | 1560 | $2,450 | $1.57 | 45d | 1 | 1.07mi |
| 32 1st St Albany, NY | 4.0 | 1.5 | 1773 | $1,850 | $1.04 | 45d | 1 | 1.12mi |
| 254 Sheridan Ave Unit 2 Albany, NY | 3.0 | 1.0 | 900 | $1,300 | $1.44 | 25d | 1 | 1.14mi |
| 502 Second Ave #3 Albany, NY | 3.0 | 1.0 | 1100 | $1,800 | $1.64 | 45d | 1 | 1.16mi |
| 9 St Josephs Ter Albany, NY | 3.0 | 2.0 | 1000 | $1,850 | $1.85 | 45d | 1 | 1.17mi |
| 110 Lark St Unit STREET-1 Albany, NY | 2.0 | 1.0 | 975 | $1,150 | $1.18 | 22d | 1 | 1.19mi |
| 110 Lark St Unit STREET-1 Albany, NY | 2.0 | 1.0 | 975 | $1,150 | $1.18 | 16d | 1 | 1.19mi |
| 50 Southern Blvd Albany, NY | 3.0 | 1.0 | 1200 | $1,650 | $1.38 | 16d | 1 | 1.20mi |
| 945 Broadway Rensselaer, NY | 3.0 | 1.0 | 1200 | $1,650 | $1.38 | 25d | 1 | 1.25mi |
Listing history 5 events
-
2026-05-14status Pending 85-char remark
-
2026-05-04$125,000 Active 85-char remark
-
2006-07-25soldstatus $75,000
-
2005-09-14soldstatus $60,000
-
1998-09-21soldstatus $60,000
ⓘ Source: listings_history table (triggers on properties + properties_extension) + one-shot
backfill from property_details.listing_events for pre-trigger history.
Tax reassessment forecast NY · Partial reset (capped growth)
- Current annual tax
- $3,447 · $287/mo
- Projected year-2 tax
- $3,447 · $287/mo
- Expected delta
- $0/yr ($0/mo · 0.0%)
ⓘ Screening estimate from a state-policy table — verify with the county assessor before closing.
Climate risk First Street
- Flood 1/10 Low FEMA zone X (unshaded) · 0% chance over 30 yrs
- Wildfire 1/10 Low
- Heat 4/10 Moderate 7 d/yr ≥98°F today · 17 d/yr by 30 yrs out
- Wind 3/10 Moderate 6% chance of damaging wind over 30 yrs
- Air quality 1/10 Low 0 unhealthy d/yr today · 0 by 30 yrs out
Nearby sold comps map
Loading sold comps map…
Walkable amenities ~0.75 mi
Loading nearby amenities…
Taxation est. · year 1
- Rental income
- $21,872
- − Mortgage interest
- −$7,002
- − Property taxes
- −$3,447
- − Insurance
- −$625
- − Repairs & maintenance
- −$1,750
- − Management
- −$1,750
- − Depreciation
- −$3,636
- Taxable income
- $3,662
- Est. tax owed @ 24.0%
- −$879
- After-tax cash flow
- $4,462/yr
For passive investors: Depreciation is non-cash, so a rental often shows a tax loss while cash-flowing — sheltering income. Rental losses are passive: they offset passive income freely, and up to $25,000/yr can offset ordinary (W-2) income if you actively participate and your MAGI is under $100k (phasing out to $0 by $150k); unused losses carry forward. On sale, claimed depreciation is recaptured at up to 25%, and gains may owe capital-gains tax (a 1031 exchange can defer both). Figures are a year-1 estimate at your 24.0% rate — not tax advice; consult a CPA.
Schools (NCES district)
- District
- Albany City School District
- NCES district ID
- 3602460
- Math proficiency
- 37% ▲ 6.00%
- Reading proficiency
- 40% ▲ 7.00%
- Median HH income
- $40,568
- Composite
- 32.34/100
- National rank
- #5744
- State rank
- #543 of 590 in NY
Livability — Albany
- Score
- 79/100
- State rank
- #129
- US rank
- #2083
Category grades
Schools grade is shown separately in the Schools card above.
Census & demographics
- Census place
- Albany, NY
- County
- Albany County · 196,626 people
- City population
- 116,921
- Metro
- Albany-Schenectady-Troy, NY
- Population (ZIP)
- 10,166
- Household income
- $52,868
- Rent vs Own
- Severe rent burden
- 935.0
Population outlook (Albany County) Hauer SSP2
- Today (2025)
- 320,794 people
- By 2030
- 327,401 · +2.1%
- By 2040
- 338,218 · +5.4%
- By 2050
- 348,467 · +8.6%
- By 2075
- 381,693 · +19.0%
- By 2100
- 393,809 · +22.8%
Race, ethnicity, and origin ACS 2023
- Neighborhood character
- Highly diverse neighborhood (Simpson 0.73)
- Race & ethnicity
- Black 40% White 28% Hispanic / Latino 15% Two or more races 14% Asian 7%
- Hispanic origin (detail)
- Mexican 3% Puerto Rican 5% Dominican 5%
- Common ancestry
- Iranian 2% Romanian 1% Serbian 1%
- Foreign-born
- 14% · Canada, Philippines, China
- Languages at home
- 80% English-only · Spanish 10% Other Asian/Pacific 4% Arabic 1%
Political lean MEDSL · Albany
- 2024 margin
- Strong D (+25.8) · D 62.9% · R 37.1%
- 2008→2024 swing
- -3.6pp toward R · 2008: 29.4pp · 2024: 25.8pp
- All cycles
- 2024: D+25.8 2020: D+31.4 2016: D+24.3 2012: D+31.0 2008: D+29.4
Not yet ingested
- Civics
- —
Market trends
- HPI YoY
- ▲ 38.05%
- Current HPI
- 303.8939
- Rent YoY
- ▲ 8.70%
- Metro
- Albany-Schenectady-Troy, NY
- State GDP YoY
- ▲ 2.60%
- F500 in state
- 92
Industry mix (Fortune 500 HQ in NY)
| Industry | F500 HQs | Revenue |
|---|---|---|
| Financial Services | 10 | $950B |
|
||
| Consumer Goods | 9 | $162B |
|
||
| Insurance | 4 | $225B |
|
||
| Telecommunications | 2 | $144B |
|
||
| Pharmaceuticals | 2 | $112B |
|
||
| Media / Entertainment | 2 | $69B |
|
||
Price history
+108.3% since first listed6 events — show timeline
- 2026-05-14 Pending — Global MLS
- 2026-05-14 Listing Removed — Global MLS
- 2026-05-04 Listed $125,000 Global MLS
- 2006-07-25 Sold (Public Records) $75,000 Public Records
- 2005-09-14 Sold (Public Records) $60,000 Public Records
- 1998-09-21 Sold (Public Records) $60,000 Public Records
Property tax history
+4.4%/yrLatest (2025): $3,447 · +2.7% YoY. Source: county tax records.
Cash-flow waterfall
monthlySold comps — $/sqft
last 12 mo · ≤1 miLoading sold comps…