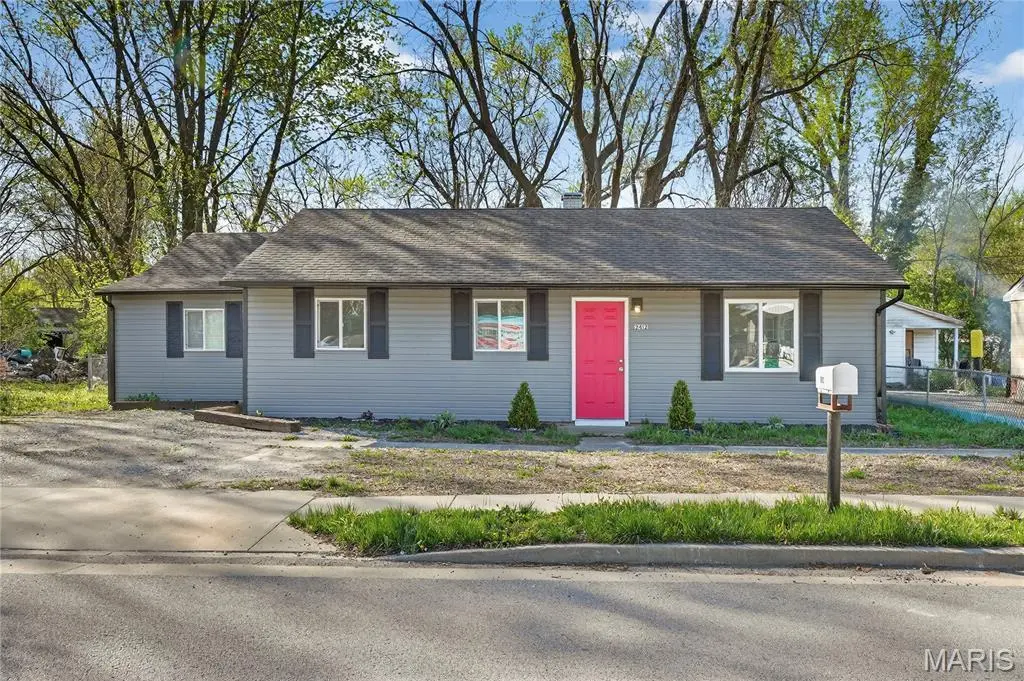
2412 Mousette Ln · Cahokia Heights, IL
Flood risk 1/10 · Minimal
- FEMA flood zone
- —
- Chance of flooding over 30 yrs
- 0.0%
- Est. flood insurance / yr
- —
Fire risk 1/10 · Minimal
- Est. fire insurance / yr
- $804 – $1,492
Heat risk 5/10 · Moderate
- Hot days now (above 107°F)
- 7 days/yr
- Hot days in 30 yrs
- 21 days/yr
Wind risk 2/10 · Minimal
- Chance of severe wind over 30 yrs
- 1.0%
Air-quality risk 3/10 · Minor
- Unhealthy air days now
- 3 days/yr
- Unhealthy air days in 30 yrs
- 4 days/yr
Risk factors via First Street. Map © Google.
Why this score? — see what drove the C grade
The composite is a weighted blend of 9 inputs, each scored 0–100. Each bar is that input's sub-score; the figure is the points it added to the 100-point composite (weight × sub-score).
- Cash flow +30.0/30.0
- DSCR +10.0/10.0
- 1% rule +9.2/10.0
- Rent growth +2.5/5.0
- Livability +2.5/5.0
- Condition / age +2.5/5.0
- Schools +0.6/10.0
- ARV discount +0.0/15.0
- Appreciation +0.0/10.0
$99,000
🖨 Deal sheet (PDF) 📄 Offer letter ✓ Due diligence
Listing remarks MLS
Step into this cozy turn-key house that has been updated from top to bottom. Some of the well-thought updates inside include new luxury vinyl plank flooring, new kitchen cabinets, and fresh paint throughout. Outside you are greeted with brand new vinyl siding and a cheery red door. This 4-bed, 1-bath home offers an inviting open-concept floor plan on a level lot boasting mature trees for extra privacy. Located just minutes from I-64 you have easy access to multiple hospitals, shopping, and the historic Cahokia Mounds. This charming home combines comfort, convenience, and a welcoming community setting. Move-in ready and waiting for you—come see why this one feels like home!
Key facts
- 9,147 sq ft lot
- Built 1956
- Listed 48 days
Neighborhood map
What this means for you Summary
Snapshot
- This is a 4-bed/3.0-bath single-family listed at $99k.
Deal economics
- At list price, monthly cash flow is $414 ($5k/yr) — positive.
- The deal already cash-flows at list — no discount required.
- Meets the 1% rule at list price ($1k rent vs $99k).
- Recommended offer: $96k (3.0% below list) — sets the bar for market timing.
Location & tenants
- Location reads: area grade C — affects rentability + tenant quality, not the cash-flow math above.
- Cahokia CUSD 187 (suburban): math 3% / reading 5% proficiency, ranked #864 of 919 in IL (top 94%) — low school quality limits family demand, transient renter base, plan for 1-2y turnover; 85% free/reduced lunch — lower-income household profile, screen leases tightly.
- Market conditions: 152 active listings in the ZIP; 15 comparable units currently listed for rent nearby; rentals at typical pace (median 23d on market — plan ~3-4 weeks tenant-placement turnaround); lower-income renter base — watch delinquency; 783 units permitted in St. Clair County in 2024 (378 in 5+ unit buildings).
- At $1,405/mo this rent would consume 50% of the median local household income ($34k/yr) (locally 729% of renters already pay >50% of income on rent) — very limited rent-growth headroom before tenants either downsize or default.
Forward outlook
- Local home prices are declining (-3.0%/yr); year-one equity from $684 of loan paydown is wiped out by about $3k of value loss. Plan a longer hold.
- St. Clair County population projected at -23% by 2050 — secular population decline; favor cash flow + early exit over multi-decade hold.
- At projected returns (-3.0% appreciation + 3.0% rent growth), your $28k cash investment doubles in ~7 years — after that, you're playing with house money.
Negotiation context
- It's been on market 48 days — a 3% lower offer ($96k) is reasonable based on typical stale-listing flexibility.
Risks & watch-outs
- Watch-outs: built in 1956 — expect roof / HVAC / electrical / plumbing capex.
- Climate carrying-cost: extreme-heat days projected 7→21/yr by 2055 (HVAC capex compounding) — expect insurance premiums to compound above CPI over the hold.
Questions for the listing agent
- It's been on market 48 days. Have you received any prior offers? Is the seller open to a 3% concession, seller financing, or rate buy-down credit?
- Built in 1956 — when were the roof, HVAC, electrical panel, plumbing, and water heater last replaced?
- Is there a deadline driving the sale (1031 exchange, divorce, estate, relocation)? That informs how much negotiation room exists.
- What's the average days-on-market for RENTAL listings here right now (not sales)? A rising rental-DOM trend means longer vacancies and softer asking-rent achievability than the comps imply.
- What's the recent tenant-quality profile in this submarket — average credit score on applications, eviction rate, late-payment / NSF rate, and stable-employment percentage? A property-management company in the area should have these aggregated.
- How much new for-sale + rental construction is in the pipeline within 1–3 miles? Heavy new supply typically softens prices + rents 12–24 months out; constrained supply supports both.
Investment metrics
- 1% rule
- 1.42% ✓
- Cap rate
- 11.32%
- Cash-on-cash
- 17.94%
- DSCR
- 1.80
- GRM
- 5.9
CMA / ARV
- ARV (median comp)
- $84,801
- List price
- $99,000
- Delta
- 16.74%
- Verdict
- OVERPRICED
- Comps
- 20 within 1.0 mi
Show comp detail 12 sales within ~0.75 mi
| Address | Dist | Beds/Ba | Sqft | Sold | Price | $/sf | Match |
|---|---|---|---|---|---|---|---|
| 37 Louise Ln | 0.11mi | 3/1.5 (-1) | 1,104 (-8%) | 0mo | $105,000 | $95 | 70 |
| 3 Dora Dr | 0.28mi | 4/1.0 | 1,158 (-4%) | 5mo | $110,000 | $95 | 69 |
| 20 Goodman Rd | 0.09mi | 4/2.0 | 1,104 (-8%) | 14mo | $87,000 | $79 | 66 |
| 1 Helen Ct | 0.28mi | 3/1.0 (-1) | 1,116 (-7%) | 2mo | $105,000 | $94 | 60 |
| 19 Agnes Dr | 0.31mi | 3/2.0 (-1) | 1,296 (+8%) | 7mo | $60,000 | $46 | 58 |
| 2 Margie Dr | 0.55mi | 4/2.0 | 1,152 (-4%) | 8mo | $110,000 | $95 | 58 |
| 38 Westwood Dr | 0.66mi | 4/1.0 | 1,225 (+2%) | 2mo | $90,000 | $73 | 56 |
| 11 Westwood Dr | 0.63mi | 4/1.0 | 1,225 (+2%) | 6mo | $110,000 | $90 | 54 |
| 43 Drexel Dr | 0.62mi | 4/1.0 | 1,225 (+2%) | 8mo | $90,000 | $73 | 53 |
| 3 Agnes Dr | 0.23mi | 3/1.0 (-1) | 1,368 (+14%) | 14mo | $80,000 | $58 | 41 |
| 21 Westwood Dr | 0.64mi | 4/1.0 | 1,100 (-8%) | 12mo | $56,000 | $51 | 38 |
| 2013 Maple Tree Ln | 0.74mi | 3/1.0 (-1) | 1,026 (-14%) | 8mo | $70,000 | $68 | 22 |
Match score weights: distance 35% · size 25% · config 20% · recency 20%. Top-matched comps best support the ARV.
Projected returns pro-forma
-3.0% appreciation · 3.0% rent growth · sell at horizon
- IRR
- 9.5%
- Equity multiple
- 1.37×
- Total profit
- $10,384
- Equity at exit
- $14,761
- IRR
- 18.7%
- Equity multiple
- 2.56×
- Total profit
- $43,149
- Equity at exit
- $8,560
Cash invested: $27,720 (down + closing). Projections, not guarantees.
Landlord ↔ Tenant lean methodology
- Overall (STATE)
- 43 Moderately Tenant-Leaning
- State Illinois
- 43 Moderately Tenant-Leaning · D+7
- County
- — inherits STATE
- City
- — inherits STATE
ZIP-level market 62206
- Home prices YoY
- -20.2%
- Active inventory
- 152
- Price-to-rent
- 5.9×
Monthly cashflow live
- Estimated rent
- $1,405 high interval (Pro) →
- Mortgage (P&I)
- −$519
- Tax from tax record
- −$135 /mo · $1,623/yr
- Insurance
- −$41
- HOA
- −$0
- Vacancy / Maint / Mgmt
- −$295
- Net cashflow
- $414
Break-even live
Sensitivity live
| Price | -10% $471 | -5% $442 | +0% $414 | +5% $386 | +10% $358 |
|---|---|---|---|---|---|
| Rent | -10% $303 | -5% $359 | +0% $414 | +5% $470 | +10% $525 |
| Rate | -1.0pp $464 | -0.5pp $440 | base $414 | +0.5pp $389 | +1.0pp $363 |
UW: 25.0% down · 7.5% · 30yr · 1.5% tax · 5.0% vac · 8.0% maint · 8.0% mgmt
Financing live
Cash to close
- Down payment
- $24,750
- Closing costs
- $2,970
- Reserves months
- —
- Total cash needed
- —
Loan-product check · same deal, 3 products live
Conventional
25% down · 7.5% · 30yr
- Down + closing
- —
- Monthly P&I
- —
- Monthly cashflow
- —
- DSCR
- —
- Eligible?
- —
Personal DTI + credit; lowest rate.
DSCR
20% down · 8.5% · 30yr
- Down + closing
- —
- Monthly P&I
- —
- Monthly cashflow
- —
- DSCR
- —
- Eligible?
- —
No personal income docs; deal must DSCR.
Hard money
10% down · 12.0% · 12mo
- Down + closing
- —
- Monthly P&I
- —
- Monthly cashflow
- —
- DSCR
- —
- Eligible?
- —
Short-term bridge; refi at stabilization.
Rent comps 15 comps
| Address | Beds | Baths | Sqft | Rent | $/sqft | DOM | Units | Dist |
|---|---|---|---|---|---|---|---|---|
| 13 Marilyn Ln East Saint Louis, IL | 3.0 | 1.0 | 995 | $1,150 | $1.16 | 44d | 1 | 0.19mi |
| 8 Louise Ln East Saint Louis, IL | 3.0 | 1.0 | 1150 | $1,275 | $1.11 | 18d | 1 | 0.23mi |
| 21 Agnes Dr Cahokia, IL | 3.0 | 1.0 | 864 | $1,050 | $1.22 | 22d | 1 | 0.32mi |
| 6 Delores Dr East Saint Louis, IL | 3.0 | 1.0 | 864 | $1,300 | $1.50 | 13d | 1 | 0.32mi |
| 6 Delores Dr East Saint Louis, IL | 3.0 | 1.0 | 864 | $1,300 | $1.50 | 24d | 1 | 0.32mi |
| 2 E Adams Dr East Saint Louis, IL | 3.0 | 1.0 | 925 | $885 | $0.96 | 44d | 1 | 0.54mi |
| 32 Drexel Dr East Saint Louis, IL | 4.0 | 1.0 | 1362 | $1,675 | $1.23 | 17d | 1 | 0.55mi |
| 13 Drexel Dr East Saint Louis, IL | 3.0 | 1.0 | 925 | $995 | $1.08 | 13d | 1 | 0.57mi |
| 70 W Adams Dr East Saint Louis, IL | 3.0 | 1.0 | 925 | $1,200 | $1.30 | 44d | 1 | 0.72mi |
| 2116 Doris Ave Cahokia Heights, IL | 3.0 | 1.0 | 880 | $1,400 | $1.59 | 22d | 1 | 0.84mi |
| 2008 Delores St East Saint Louis, IL | 3.0 | 1.0 | 925 | $1,250 | $1.35 | 5d | 1 | 1.16mi |
| 1808 Mullens Ave Cahokia Heights, IL | 3.0 | 1.0 | 992 | $1,500 | $1.51 | 3d | 1 | 1.23mi |
| 1713 Loretta Ave East Saint Louis, IL | 3.0 | 1.0 | 944 | $1,095 | $1.16 | 44d | 1 | 1.34mi |
| 1420 Williams St East Saint Louis, IL | 4.0 | 1.0 | 1300 | $1,500 | $1.15 | 44d | 1 | 1.48mi |
| 1421 Richard Dr East Saint Louis, IL | 3.0 | 1.0 | 936 | $1,100 | $1.18 | 3d | 1 | 1.49mi |
Listing history 3 events
-
2026-04-24price $99,000 688-char remark
Show marketing remark (688 chars)
Step into this cozy turn-key house that has been updated from top to bottom. Some of the well-thought updates inside include new luxury vinyl plank flooring, new kitchen cabinets, and fresh paint throughout. Outside you are greeted with brand new vinyl siding and a cheery red door. This 4-bed, 1-bath home offers an inviting open-concept floor plan on a level lot boasting mature trees for extra privacy. Located just minutes from I-64 you have easy access to multiple hospitals, shopping, and the historic Cahokia Mounds. This charming home combines comfort, convenience, and a welcoming community setting. Move-in ready and waiting for you—come see why this one feels like home!
-
2026-04-09$110,000 Active 688-char remark
Show marketing remark (688 chars)
Step into this cozy turn-key house that has been updated from top to bottom. Some of the well-thought updates inside include new luxury vinyl plank flooring, new kitchen cabinets, and fresh paint throughout. Outside you are greeted with brand new vinyl siding and a cheery red door. This 4-bed, 1-bath home offers an inviting open-concept floor plan on a level lot boasting mature trees for extra privacy. Located just minutes from I-64 you have easy access to multiple hospitals, shopping, and the historic Cahokia Mounds. This charming home combines comfort, convenience, and a welcoming community setting. Move-in ready and waiting for you—come see why this one feels like home!
-
2026-04-07historical $110,000 688-char remark
Show marketing remark (688 chars)
Step into this cozy turn-key house that has been updated from top to bottom. Some of the well-thought updates inside include new luxury vinyl plank flooring, new kitchen cabinets, and fresh paint throughout. Outside you are greeted with brand new vinyl siding and a cheery red door. This 4-bed, 1-bath home offers an inviting open-concept floor plan on a level lot boasting mature trees for extra privacy. Located just minutes from I-64 you have easy access to multiple hospitals, shopping, and the historic Cahokia Mounds. This charming home combines comfort, convenience, and a welcoming community setting. Move-in ready and waiting for you—come see why this one feels like home!
ⓘ Source: listings_history table (triggers on properties + properties_extension) + one-shot
backfill from property_details.listing_events for pre-trigger history.
Tax reassessment forecast IL · Partial reset (capped growth)
- Current annual tax
- $1,623 · $135/mo
- Projected year-2 tax
- $1,935 · $161/mo
- Expected delta
- +$312/yr (+$26/mo · 19.2%)
ⓘ Screening estimate from a state-policy table — verify with the county assessor before closing.
Climate risk First Street
- Flood 1/10 Low 0% chance over 30 yrs
- Wildfire 1/10 Low
- Heat 5/10 Major 7 d/yr ≥107°F today · 21 d/yr by 30 yrs out
- Wind 2/10 Low 100% chance of damaging wind over 30 yrs
- Air quality 3/10 Moderate 3 unhealthy d/yr today · 4 by 30 yrs out
Nearby sold comps map
Loading sold comps map…
Walkable amenities ~0.75 mi
Loading nearby amenities…
Taxation est. · year 1
- Rental income
- $16,863
- − Mortgage interest
- −$5,546
- − Property taxes
- −$1,623
- − Insurance
- −$495
- − Repairs & maintenance
- −$1,349
- − Management
- −$1,349
- − Depreciation
- −$2,880
- Taxable income
- $3,621
- Est. tax owed @ 24.0%
- −$869
- After-tax cash flow
- $4,105/yr
For passive investors: Depreciation is non-cash, so a rental often shows a tax loss while cash-flowing — sheltering income. Rental losses are passive: they offset passive income freely, and up to $25,000/yr can offset ordinary (W-2) income if you actively participate and your MAGI is under $100k (phasing out to $0 by $150k); unused losses carry forward. On sale, claimed depreciation is recaptured at up to 25%, and gains may owe capital-gains tax (a 1031 exchange can defer both). Figures are a year-1 estimate at your 24.0% rate — not tax advice; consult a CPA.
Schools (NCES district)
- District
- Cahokia CUSD 187
- NCES district ID
- 1708040
- Math proficiency
- 3% ▼ -2.00%
- Reading proficiency
- 5% ▬ 0.00%
- Median HH income
- $28,028
- Composite
- 6.44/100
- National rank
- #14827
- State rank
- #864 of 919 in IL
Livability — Cahokia Heights
No livability data for this city. (Only ~50 U.S. cities are tracked.)
Census & demographics
- Census place
- Cahokia Heights, IL
- County
- Saint Clair County · 169,691 people
- City population
- 19,956
- Metro
- St. Louis, MO-IL
- Population (ZIP)
- 12,959
- Household income
- $33,838
- Rent vs Own
- Severe rent burden
- 729.0
Population outlook (St. Clair County) Hauer SSP2
- Today (2025)
- 250,366 people
- By 2030
- 240,511 · -3.9%
- By 2040
- 217,391 · -13.2%
- By 2050
- 192,699 · -23.0%
- By 2075
- 140,637 · -43.8%
- By 2100
- 100,499 · -59.9%
Race, ethnicity, and origin ACS 2023
- Neighborhood character
- Diverse neighborhood (Simpson 0.56)
- Race & ethnicity
- Black 59% White 29% Two or more races 6% Hispanic / Latino 3% Asian 2%
- Common ancestry
- Romanian 2% Lithuanian 1% Iranian 1%
- Foreign-born
- 2% · China
- Languages at home
- 95% English-only · Spanish 3% Other Indo-European 1% Chinese 1%
Political lean MEDSL · St. Clair
- 2024 margin
- Lean D (+7.9) · D 53.0% · R 45.1% · Other 1.8%
- 2008→2024 swing
- -14.6pp toward R · 2008: 22.4pp · 2024: 7.9pp
- All cycles
- 2024: D+7.9 2020: D+8.7 2016: D+5.6 2012: D+14.5 2008: D+22.4
Not yet ingested
- Civics
- —
Market trends
- HPI YoY
- ▼ -33.26%
- Current HPI
- 131.5144
- Rent YoY
- —
- Metro
- St. Louis, MO-IL
- State GDP YoY
- ▲ 1.59%
- F500 in state
- 60
Industry mix (Fortune 500 HQ in IL)
| Industry | F500 HQs | Revenue |
|---|---|---|
| Insurance | 4 | $201B |
|
||
| Consumer Goods | 4 | $87B |
|
||
| Industrial Machinery | 3 | $64B |
|
||
| Healthcare | 2 | $55B |
|
||
| Retail / Pharmacy | 1 | $148B |
|
||
| Agriculture / Food | 1 | $86B |
|
||
Price history
-10.0% since first listed3 events — show timeline
- 2026-04-24 Price Changed $99,000 MARIS as Distributed by MLS Grid
- 2026-04-09 Listed $110,000 MARIS as Distributed by MLS Grid
- 2026-04-07 Coming Soon $110,000 MARIS as Distributed by MLS Grid
Cash-flow waterfall
monthlySold comps — $/sqft
last 12 mo · ≤1 miLoading sold comps…