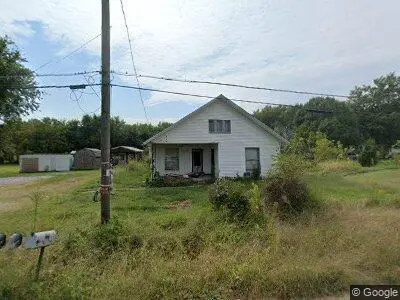
230 Lisman St · Clay, KY
Flood risk 1/10 · Minimal
- FEMA flood zone
- X (unshaded)
- Chance of flooding over 30 yrs
- 0.0%
- Est. flood insurance / yr
- $507 – $1,088
Fire risk 1/10 · Minimal
- Est. fire insurance / yr
- $839 – $1,559
Heat risk 5/10 · Moderate
- Hot days now (above 109°F)
- 7 days/yr
- Hot days in 30 yrs
- 19 days/yr
Wind risk 3/10 · Minor
- Chance of severe wind over 30 yrs
- 6.0%
Air-quality risk 2/10 · Minimal
- Unhealthy air days now
- 1 days/yr
- Unhealthy air days in 30 yrs
- 1 days/yr
Risk factors via First Street. Map © Google.
Why this score? — see what drove the C- grade
The composite is a weighted blend of 9 inputs, each scored 0–100. Each bar is that input's sub-score; the figure is the points it added to the 100-point composite (weight × sub-score).
- Cash flow +15.0/30.0
- Appreciation +10.0/10.0
- ARV discount +7.5/15.0
- 1% rule +5.0/10.0
- DSCR +5.0/10.0
- Livability +3.1/5.0
- Rent growth +2.5/5.0
- Schools +2.5/10.0
- Condition / age +2.5/5.0
$12,000
🖨 Deal sheet (PDF) 📄 Offer letter ✓ Due diligence
Listing remarks
The house is in rough shape and best option would be to tear it down, I just don & acirc; & euro; & trade; t have the time or money to put into it. It is 4 bedroom, 1 bath. No central heat or air. And has gas space heaters. It needs all wiring, water lines, flooring and probably all new windows as majority has been busted out. The house sits on about 1/3 of an acre (possibly more) from what I can figure but it also comes with an extra lot connected to the back of the property that is well over an acre. I can text a copy of the deed if requested. There is water, gas, and power hook up on the property and it has a septic tank. Also has small out building at the back of the propert
Key facts
- Extra lot
- Septic tank
- Gas space heaters
Tags
Neighborhood map
What this means for you Summary
Snapshot
- This is a 4-bed/1.0-bath other listed at $12k.
Deal economics
- At list price, monthly cash flow is $849 ($10k/yr) — positive.
- The deal already cash-flows at list — no discount required.
- Meets the 1% rule at list price ($1k rent vs $12k).
Location & tenants
- Location reads 62/100 on livability (#348 in KY) — a middle-class / working-renter tenant base. Strengths: crime A+, cost of living A+, housing A+; Watch: amenities F, commute F, employment F.
- Webster County (rural): math 25% / reading 34% proficiency, ranked #114 of 165 in KY (top 69%) — low school quality limits family demand, transient renter base, plan for 1-2y turnover.
- Zoned schools: Clay Elementary School (math 37% / reading 42%, grade F, #208 of 676 statewide, top 34%, 194 students, 65% FRL); Webster County Middle School (math 22% / reading 36%, grade F, #156 of 217 statewide, top 74%, 315 students, 66% FRL); Webster County High School (math 22% / reading 27%, grade F, #179 of 254 statewide, top 78%, 676 students, 61% FRL).
- Market conditions: 19 active listings in the ZIP; 6 units permitted in Webster County in 2024 (0 in 5+ unit buildings).
Forward outlook
- In year one you build about $1k of equity ($83 loan paydown + $1k appreciation (10.0% local appreciation)).
- Webster County population projected at -14% by 2050 — secular population decline; favor cash flow + early exit over multi-decade hold.
- At projected returns (10.0% appreciation + 3.0% rent growth), your $3k cash investment doubles in ~1 year — after that, you're playing with house money.
Negotiation context
- Only 1 days on market — expect competitive offers; lowballing is unlikely to land.
- Current owner paid $6k; list at $12k implies a 85% gain — meaningful room to come down on a strong offer.
Risks & watch-outs
- Watch-outs: built in 1930 — expect roof / HVAC / electrical / plumbing capex.
- Climate carrying-cost: extreme-heat days projected 7→19/yr by 2055 (HVAC capex compounding) — expect insurance premiums to compound above CPI over the hold.
Questions for the listing agent
- Built in 1930 — when were the roof, HVAC, electrical panel, plumbing, and water heater last replaced?
- Is there a deadline driving the sale (1031 exchange, divorce, estate, relocation)? That informs how much negotiation room exists.
- Schools are D-rated, which usually means shorter tenancies and higher turnover. Who's the typical renter profile here, and what's been the actual vacancy rate?
- What's the average days-on-market for RENTAL listings here right now (not sales)? A rising rental-DOM trend means longer vacancies and softer asking-rent achievability than the comps imply.
- What's the recent tenant-quality profile in this submarket — average credit score on applications, eviction rate, late-payment / NSF rate, and stable-employment percentage? A property-management company in the area should have these aggregated.
- How much new for-sale + rental construction is in the pipeline within 1–3 miles? Heavy new supply typically softens prices + rents 12–24 months out; constrained supply supports both.
Investment metrics
- 1% rule
- 9.84% ✓
- Cap rate
- 91.19%
- Cash-on-cash
- 303.21%
- DSCR
- 14.49
- GRM
- 0.8
CMA / ARV
No comps found within radius.
Projected returns pro-forma
10.0% appreciation · 3.0% rent growth · sell at horizon
- IRR
- —
- Equity multiple
- 19.04×
- Total profit
- $60,627
- Equity at exit
- $10,811
- IRR
- —
- Equity multiple
- 41.49×
- Total profit
- $136,051
- Equity at exit
- $23,313
Cash invested: $3,360 (down + closing). Projections, not guarantees.
Landlord ↔ Tenant lean methodology
- Overall (STATE)
- 83 Strongly Landlord-Friendly
- State Kentucky
- 83 Strongly Landlord-Friendly · R+16
- County
- — inherits STATE
- City
- — inherits STATE
ZIP-level market 42404
- Home prices YoY
- 5.2%
- Active inventory
- 19
- Price-to-rent
- 0.8×
Monthly cashflow live
- Estimated rent
- $1,181 medium interval (Pro) →
- Mortgage (P&I)
- −$63
- Tax from tax record
- −$16 /mo · $195/yr
- Insurance
- −$5
- HOA
- −$0
- Vacancy / Maint / Mgmt
- −$248
- Net cashflow
- $849
Break-even live
Sensitivity live
| Price | -10% $856 | -5% $852 | +0% $849 | +5% $846 | +10% $842 |
|---|---|---|---|---|---|
| Rent | -10% $756 | -5% $802 | +0% $849 | +5% $896 | +10% $942 |
| Rate | -1.0pp $855 | -0.5pp $852 | base $849 | +0.5pp $846 | +1.0pp $843 |
UW: 25.0% down · 7.5% · 30yr · 1.5% tax · 5.0% vac · 8.0% maint · 8.0% mgmt
Financing live
Cash to close
- Down payment
- $3,000
- Closing costs
- $360
- Reserves months
- —
- Total cash needed
- —
Loan-product check · same deal, 3 products live
Conventional
25% down · 7.5% · 30yr
- Down + closing
- —
- Monthly P&I
- —
- Monthly cashflow
- —
- DSCR
- —
- Eligible?
- —
Personal DTI + credit; lowest rate.
DSCR
20% down · 8.5% · 30yr
- Down + closing
- —
- Monthly P&I
- —
- Monthly cashflow
- —
- DSCR
- —
- Eligible?
- —
No personal income docs; deal must DSCR.
Hard money
10% down · 12.0% · 12mo
- Down + closing
- —
- Monthly P&I
- —
- Monthly cashflow
- —
- DSCR
- —
- Eligible?
- —
Short-term bridge; refi at stabilization.
Listing history 2 events
-
2026-05-26$12,000 Active
-
1976-07-01soldstatus $6,500
ⓘ Source: listings_history table (triggers on properties + properties_extension) + one-shot
backfill from property_details.listing_events for pre-trigger history.
Tax reassessment forecast KY · Resets to sale price
- Current annual tax
- $195 · $16/mo
- Projected year-2 tax
- $195 · $16/mo
- Expected delta
- $0/yr ($0/mo · 0.0%)
ⓘ Screening estimate from a state-policy table — verify with the county assessor before closing.
Climate risk First Street
- Flood 1/10 Low FEMA zone X (unshaded) · 0% chance over 30 yrs
- Wildfire 1/10 Low
- Heat 5/10 Major 7 d/yr ≥109°F today · 19 d/yr by 30 yrs out
- Wind 3/10 Moderate 6% chance of damaging wind over 30 yrs
- Air quality 2/10 Low 1 unhealthy d/yr today · 1 by 30 yrs out
Nearby sold comps map
Loading sold comps map…
Walkable amenities ~0.75 mi
Loading nearby amenities…
Taxation est. · year 1
- Rental income
- $14,175
- − Mortgage interest
- −$672
- − Property taxes
- −$195
- − Insurance
- −$60
- − Repairs & maintenance
- −$1,134
- − Management
- −$1,134
- − Depreciation
- −$349
- Taxable income
- $10,631
- Est. tax owed @ 24.0%
- −$2,551
- After-tax cash flow
- $7,637/yr
For passive investors: Depreciation is non-cash, so a rental often shows a tax loss while cash-flowing — sheltering income. Rental losses are passive: they offset passive income freely, and up to $25,000/yr can offset ordinary (W-2) income if you actively participate and your MAGI is under $100k (phasing out to $0 by $150k); unused losses carry forward. On sale, claimed depreciation is recaptured at up to 25%, and gains may owe capital-gains tax (a 1031 exchange can defer both). Figures are a year-1 estimate at your 24.0% rate — not tax advice; consult a CPA.
Schools (NCES district)
- District
- Webster County
- NCES district ID
- 2105820
- Math proficiency
- 25% ▼ -17.00%
- Reading proficiency
- 34% ▼ -16.00%
- Median HH income
- $39,542
- Composite
- 24.76/100
- National rank
- #7600
- State rank
- #114 of 165 in KY
Livability — Clay
- Score
- 62/100
- State rank
- #348
- US rank
- #16518
Category grades
Schools grade is shown separately in the Schools card above.
Census & demographics
- Census place
- Clay, KY
- Population (ZIP)
- 2,268
Population outlook (Webster County) Hauer SSP2
- Today (2025)
- 12,548 people
- By 2030
- 12,119 · -3.4%
- By 2040
- 11,345 · -9.6%
- By 2050
- 10,761 · -14.2%
- By 2075
- 10,166 · -19.0%
- By 2100
- 10,546 · -16.0%
Race, ethnicity, and origin ACS 2023
- Neighborhood character
- Predominantly White (94%)
- Race & ethnicity
- White 94% Hispanic / Latino 5% Pacific Islander 1%
- Common ancestry
- Italian 7% Lithuanian 1% Slovak 1%
- Foreign-born
- 1% · Canada
- Languages at home
- 96% English-only · Spanish 4%
Political lean MEDSL · Webster
- 2024 margin
- Solid R (+57.4) · D 20.8% · R 78.1% · Other 1.1%
- 2008→2024 swing
- -45.7pp toward R · 2008: -11.7pp · 2024: -57.4pp
- All cycles
- 2024: R+57.4 2020: R+51.6 2016: R+54.4 2012: R+33.7 2008: R+11.7
Not yet ingested
- Civics
- —
Market trends
- HPI YoY
- ▲ 11.08%
- Current HPI
- 223.0427
- Rent YoY
- —
- Metro
- —
- State GDP YoY
- ▲ 1.81%
- F500 in state
- 4
Industry mix (Fortune 500 HQ in KY)
| Industry | F500 HQs | Revenue |
|---|---|---|
| Healthcare | 1 | $118B |
|
||
| Food / Beverage | 1 | $7B |
|
||
Price history
+84.6% since first listed2 events — show timeline
- 2026-05-26 Listed $12,000 FSBO.com
- 1976-07-01 Sold (Public Records) $6,500 Public Records
Property tax history
+2.1%/yrLatest (2025): $195 · -0.1% YoY. Source: county tax records.
Cash-flow waterfall
monthlySold comps — $/sqft
last 12 mo · ≤1 miLoading sold comps…