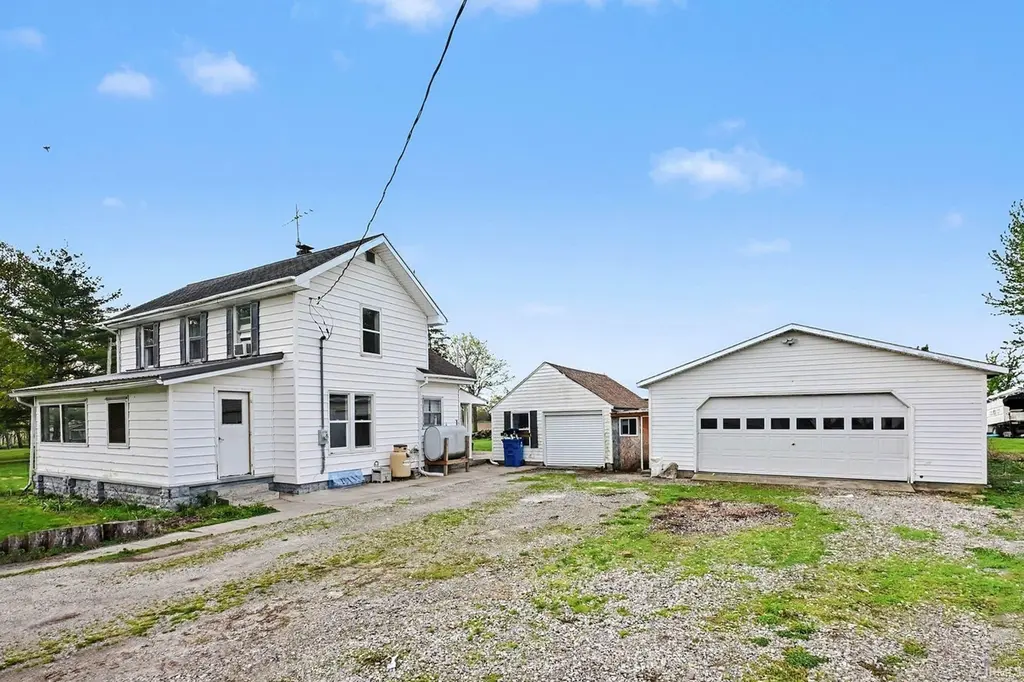
465 E 500 N · Peru, IN
Flood risk 1/10 · Minimal
- FEMA flood zone
- X (unshaded)
- Chance of flooding over 30 yrs
- 0.0%
- Est. flood insurance / yr
- $473 – $860
Fire risk 1/10 · Minimal
- Est. fire insurance / yr
- $717 – $1,331
Heat risk 3/10 · Minor
- Hot days now (above 102°F)
- 7 days/yr
- Hot days in 30 yrs
- 16 days/yr
Wind risk 2/10 · Minimal
- Chance of severe wind over 30 yrs
- 1.0%
Air-quality risk 2/10 · Minimal
- Unhealthy air days now
- 1 days/yr
- Unhealthy air days in 30 yrs
- 2 days/yr
Risk factors via First Street. Map © Google.
Why this score? — see what drove the C- grade
The composite is a weighted blend of 9 inputs, each scored 0–100. Each bar is that input's sub-score; the figure is the points it added to the 100-point composite (weight × sub-score).
- Cash flow +19.1/30.0
- ARV discount +11.3/15.0
- DSCR +6.0/10.0
- 1% rule +4.0/10.0
- Livability +3.9/5.0
- Schools +2.9/10.0
- Rent growth +2.5/5.0
- Condition / age +2.5/5.0
- Appreciation +0.0/10.0
$139,000
🖨 Deal sheet (PDF) 📄 Offer letter ✓ Due diligence
Listing remarks
This 3 bed 1 bath is set on a large . 6 acre lot just outside of town. With a large 2 car garage as well as additional outbuildings, this property offers plenty of room for all your outdoor activities. The features one bedroom on the main level and two large bedrooms upstairs. The deck at the rear of the house leads to the back yard with a small fenced in area for livestock. Schedule your showing today and enjoy the peace and quiet of country living at an affordable price!
Key facts
- Fenced in area
- Deck at rear
- Large garage
Tags
Property features AI
Finance
- Financial info: Annual tax amount listed
Exterior
- Parking: Detached 2-car garage
- Utilities: Private well water; Septic tank
- Home design: Single-family residence; Site-built home; One story
- Construction: Vinyl siding; Block foundation
- Exterior features: Level lot; Lot dimensions approximately 200 x 100
Interior
- Kitchen: Gas cooktop; Refrigerator
- Bedrooms: 4 total rooms (bedroom count not specified)
- Bathrooms: 1 full bathroom (main level)
- Heating & cooling: Window cooling units
- Interior features: Refrigerator; Gas cooktop
- Laundry & utility: Laundry in basement; Partial basement with sump pump
Neighborhood map
What this means for you Summary
Snapshot
- This is a 3-bed/1.0-bath single-family listed at $139k.
Deal economics
- At list price, monthly cash flow is $148 ($2k/yr) — positive.
- The deal already cash-flows at list — no discount required.
- To meet the 1% rule (rent ≥ 1% of price), the offer needs to be $125k (10.2% below list).
- Recommended offer: $125k (10.2% below list) — sets the bar for 1% rule.
- Cap rate 7.6% vs local median 6.1% in Peru — meaningfully above typical; check what's discounted (condition, days-on-market, listing class) to confirm the premium yield is real.
Location & tenants
- Location reads 77/100 on livability (#35 in IN, #2,834 nationally) — a middle-class / working-renter tenant base. Strengths: amenities A+, cost of living A+, housing A+; Watch: crime D+, commute F, employment F.
- North Miami Community Schools (rural): math 26% / reading 42% proficiency, ranked #197 of 301 in IN (top 65%) — families likely to look elsewhere, expect single-tenant / working-renter base with shorter leases.
- Zoned schools: North Miami Elementary School (math 36% / reading 37%, grade F, #571 of 994 statewide, top 58%, 369 students, 52% FRL); North Miami Middle/High School (math 17% / reading 47%, grade F, #295 of 369 statewide, top 82%, 400 students, 42% FRL) — zoned schools average 47% FRL vs 26% district-wide (21 pts higher); higher-poverty schools than district average — tighter screening recommended.
- Market conditions: 129 active listings in the ZIP; 35 units permitted in Miami County in 2024 (0 in 5+ unit buildings).
Forward outlook
- Local home prices are declining (-3.0%/yr); year-one equity from $961 of loan paydown is wiped out by about $4k of value loss. Plan a longer hold.
- Miami County population projected at -12% by 2050 — secular population decline; favor cash flow + early exit over multi-decade hold.
Negotiation context
- It's been on market 37 days — a 3% lower offer ($135k) is reasonable based on typical stale-listing flexibility.
Risks & watch-outs
- Watch-outs: built in 1910 — expect roof / HVAC / electrical / plumbing capex.
Questions for the listing agent
- It's been on market 37 days. Have you received any prior offers? Is the seller open to a 10% concession, seller financing, or rate buy-down credit?
- Built in 1910 — when were the roof, HVAC, electrical panel, plumbing, and water heater last replaced?
- Is there a deadline driving the sale (1031 exchange, divorce, estate, relocation)? That informs how much negotiation room exists.
- Schools are D-rated, which usually means shorter tenancies and higher turnover. Who's the typical renter profile here, and what's been the actual vacancy rate?
- Crime grade is D in this area — have there been break-ins, vandalism, or insurance claims at this property in the last 3 years? What carrier currently insures it and at what premium?
- What's the average days-on-market for RENTAL listings here right now (not sales)? A rising rental-DOM trend means longer vacancies and softer asking-rent achievability than the comps imply.
- What's the recent tenant-quality profile in this submarket — average credit score on applications, eviction rate, late-payment / NSF rate, and stable-employment percentage? A property-management company in the area should have these aggregated.
- How much new for-sale + rental construction is in the pipeline within 1–3 miles? Heavy new supply typically softens prices + rents 12–24 months out; constrained supply supports both.
Investment metrics
- 1% rule
- 0.90% ✗
- Cap rate
- 7.57%
- Cash-on-cash
- 4.57%
- DSCR
- 1.20
- GRM
- 9.3
CMA / ARV
- ARV (median comp)
- $151,692
- List price
- $139,000
- Delta
- -8.37%
- Verdict
- FAIR
- Comps
- 7 within 2.0 mi
Projected returns pro-forma
-3.0% appreciation · 3.0% rent growth · sell at horizon
- IRR
- -9.2%
- Equity multiple
- 0.66×
- Total profit
- $-13,143
- Equity at exit
- $20,725
- IRR
- 0.2%
- Equity multiple
- 1.01×
- Total profit
- $476
- Equity at exit
- $12,018
Cash invested: $38,920 (down + closing). Projections, not guarantees.
Landlord ↔ Tenant lean methodology
- Overall (STATE)
- 90 Strongly Landlord-Friendly
- State Indiana
- 90 Strongly Landlord-Friendly · R+11
- County
- — inherits STATE
- City
- — inherits STATE
ZIP-level market 46970
- Home prices YoY
- -8.8%
- Active inventory
- 129
- Price-to-rent
- 9.3×
Monthly cashflow live
- Estimated rent
- $1,248 medium interval (Pro) →
- Mortgage (P&I)
- −$729
- Tax from tax record
- −$51 /mo · $608/yr
- Insurance
- −$58
- HOA
- −$0
- Vacancy / Maint / Mgmt
- −$262
- Net cashflow
- $148
Break-even live
Sensitivity live
| Price | -10% $227 | -5% $188 | +0% $148 | +5% $109 | +10% $69 |
|---|---|---|---|---|---|
| Rent | -10% $50 | -5% $99 | +0% $148 | +5% $197 | +10% $247 |
| Rate | -1.0pp $218 | -0.5pp $184 | base $148 | +0.5pp $112 | +1.0pp $76 |
UW: 25.0% down · 7.5% · 30yr · 1.5% tax · 5.0% vac · 8.0% maint · 8.0% mgmt
Financing live
Cash to close
- Down payment
- $34,750
- Closing costs
- $4,170
- Reserves months
- —
- Total cash needed
- —
Loan-product check · same deal, 3 products live
Conventional
25% down · 7.5% · 30yr
- Down + closing
- —
- Monthly P&I
- —
- Monthly cashflow
- —
- DSCR
- —
- Eligible?
- —
Personal DTI + credit; lowest rate.
DSCR
20% down · 8.5% · 30yr
- Down + closing
- —
- Monthly P&I
- —
- Monthly cashflow
- —
- DSCR
- —
- Eligible?
- —
No personal income docs; deal must DSCR.
Hard money
10% down · 12.0% · 12mo
- Down + closing
- —
- Monthly P&I
- —
- Monthly cashflow
- —
- DSCR
- —
- Eligible?
- —
Short-term bridge; refi at stabilization.
Listing history 18 events
-
2026-06-21days on market $139,000 Active 37 DOM
-
2026-06-19days on market $139,000 Active 35 DOM
-
2026-06-18days on market $139,000 Active 34 DOM
-
2026-06-17days on market $139,000 Active 33 DOM
-
2026-06-16days on market $139,000 Active 32 DOM
-
2026-06-15days on market $139,000 Active 31 DOM
-
2026-06-14days on market $139,000 Active 29 DOM
-
2026-06-12days on market $139,000 Active 28 DOM
-
2026-06-09days on market $139,000 Active 25 DOM
-
2026-06-08days on market $139,000 Active 24 DOM
-
2026-06-07days on market $139,000 Active 23 DOM
-
2026-06-07days on market $139,000 Active 22 DOM
-
2026-06-03days on market $139,000 Active 19 DOM
-
2026-06-02days on market $139,000 Active 18 DOM
-
2026-06-01days on market $139,000 Active 17 DOM
-
2026-05-31days on market $139,000 Active 16 DOM
-
2026-05-31days on market $139,000 Active 15 DOM
-
2026-05-14$139,000 Active 477-char remark
ⓘ Source: listings_history table (triggers on properties + properties_extension) + one-shot
backfill from property_details.listing_events for pre-trigger history.
Tax reassessment forecast IN · Partial reset (capped growth)
- Current annual tax
- $608 · $51/mo
- Projected year-2 tax
- $895 · $75/mo
- Expected delta
- +$287/yr (+$24/mo · 47.2%)
ⓘ Screening estimate from a state-policy table — verify with the county assessor before closing.
Climate risk First Street
- Flood 1/10 Low FEMA zone X (unshaded) · 0% chance over 30 yrs
- Wildfire 1/10 Low
- Heat 3/10 Moderate 7 d/yr ≥102°F today · 16 d/yr by 30 yrs out
- Wind 2/10 Low 100% chance of damaging wind over 30 yrs
- Air quality 2/10 Low 1 unhealthy d/yr today · 2 by 30 yrs out
Nearby sold comps map
Loading sold comps map…
Walkable amenities ~0.75 mi
Loading nearby amenities…
Taxation est. · year 1
- Rental income
- $14,972
- − Mortgage interest
- −$7,786
- − Property taxes
- −$608
- − Insurance
- −$695
- − Repairs & maintenance
- −$1,198
- − Management
- −$1,198
- − Depreciation
- −$4,044
- Taxable loss
- −$556
- Est. tax savings @ 24.0%
- +$133
- After-tax cash flow
- $1,912/yr
For passive investors: Depreciation is non-cash, so a rental often shows a tax loss while cash-flowing — sheltering income. Rental losses are passive: they offset passive income freely, and up to $25,000/yr can offset ordinary (W-2) income if you actively participate and your MAGI is under $100k (phasing out to $0 by $150k); unused losses carry forward. On sale, claimed depreciation is recaptured at up to 25%, and gains may owe capital-gains tax (a 1031 exchange can defer both). Figures are a year-1 estimate at your 24.0% rate — not tax advice; consult a CPA.
Schools (NCES district)
- District
- North Miami Community Schools
- NCES district ID
- 1807890
- Math proficiency
- 26% ▼ -10.00%
- Reading proficiency
- 42% ▼ -3.00%
- Median HH income
- $49,863
- Composite
- 29.45/100
- National rank
- #6513
- State rank
- #197 of 301 in IN
Livability — Peru
- Score
- 77/100
- State rank
- #35
- US rank
- #2834
Category grades
Schools grade is shown separately in the Schools card above.
Census & demographics
- County
- Miami County · 23,020 people
- City population
- 23,020
- Metro
- Peru, IN
- Population (ZIP)
- 23,020
- Household income
- $57,842
- Rent vs Own
- Severe rent burden
- 498.0
Population outlook (Miami County) Hauer SSP2
- Today (2025)
- 34,421 people
- By 2030
- 33,571 · -2.5%
- By 2040
- 31,919 · -7.3%
- By 2050
- 30,313 · -11.9%
- By 2075
- 26,202 · -23.9%
- By 2100
- 20,856 · -39.4%
Race, ethnicity, and origin ACS 2023
- Neighborhood character
- Predominantly White (87%)
- Race & ethnicity
- White 87% Two or more races 6% Hispanic / Latino 4% Black 3%
- Common ancestry
- Iranian 2% Romanian 2% Slovak 2%
- Foreign-born
- 1% · Canada
- Languages at home
- 97% English-only · Spanish 2% German/W. Germanic 0%
Political lean MEDSL · Miami
- 2024 margin
- Solid R (+54.5) · D 21.8% · R 76.3% · Other 1.9%
- 2008→2024 swing
- -35.1pp toward R · 2008: -19.5pp · 2024: -54.5pp
- All cycles
- 2024: R+54.5 2020: R+53.1 2016: R+53.6 2012: R+30.9 2008: R+19.5
Not yet ingested
- Civics
- —
Market trends
- HPI YoY
- ▼ -24.29%
- Current HPI
- 252.7166
- Rent YoY
- —
- Metro
- Peru, IN
- State GDP YoY
- ▲ 2.90%
- F500 in state
- 18
Industry mix (Fortune 500 HQ in IN)
| Industry | F500 HQs | Revenue |
|---|---|---|
| Industrial Machinery | 2 | $37B |
|
||
| Healthcare | 1 | $177B |
|
||
| Pharmaceuticals | 1 | $45B |
|
||
| Metals / Steel | 1 | $18B |
|
||
| Agriculture | 1 | $17B |
|
||
| Packaging | 1 | $12B |
|
||
Price history
1 event — show timeline
- 2026-05-14 Listed $139,000 IRMLS
Property tax history
+6.0%/yrLatest (2024): $608 · +7.8% YoY. Source: county tax records.
Cash-flow waterfall
monthlySold comps — $/sqft
last 12 mo · ≤1 miLoading sold comps…