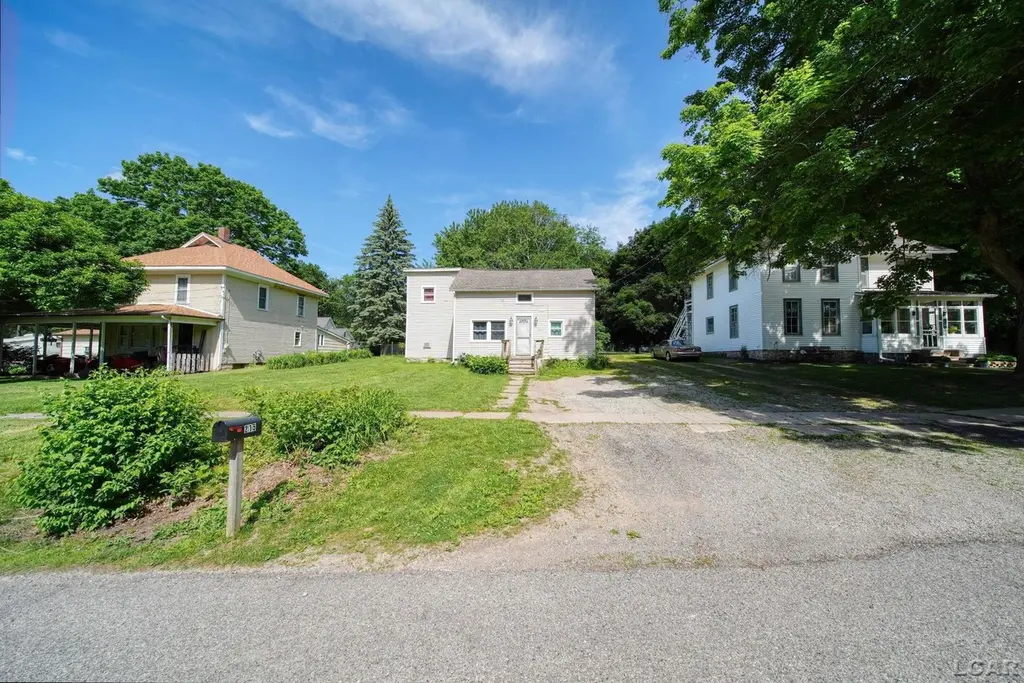
215 S Jackson St · Rollin, MI
Flood risk 1/10 · Minimal
- FEMA flood zone
- X (unshaded)
- Chance of flooding over 30 yrs
- 0.0%
- Est. flood insurance / yr
- $473 – $860
Fire risk 1/10 · Minimal
- Est. fire insurance / yr
- $784 – $1,456
Heat risk 2/10 · Minimal
- Hot days now (above 97°F)
- 7 days/yr
- Hot days in 30 yrs
- 16 days/yr
Wind risk 2/10 · Minimal
- Chance of severe wind over 30 yrs
- —
Air-quality risk 2/10 · Minimal
- Unhealthy air days now
- 1 days/yr
- Unhealthy air days in 30 yrs
- 3 days/yr
Risk factors via First Street. Map © Google.
Why this score? — see what drove the B grade
The composite is a weighted blend of 9 inputs, each scored 0–100. Each bar is that input's sub-score; the figure is the points it added to the 100-point composite (weight × sub-score).
- Cash flow +30.0/30.0
- ARV discount +14.3/15.0
- 1% rule +10.0/10.0
- DSCR +10.0/10.0
- Schools +2.7/10.0
- Rent growth +2.5/5.0
- Livability +2.5/5.0
- Condition / age +2.5/5.0
- Appreciation +0.0/10.0
$129,000
🖨 Deal sheet (PDF) 📄 Offer letter ✓ Due diligence
Listing remarks MLS
Welcome home to 215 S. Jackson Street in Addison, Michigan! This spacious 4-bedroom home offers the perfect blend of small-town charm and everyday convenience. Located just minutes from Manitou Beach and the beautiful Irish Hills lakes, you'll enjoy easy access to year-round recreation while still being close to everything you need. The home features plenty of living space, four comfortable bedrooms, and a large backyard that's perfect for entertaining, gardening, pets, or simply relaxing on a warm Michigan evening. Conveniently situated within walking distance of the Addison Post Office and the popular Sandbar Café, you'll love being able to enjoy local favorites just steps from your front door. Plus, with US-127 just minutes away, commuting to Jackson, Lansing, and other major cities is quick and convenient. Whether you're searching for your first home, a place to grow, or an investment opportunity, this property offers endless potential.
Key facts
- Large backyard
- Commuting to jackson
- Commuting to lansing
Tags
Property features AI
Finance
- HOA & community: Homeowners association present
Exterior
- Utilities: Public water; Public sewer
- Home design: Single-family residence; One and one-half story
- Construction: Vinyl siding; 1,233 above-grade finished square feet
- Exterior features: Paved road access; Shed(s)
Interior
- Bathrooms: 1 full bathroom
- Heating & cooling: Forced air heating (natural gas); Ceiling fan(s)
- Interior features: Full basement
Neighborhood map
What this means for you Summary
Snapshot
- This is a 4-bed/1.0-bath single-family listed at $129k.
Deal economics
- At list price, monthly cash flow is $685 ($8k/yr) — positive.
- The deal already cash-flows at list — no discount required.
- Meets the 1% rule at list price ($2k rent vs $129k).
Location & tenants
- Location reads: area grade B — affects rentability + tenant quality, not the cash-flow math above.
- Addison Community Schools (rural): math 22% / reading 40% proficiency, ranked #339 of 540 in MI (top 63%) — families likely to look elsewhere, expect single-tenant / working-renter base with shorter leases.
- Zoned schools: Addison Elementary School (math 22% / reading 37%, grade F, #866 of 1,397 statewide, top 65%, 324 students, 61% FRL); Addison Middle School (math 22% / reading 42%, grade F, #317 of 493 statewide, top 65%, 161 students, 53% FRL); Addison High School (math 24% / reading 44%, grade F, #372 of 713 statewide, top 56%, 232 students, 42% FRL).
- Market conditions: 14 active listings in the ZIP; 1 comparable units currently listed for rent nearby; 137 units permitted in Lenawee County in 2024 (0 in 5+ unit buildings).
Forward outlook
- Local home prices are declining (-3.0%/yr); year-one equity from $892 of loan paydown is wiped out by about $4k of value loss. Plan a longer hold.
- Lenawee County population projected at -18% by 2050 — secular population decline; favor cash flow + early exit over multi-decade hold.
- At projected returns (-3.0% appreciation + 3.0% rent growth), your $36k cash investment doubles in ~6 years — after that, you're playing with house money.
Negotiation context
- Only 13 days on market — expect competitive offers; lowballing is unlikely to land.
- 4 sale attempts since 15y ago with the ask held roughly flat each time — persistent listings suggest the price (not the market) is what's stuck; bring a comps-based counter.
- Current owner paid $14k; list at $129k implies a 828% gain — meaningful room to come down on a strong offer.
Risks & watch-outs
- Watch-outs: built in 1920 — expect roof / HVAC / electrical / plumbing capex.
Questions for the listing agent
- Built in 1920 — when were the roof, HVAC, electrical panel, plumbing, and water heater last replaced?
- Is there a deadline driving the sale (1031 exchange, divorce, estate, relocation)? That informs how much negotiation room exists.
- What's the average days-on-market for RENTAL listings here right now (not sales)? A rising rental-DOM trend means longer vacancies and softer asking-rent achievability than the comps imply.
- What's the recent tenant-quality profile in this submarket — average credit score on applications, eviction rate, late-payment / NSF rate, and stable-employment percentage? A property-management company in the area should have these aggregated.
- How much new for-sale + rental construction is in the pipeline within 1–3 miles? Heavy new supply typically softens prices + rents 12–24 months out; constrained supply supports both.
Investment metrics
- 1% rule
- 1.55% ✓
- Cap rate
- 12.66%
- Cash-on-cash
- 22.74%
- DSCR
- 2.01
- GRM
- 5.4
CMA / ARV
- ARV (on-the-fly)
- $152,134
- Comps found
- 11
Show comp detail 11 sales within ~0.75 mi
| Address | Dist | Beds/Ba | Sqft | Sold | Price | $/sf | Match |
|---|---|---|---|---|---|---|---|
| 201 S Talbot Street St | 0.06mi | 3/2.5 (-1) | 1,760 (-0%) | 4mo | $180,000 | $102 | 82 |
| 215 E Main St | 0.09mi | 4/2.0 | 1,734 (-2%) | 18mo | $152,000 | $88 | 74 |
| 209 S Talbot St | 0.06mi | 3/1.5 (-1) | 1,872 (+6%) | 14mo | $199,900 | $107 | 69 |
| 305 N Steer St | 0.31mi | 4/2.0 | 1,864 (+5%) | 5mo | $135,000 | $72 | 68 |
| 315 Talbot St | 0.09mi | 4/1.0 | 1,948 (+10%) | 22mo | $155,000 | $80 | 60 |
| 135 S Steer St | 0.22mi | 3/2.5 (-1) | 1,942 (+10%) | 4mo | $125,000 | $64 | 59 |
| 6482 Sorby Hwy | 0.39mi | 5/3.0 (+1) | 1,680 (-5%) | 2mo | $499,900 | $298 | 59 |
| 206 N Steer St | 0.29mi | 3/1.0 (-1) | 1,536 (-13%) | 8mo | $118,400 | $77 | 53 |
| 333 N Steer St | 0.38mi | 4/1.0 | 1,642 (-7%) | 22mo | $127,000 | $77 | 52 |
| 236 S Steer St | 0.41mi | 3/2.0 (-1) | 1,956 (+11%) | 5mo | $222,500 | $114 | 50 |
| 302 W Main St | 0.42mi | 3/1.0 (-1) | 1,546 (-13%) | 14mo | $133,000 | $86 | 42 |
Match score weights: distance 35% · size 25% · config 20% · recency 20%. Top-matched comps best support the ARV.
Projected returns pro-forma
-3.0% appreciation · 3.0% rent growth · sell at horizon
- IRR
- 15.7%
- Equity multiple
- 1.63×
- Total profit
- $22,727
- Equity at exit
- $19,234
- IRR
- 24.3%
- Equity multiple
- 3.11×
- Total profit
- $76,054
- Equity at exit
- $11,154
Cash invested: $36,120 (down + closing). Projections, not guarantees.
Landlord ↔ Tenant lean methodology
- Overall (STATE)
- 62 Landlord-Friendly
- State Michigan
- 62 Landlord-Friendly · EVEN
- County
- — inherits STATE
- City
- — inherits STATE
ZIP-level market 49220
- Home prices YoY
- -27.1%
- Active inventory
- 14
- Price-to-rent
- 5.4×
Monthly cashflow live
- Estimated rent
- $1,995 medium interval (Pro) →
- Mortgage (P&I)
- −$676
- Tax est. 1.5%
- −$161 /mo · $1,935/yr
- Insurance
- −$54
- HOA
- −$0
- Vacancy / Maint / Mgmt
- −$419
- Net cashflow
- $685
Break-even live
Sensitivity live
| Price | -10% $774 | -5% $729 | +0% $685 | +5% $640 | +10% $595 |
|---|---|---|---|---|---|
| Rent | -10% $527 | -5% $606 | +0% $685 | +5% $763 | +10% $842 |
| Rate | -1.0pp $750 | -0.5pp $717 | base $685 | +0.5pp $651 | +1.0pp $617 |
UW: 25.0% down · 7.5% · 30yr · 1.5% tax · 5.0% vac · 8.0% maint · 8.0% mgmt
Financing live
Cash to close
- Down payment
- $32,250
- Closing costs
- $3,870
- Reserves months
- —
- Total cash needed
- —
Loan-product check · same deal, 3 products live
Conventional
25% down · 7.5% · 30yr
- Down + closing
- —
- Monthly P&I
- —
- Monthly cashflow
- —
- DSCR
- —
- Eligible?
- —
Personal DTI + credit; lowest rate.
DSCR
20% down · 8.5% · 30yr
- Down + closing
- —
- Monthly P&I
- —
- Monthly cashflow
- —
- DSCR
- —
- Eligible?
- —
No personal income docs; deal must DSCR.
Hard money
10% down · 12.0% · 12mo
- Down + closing
- —
- Monthly P&I
- —
- Monthly cashflow
- —
- DSCR
- —
- Eligible?
- —
Short-term bridge; refi at stabilization.
Rent comps 1 comps
| Address | Beds | Baths | Sqft | Rent | $/sqft | DOM | Units | Dist |
|---|---|---|---|---|---|---|---|---|
| 3709 Meridian Rd Addison, MI | 3.0 | 2.0 | 1950 | $1,995 | $1.02 | 45d | 1 | 0.34mi |
Listing history 10 events
-
2026-06-21days on market $129,000 Active 13 DOM
-
2026-06-21days on market $129,000 Active 12 DOM
-
2026-06-18days on market $129,000 Active 10 DOM
-
2026-06-17days on market $129,000 Active 9 DOM
-
2026-06-16days on market $129,000 Active 8 DOM
-
2026-06-15days on market $129,000 Active 7 DOM
-
2026-06-13days on market $129,000 Active 5 DOM
-
2026-06-12days on market $129,000 Active 4 DOM
-
2026-06-09remarks 694-char remark
-
2026-06-09$129,000 Active 1 DOM
ⓘ Source: listings_history table (triggers on properties + properties_extension) + one-shot
backfill from property_details.listing_events for pre-trigger history.
Climate risk First Street
- Flood 1/10 Low FEMA zone X (unshaded) · 0% chance over 30 yrs
- Wildfire 1/10 Low
- Heat 2/10 Low 7 d/yr ≥97°F today · 16 d/yr by 30 yrs out
- Wind 2/10 Low
- Air quality 2/10 Low 1 unhealthy d/yr today · 3 by 30 yrs out
Nearby sold comps map
Loading sold comps map…
Walkable amenities ~0.75 mi
Loading nearby amenities…
Taxation est. · year 1
- Rental income
- $23,940
- − Mortgage interest
- −$7,226
- − Property taxes
- −$1,935
- − Insurance
- −$645
- − Repairs & maintenance
- −$1,915
- − Management
- −$1,915
- − Depreciation
- −$3,753
- Taxable income
- $6,551
- Est. tax owed @ 24.0%
- −$1,572
- After-tax cash flow
- $6,643/yr
For passive investors: Depreciation is non-cash, so a rental often shows a tax loss while cash-flowing — sheltering income. Rental losses are passive: they offset passive income freely, and up to $25,000/yr can offset ordinary (W-2) income if you actively participate and your MAGI is under $100k (phasing out to $0 by $150k); unused losses carry forward. On sale, claimed depreciation is recaptured at up to 25%, and gains may owe capital-gains tax (a 1031 exchange can defer both). Figures are a year-1 estimate at your 24.0% rate — not tax advice; consult a CPA.
Schools (NCES district)
- District
- Addison Community Schools
- NCES district ID
- 2601920
- Math proficiency
- 22% ▼ -14.00%
- Reading proficiency
- 40% ▼ -3.00%
- Median HH income
- $53,055
- Composite
- 27.25/100
- National rank
- #7009
- State rank
- #339 of 540 in MI
Livability — Rollin
No livability data for this city. (Only ~50 U.S. cities are tracked.)
Census & demographics
- Census place
- Addison, MI
- Population (ZIP)
- 2,468
Population outlook (Lenawee County) Hauer SSP2
- Today (2025)
- 95,497 people
- By 2030
- 92,722 · -2.9%
- By 2040
- 85,641 · -10.3%
- By 2050
- 77,971 · -18.4%
- By 2075
- 60,043 · -37.1%
- By 2100
- 41,468 · -56.6%
Race, ethnicity, and origin ACS 2023
- Neighborhood character
- Predominantly White (96%)
- Race & ethnicity
- White 96% Two or more races 4% Hispanic / Latino 3%
- Common ancestry
- Romanian 6% Iranian 5% Lithuanian 4%
- Foreign-born
- 1% · Canada
- Languages at home
- 98% English-only · Spanish 2%
Political lean MEDSL · Lenawee
- 2024 margin
- Strong R (+23.0) · D 37.8% · R 60.8% · Other 1.4%
- 2008→2024 swing
- -28.1pp toward R · 2008: 5.1pp · 2024: -23.0pp
- All cycles
- 2024: R+23.0 2020: R+19.9 2016: R+21.1 2012: R+1.3 2008: D+5.1
Not yet ingested
- Civics
- —
Market trends
- HPI YoY
- ▼ -70.33%
- Current HPI
- 188.796
- Rent YoY
- —
- Metro
- —
- State GDP YoY
- ▲ 1.37%
- F500 in state
- 28
Industry mix (Fortune 500 HQ in MI)
| Industry | F500 HQs | Revenue |
|---|---|---|
| Automotive Parts | 3 | $48B |
|
||
| Automotive | 2 | $372B |
|
||
| Chemicals | 1 | $45B |
|
||
| Automotive Retail | 1 | $29B |
|
||
| Healthcare / Medical Devices | 1 | $23B |
|
||
| Automotive Technology | 1 | $20B |
|
||
Price history
+765.8% since first listed7 events — show timeline
- 2026-06-08 Listed $129,000 REALCOMP
- 2026-06-08 Listed $129,000 MiRealSource-MiMLS
- 2011-12-30 Listing Removed — MiRealSource-MiMLS
- 2011-12-29 Sold (MLS) $13,900 REALCOMP
- 2011-12-29 Sold (MLS) $13,900 MiRealSource-MiMLS
- 2011-11-08 Listed $14,900 REALCOMP
- 2011-11-08 Listed $14,900 MiRealSource-MiMLS
Property tax history
-6.7%/yrLatest (2025): $251 · -60.9% YoY. Source: county tax records.
Cash-flow waterfall
monthlySold comps — $/sqft
last 12 mo · ≤1 miLoading sold comps…