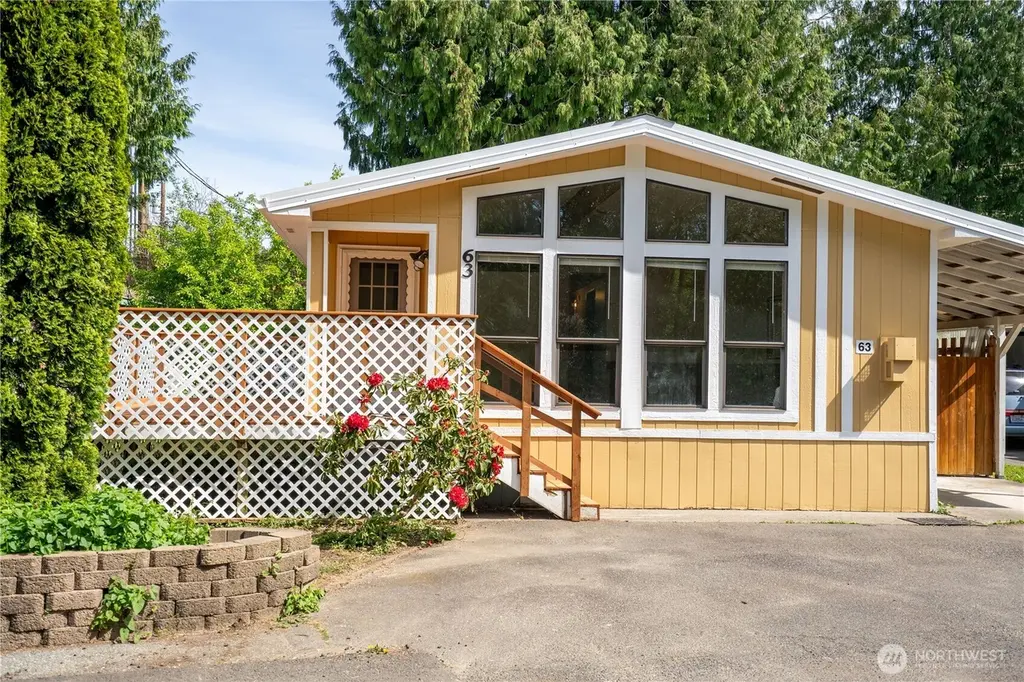
2500 Samish Way #63 · Bellingham, WA
Flood risk 1/10 · Minimal
- FEMA flood zone
- X (unshaded)
- Chance of flooding over 30 yrs
- 0.0%
- Est. flood insurance / yr
- $507 – $1,088
Fire risk 1/10 · Minimal
- Est. fire insurance / yr
- $604 – $1,122
Heat risk 1/10 · Minimal
- Hot days now (above 83°F)
- 7 days/yr
- Hot days in 30 yrs
- 17 days/yr
Wind risk 1/10 · Minimal
- Chance of severe wind over 30 yrs
- —
Air-quality risk 6/10 · Moderate
- Unhealthy air days now
- 9 days/yr
- Unhealthy air days in 30 yrs
- 10 days/yr
Risk factors via First Street. Map © Google.
Why this score? — see what drove the B grade
The composite is a weighted blend of 9 inputs, each scored 0–100. Each bar is that input's sub-score; the figure is the points it added to the 100-point composite (weight × sub-score).
- Cash flow +30.0/30.0
- 1% rule +10.0/10.0
- DSCR +10.0/10.0
- ARV discount +7.5/15.0
- Schools +4.8/10.0
- Livability +4.0/5.0
- Rent growth +3.3/5.0
- Condition / age +2.5/5.0
- Appreciation +0.0/10.0
$89,500
🖨 Deal sheet 📄 Offer letter ✓ Due diligence
Listing remarks
Welcome to one of the best values and most affordable options in Bellingham! This beautifully refreshed 2-bedroom, 2-bath home features a spacious, light-filled layout with brand new interior and exterior paint, plus a new deck, stairs, and railing—perfect for enjoying peaceful mornings overlooking serene green space. Located in a desirable pet friendly community, you’ll love the easy access to Lake Padden, downtown Bellingham, shopping, dining, and nearby bus lines for easy commuting. Outdoor enthusiasts are just minutes from Galbraith Mountain. Inside, enjoy abundant natural light, a generous primary suite with en suite bath and deep soaking tub, spacious secondary bedroom, an
Key facts
- Ample cabinetry
- Covered carport
- New deck
Tags
Property features AI
Finance
- Financial info: Listing terms: Cash or Conventional
- HOA & community: Located in Cresthaven park; Park amenities: common area, high-speed internet available; Land lease: $975
Exterior
- Parking: Carport
- Utilities: Public water; City sewer; Electric service; Gas water heater located in bedroom closet; Cable (Xfinity); Internet (Xfinity)
- Home design: Manufactured home (double wide); One level; Entry level main floor; Good condition; Faces unspecified direction
- Construction: Wood construction; Metal roof; Slab foundation; Built as a manufactured house
- Exterior features: Wood exterior products; Patio/porch/deck; Vaulted ceilings; Adjacent to public land; Located on a cul-de-sac; Has view
Interior
- Kitchen: Dishwasher; Refrigerator; Stove/Range
- Bedrooms: 2 bedrooms
- Flooring: Vinyl flooring; Carpet
- Bathrooms: 2 full bathrooms; 2 bathtubs; 2 showers
- Heating & cooling: Heating present; No central cooling
- Interior features: Electric fireplace; Water heater
- Laundry & utility: Washer; Dryer; Utility room
Neighborhood map
What this means for you Summary
Snapshot
- This is a 2-bed/1.5-bath manufactured listed at $90k.
Deal economics
- At list price, monthly cash flow is $1k ($14k/yr) — positive.
- The deal already cash-flows at list — no discount required.
- Meets the 1% rule at list price ($2k rent vs $90k).
- Cap rate 21.5% vs local median 2.0% in Bellingham — top-decile yield for the area; either an underpriced asset or a hidden risk that comps aren't pricing in. Stress-test before assuming the spread holds.
Location & tenants
- Location reads 80/100 on livability (#102 in WA, #1,947 nationally) — a professional / high-income tenant draw. Strengths: amenities A+, commute A+, health & safety A+; Watch: crime F, cost of living F.
- Bellingham School District (urban): math 47% / reading 63% proficiency, ranked #106 of 291 in WA (top 36%) — acceptable for families but not a draw, mixed tenant base, ~2y average lease.
- Zoned schools: Wade King Elementary School (346 students, 24% FRL); Sehome High School (1,163 students, 25% FRL).
- Market conditions: Rents rising (+3.4%/yr); 270 active listings in the ZIP; 7 comparable units currently listed for rent nearby; rentals leasing fast (median 13d on market — plan ~1-2 weeks tenant-placement turnaround); solid renter incomes; 1,190 units permitted in Whatcom County in 2024 (327 in 5+ unit buildings).
Forward outlook
- Local home prices are declining (-3.0%/yr); year-one equity from $619 of loan paydown is wiped out by about $3k of value loss. Plan a longer hold.
- Whatcom County population projected at +28% by 2050 — long-run rental-demand tailwind backs the buy-and-hold thesis.
- At projected returns (-3.0% appreciation + 3.4% rent growth), your $25k cash investment doubles in ~3 years — after that, you're playing with house money.
Negotiation context
- Only 7 days on market — expect competitive offers; lowballing is unlikely to land.
- 7 sale attempts since 22y ago with the ask held roughly flat each time — persistent listings suggest the price (not the market) is what's stuck; bring a comps-based counter.
- Current owner paid $30k; list at $90k implies a 198% gain — meaningful room to come down on a strong offer.
Questions for the listing agent
- Is there a deadline driving the sale (1031 exchange, divorce, estate, relocation)? That informs how much negotiation room exists.
- Schools are B-rated — typically a magnet for longer-tenancy family renters. What's the average tenant stay here, and is there a school-zone premium baked into asking?
- Crime grade is F in this area — have there been break-ins, vandalism, or insurance claims at this property in the last 3 years? What carrier currently insures it and at what premium?
- What's the average days-on-market for RENTAL listings here right now (not sales)? A rising rental-DOM trend means longer vacancies and softer asking-rent achievability than the comps imply.
- What's the recent tenant-quality profile in this submarket — average credit score on applications, eviction rate, late-payment / NSF rate, and stable-employment percentage? A property-management company in the area should have these aggregated.
- How much new for-sale + rental construction is in the pipeline within 1–3 miles? Heavy new supply typically softens prices + rents 12–24 months out; constrained supply supports both.
Investment metrics
- 1% rule
- 2.37% ✓
- Cap rate
- 21.53%
- Cash-on-cash
- 54.41%
- DSCR
- 3.42
- GRM
- 3.5
CMA / ARV
No comps found within radius.
Projected returns pro-forma
-3.0% appreciation · 3.38% rent growth · sell at horizon
- IRR
- 53.0%
- Equity multiple
- 3.34×
- Total profit
- $58,660
- Equity at exit
- $13,345
- IRR
- 58.4%
- Equity multiple
- 6.89×
- Total profit
- $147,557
- Equity at exit
- $7,738
Cash invested: $25,060 (down + closing). Projections, not guarantees.
Landlord ↔ Tenant lean methodology
- Overall (STATE)
- 28 Tenant-Leaning
- State Washington
- 28 Tenant-Leaning · D+8
- County
- — inherits STATE
- City
- — inherits STATE
ZIP-level market 98229
- Rents YoY
- 3.4%
- Active inventory
- 270
- Price-to-rent
- 3.5×
Monthly cashflow live
- Estimated rent
- $2,120 high interval (Pro) →
- Mortgage (P&I)
- −$469
- Tax from tax record
- −$32 /mo · $378/yr
- Insurance
- −$37
- HOA
- −$0
- Vacancy / Maint / Mgmt
- −$445
- Net cashflow
- $1,136
Break-even live
UW: 25.0% down · 7.5% · 30yr · 1.5% tax · 5.0% vac · 8.0% maint · 8.0% mgmt
Financing live
Cash to close
- Down payment
- $22,375
- Closing costs
- $2,685
- Reserves months
- —
- Total cash needed
- —
Loan-product check · same deal, 3 products live
Conventional
25% down · 7.5% · 30yr
- Down + closing
- —
- Monthly P&I
- —
- Monthly cashflow
- —
- DSCR
- —
- Eligible?
- —
Personal DTI + credit; lowest rate.
DSCR
20% down · 8.5% · 30yr
- Down + closing
- —
- Monthly P&I
- —
- Monthly cashflow
- —
- DSCR
- —
- Eligible?
- —
No personal income docs; deal must DSCR.
Hard money
10% down · 12.0% · 12mo
- Down + closing
- —
- Monthly P&I
- —
- Monthly cashflow
- —
- DSCR
- —
- Eligible?
- —
Short-term bridge; refi at stabilization.
Rent comps 7 comps
| Address | Beds | Baths | Sqft | Rent | $/sqft | DOM | Units | Dist |
|---|---|---|---|---|---|---|---|---|
| 3129 Old Fairhaven Pkwy Bellingham, WA | 2.0 | 1.0 | 711 | $2,310 | $3.25 | 13d | 2 | 0.74mi |
| 2707 Connelly Ave Bellingham, WA | 2.0 | 2.0 | 1018 | $2,495 | $2.45 | 13d | 1 | 0.89mi |
| 2214 Wilson Ave Unit B Bellingham, WA | 2.0 | 1.5 | 900 | $1,900 | $2.11 | 13d | 1 | 1.24mi |
| 705 32nd St Bellingham, WA | 3.0 | 1.0–2.0 | 792 | $2,095 | $2.65 | 21d | 23 | 1.39mi |
| 2506 Douglas Ave Bellingham, WA | 2.0 | 1.0 | 880 | $1,875 | $2.13 | 13d | 2 | 1.41mi |
| 1021 24th St Unit 1021 9 Bellingham, WA | 2.0 | 1.0 | 800 | $1,595 | $1.99 | 21d | 1 | 1.44mi |
| 2102 Harris Ave Unit 2106-3 Bellingham, WA | 2.0 | 1.0 | 850 | $1,825 | $2.15 | 13d | 1 | 1.45mi |
Listing history 26 events
-
2026-05-21status Pending
-
2026-05-13$89,500 Active
-
2013-12-31historical
-
2013-12-31soldstatus $30,000 Sold
-
2013-12-18status Pending
-
2013-12-06status Pending Inspection
-
2013-12-02$35,000 Active
-
2013-09-16soldstatus $30,000 Sold
-
2013-09-09status Pending Inspection
-
2013-09-02$34,000 Active
-
2012-11-21historical
-
2012-11-19soldstatus $33,000 Sold
-
2012-11-07status Pending Inspection
-
2012-11-01price $33,900
-
2012-10-12price $37,000
-
2012-08-23price $41,000
-
2012-07-13$47,500 Active
-
2009-05-26soldstatus $10,000 Sold
-
2009-05-20historical
-
2009-04-02status
-
2009-02-23historical
-
2009-02-03price $39,900
-
2008-11-12price $49,900
-
2008-10-29$54,900
-
2005-03-01soldstatus $55,000
-
2004-11-03$55,000
ⓘ Source: listings_history table (triggers on properties + properties_extension) + one-shot
backfill from property_details.listing_events for pre-trigger history.
Tax reassessment forecast WA · Resets to sale price
- Current annual tax
- $378 · $32/mo
- Projected year-2 tax
- $877 · $73/mo
- Expected delta
- +$499/yr (+$42/mo · 131.7%)
ⓘ Screening estimate from a state-policy table — verify with the county assessor before closing.
Climate risk First Street
- Flood 1/10 Low FEMA zone X (unshaded) · 0% chance over 30 yrs
- Wildfire 1/10 Low
- Heat 1/10 Low 7 d/yr ≥83°F today · 17 d/yr by 30 yrs out
- Wind 1/10 Low
- Air quality 6/10 Major 9 unhealthy d/yr today · 10 by 30 yrs out
Nearby sold comps map
Loading sold comps map…
Walkable amenities ~0.75 mi
Loading nearby amenities…
Taxation est. · year 1
- Rental income
- $25,434
- − Mortgage interest
- −$5,013
- − Property taxes
- −$378
- − Insurance
- −$448
- − Repairs & maintenance
- −$2,035
- − Management
- −$2,035
- − Depreciation
- −$2,604
- Taxable income
- $12,922
- Est. tax owed @ 24.0%
- −$3,101
- After-tax cash flow
- $10,534/yr
For passive investors: Depreciation is non-cash, so a rental often shows a tax loss while cash-flowing — sheltering income. Rental losses are passive: they offset passive income freely, and up to $25,000/yr can offset ordinary (W-2) income if you actively participate and your MAGI is under $100k (phasing out to $0 by $150k); unused losses carry forward. On sale, claimed depreciation is recaptured at up to 25%, and gains may owe capital-gains tax (a 1031 exchange can defer both). Figures are a year-1 estimate at your 24.0% rate — not tax advice; consult a CPA.
Schools (NCES district)
- District
- Bellingham School District
- NCES district ID
- 5300420
- Math proficiency
- 47% ▼ -6.00%
- Reading proficiency
- 63% ▼ -1.00%
- Median HH income
- $47,678
- Composite
- 48.49/100
- National rank
- #4632
- State rank
- #106 of 291 in WA
Livability — Bellingham
- Score
- 80/100
- State rank
- #102
- US rank
- #1947
Category grades
Schools grade is shown separately in the Schools card above.
Census & demographics
- Census place
- Bellingham, WA
- County
- Whatcom County · 209,776 people
- City population
- 130,296
- Metro
- Bellingham, WA
- Population (ZIP)
- 33,298
- Household income
- $90,945
- Rent vs Own
- Severe rent burden
- 1040.0
Population outlook (Whatcom County) Hauer SSP2
- Today (2025)
- 240,408 people
- By 2030
- 254,667 · +5.9%
- By 2040
- 281,365 · +17.0%
- By 2050
- 307,592 · +27.9%
- By 2075
- 375,576 · +56.2%
- By 2100
- 421,637 · +75.4%
Race, ethnicity, and origin ACS 2023
- Neighborhood character
- Predominantly White (77%)
- Race & ethnicity
- White 77% Two or more races 13% Hispanic / Latino 10% Asian 3%
- Hispanic origin (detail)
- Mexican 8%
- Common ancestry
- Portuguese 6% Italian 4% Slovak 4%
- Foreign-born
- 8% · Canada, China, Vietnam
- Languages at home
- 88% English-only · Spanish 7% Chinese 1% German/W. Germanic 1%
Political lean MEDSL · Whatcom
- 2024 margin
- Strong D (+24.9) · D 60.8% · R 35.9% · Other 3.3%
- 2008→2024 swing
- +6.9pp toward D · 2008: 18.0pp · 2024: 24.9pp
- All cycles
- 2024: D+24.9 2020: D+23.9 2016: D+17.7 2012: D+12.1 2008: D+18.0
Not yet ingested
- Civics
- —
Market trends
- HPI YoY
- ▼ -652.00%
- Current HPI
- 413.1478
- Rent YoY
- ▲ 3.38%
- Metro
- Bellingham, WA
- State GDP YoY
- ▲ 4.65%
- F500 in state
- 22
Industry mix (Fortune 500 HQ in WA)
| Industry | F500 HQs | Revenue |
|---|---|---|
| Retail | 2 | $269B |
|
||
| Technology / Retail | 1 | $638B |
|
||
| Technology | 1 | $245B |
|
||
| Telecommunications | 1 | $38B |
|
||
| Food / Beverage | 1 | $36B |
|
||
| Automotive / Trucks | 1 | $34B |
|
||
Price history
+62.7% since first listed26 events — show timeline
- 2026-05-21 Pending — NWMLS as Distributed by MLS Grid
- 2026-05-13 Listed $89,500 NWMLS as Distributed by MLS Grid
- 2013-12-31 Delisted — NWMLS as Distributed by MLS Grid
- 2013-12-31 Sold (MLS) $30,000 NWMLS as Distributed by MLS Grid
- 2013-12-18 Pending — NWMLS as Distributed by MLS Grid
- 2013-12-06 Pending — NWMLS as Distributed by MLS Grid
- 2013-12-02 Listed $35,000 NWMLS as Distributed by MLS Grid
- 2013-09-16 Sold (MLS) $30,000 NWMLS as Distributed by MLS Grid
- 2013-09-09 Pending — NWMLS as Distributed by MLS Grid
- 2013-09-02 Listed $34,000 NWMLS as Distributed by MLS Grid
- 2012-11-21 Delisted — NWMLS as Distributed by MLS Grid
- 2012-11-19 Sold (MLS) $33,000 NWMLS as Distributed by MLS Grid
- 2012-11-07 Pending — NWMLS as Distributed by MLS Grid
- 2012-11-01 Price Changed $33,900 NWMLS as Distributed by MLS Grid
- 2012-10-12 Price Changed $37,000 NWMLS as Distributed by MLS Grid
- 2012-08-23 Price Changed $41,000 NWMLS as Distributed by MLS Grid
- 2012-07-13 Listed $47,500 NWMLS as Distributed by MLS Grid
- 2009-05-26 Sold (MLS) $10,000 NWMLS as Distributed by MLS Grid
- 2009-05-20 Delisted — NWMLS as Distributed by MLS Grid
- 2009-04-02 Relisted — NWMLS as Distributed by MLS Grid
- 2009-02-23 Delisted — NWMLS as Distributed by MLS Grid
- 2009-02-03 Price Changed $39,900 NWMLS as Distributed by MLS Grid
- 2008-11-12 Price Changed $49,900 NWMLS as Distributed by MLS Grid
- 2008-10-29 Listed $54,900 NWMLS as Distributed by MLS Grid
- 2005-03-01 Sold (MLS) $55,000 NWMLS as Distributed by MLS Grid
- 2004-11-03 Listed $55,000 NWMLS as Distributed by MLS Grid
Property tax history
+0.3%/yrLatest (2015): $378 · -1.4% YoY. Source: county tax records.
Cash-flow waterfall
monthlySold comps — $/sqft
last 12 mo · ≤1 miLoading sold comps…