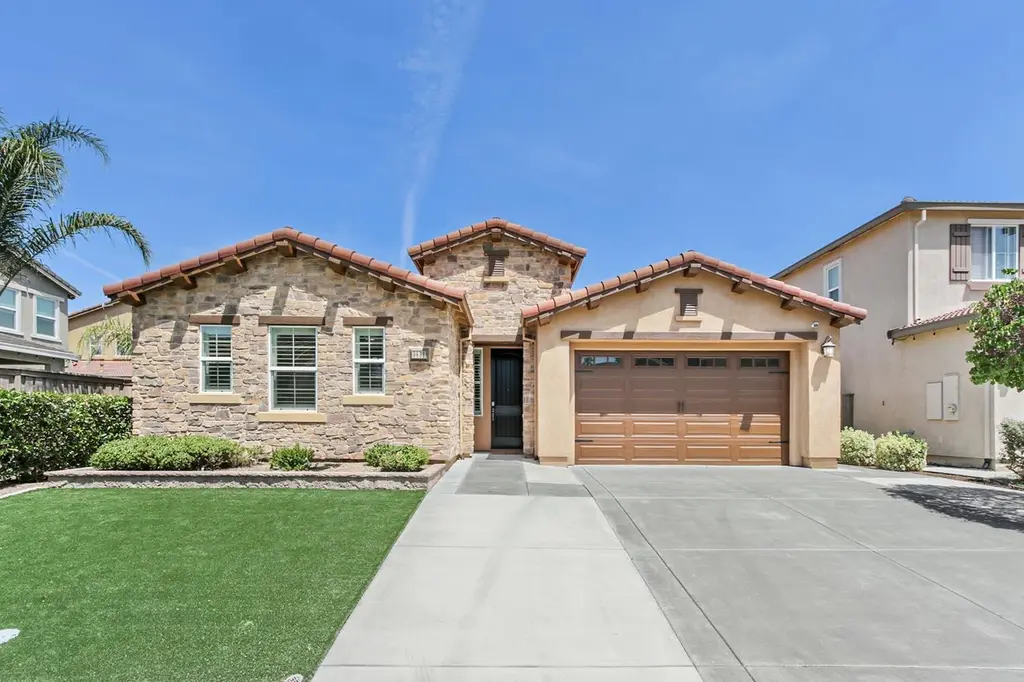
9832 Allen Ranch Way · Elk Grove, CA
Flood risk 1/10 · Minimal
- FEMA flood zone
- X (unshaded)
- Chance of flooding over 30 yrs
- 0.0%
- Est. flood insurance / yr
- $507 – $1,088
Fire risk 4/10 · Minor
- Est. fire insurance / yr
- $659 – $1,223
Heat risk 7/10 · Major
- Hot days now (above 102°F)
- 7 days/yr
- Hot days in 30 yrs
- 15 days/yr
Wind risk 1/10 · Minimal
- Chance of severe wind over 30 yrs
- —
Air-quality risk 10/10 · Severe
- Unhealthy air days now
- 25 days/yr
- Unhealthy air days in 30 yrs
- 27 days/yr
Risk factors via First Street. Map © Google.
Why this score? — see what drove the D grade
The composite is a weighted blend of 9 inputs, each scored 0–100. Each bar is that input's sub-score; the figure is the points it added to the 100-point composite (weight × sub-score).
- ARV discount +12.7/15.0
- Appreciation +10.0/10.0
- Schools +4.1/10.0
- Cash flow +3.6/30.0
- Rent growth +3.6/5.0
- Livability +3.6/5.0
- Condition / age +2.5/5.0
- 1% rule +0.0/10.0
- DSCR +0.0/10.0
$699,990
🖨 Deal sheet (PDF) 📄 Offer letter ✓ Due diligence
Listing remarks
Imagine pulling up to a striking stone-faced Mediterranean on a quiet Elk Grove street, stepping through the front door, and feeling immediately at home. Welcome to this beautifully upgraded 4-bed, 3-bath single-story residence in Parkgate where thoughtful touches and everyday comfort meet California living at its best. Inside, rich wood flooring stretches through a truly open great room designed for gathering. The kitchen is beautifully appointed with white cabinetry wrapping every wall, a full granite slab backsplash, gas cooktop, built-in wall oven and microwave, and a large center island with seating and double sink. A walk-in pantry and wine rack keep everything organized, and the slid
Key facts
- Gas cooktop
- Large center island
- Open great room
Tags
Property features AI
Finance
- HOA & community: No homeowners association
Exterior
- Parking: Attached garage with interior access, garage door opener and garage facing front; 2-car garage; Sidewalks with curb and gutter
- Utilities: Public water; Public sewer; Natural gas connected; Cable and internet available; 220 volts in kitchen
- Home design: Detached single-family residence; One story; Built in 2015
- Construction: Tile roof; Detached construction
- Exterior features: Backyard with wood fencing (fenced); Auto sprinkler front and rear
Interior
- Kitchen: Granite counters and island with sink; Breakfast area and pantry closet; Kitchen open to family room; Built-in electric oven; Gas cooktop; Hood over range; Self-cleaning oven; Microwave; Dishwasher; Disposal; Plumbed for ice maker; Free standing refrigerator
- Bedrooms: 4 bedrooms
- Flooring: Simulated wood flooring
- Bathrooms: 3 full bathrooms; Master bath with shower stall, tub, double sinks, quartz surfaces, walk-in closet(s) and window; Other bathrooms feature shower stalls, double sinks, windows and quartz surfaces
- Heating & cooling: Central heating; Central air conditioning; Ceiling fans
- Interior features: Covered patio; Dual-pane and Low-E windows with screens and window coverings; Main level includes bedroom(s), family room, master bedroom, full bath(s), garage, kitchen, and street entrance
- Laundry & utility: Inside laundry room with cabinets and sink; Washer and dryer included; Electric and gas hook-up available
Neighborhood map
What this means for you Summary
Snapshot
- This is a 4-bed/3.0-bath single-family listed at $700k.
Deal economics
- At list price, monthly cash flow is $-2k ($-25k/yr) — negative.
- To cash-flow at today's rent, offer at most $333k (52.4% below list).
- To meet the 1% rule (rent ≥ 1% of price), the offer needs to be $343k (51.0% below list).
- Recommended offer: $333k (52.4% below list) — sets the bar for cash-flow.
Location & tenants
- Location reads 71/100 on livability (#212 in CA) — a middle-class / working-renter tenant base. Strengths: employment A+, housing A+, crime B+; Watch: commute F, cost of living F.
- Elk Grove Unified (suburban): math 40% / reading 51% proficiency, ranked #165 of 517 in CA (top 32%) — families likely to look elsewhere, expect single-tenant / working-renter base with shorter leases.
- Zoned schools: Arlene Hein Elementary (math 57% / reading 60%, grade B-, #265 of 1,571 statewide, top 17%, 846 students, 30% FRL); Elizabeth Pinkerton Middle (math 53% / reading 70%, grade B+, #52 of 498 statewide, top 11%, 982 students, 29% FRL); Cosumnes Oaks High (math 58% / reading 73%, grade B, #157 of 1,170 statewide, top 14%, 2,212 students, 31% FRL).
- Zoned-school proficiency averages 62% at this address vs 46% district-wide (+16 pts) — the actual schools serving this property are materially stronger than the Elk Grove Unified average implies; a family-tenant draw the district grade alone would hide.
- Market conditions: Rents rising fast (+4.5%/yr); 297 active listings in the ZIP; 31 comparable units currently listed for rent nearby; rentals at typical pace (median 22d on market — plan ~3-4 weeks tenant-placement turnaround); high-income renter base; 6,825 units permitted in Sacramento County in 2024 (1,752 in 5+ unit buildings).
Forward outlook
- In year one you build about $75k of equity ($5k loan paydown + $70k appreciation (10.0% local appreciation)).
- Sacramento County population projected at +17% by 2050 — long-run rental-demand tailwind backs the buy-and-hold thesis.
- By year 2, paydown + projected appreciation supports a ~$120k cash-out refi (75% LTV) — recoverable capital for the next deal without selling this one.
Negotiation context
- Only 7 days on market — expect competitive offers; lowballing is unlikely to land.
Risks & watch-outs
- Climate carrying-cost: extreme-heat days projected 7→15/yr by 2055 (HVAC capex compounding) — expect insurance premiums to compound above CPI over the hold.
Questions for the listing agent
- What do current leases actually rent for vs. the listed asking? Can we see a recent rent roll and the last 12 months of T-12 income?
- Is there a deadline driving the sale (1031 exchange, divorce, estate, relocation)? That informs how much negotiation room exists.
- Schools are B-rated — typically a magnet for longer-tenancy family renters. What's the average tenant stay here, and is there a school-zone premium baked into asking?
- The area grade is low — what's the realistic commute time and amenity access for the typical tenant pool here? Any planned neighborhood developments (good or bad) we should know about?
- What's the average days-on-market for RENTAL listings here right now (not sales)? A rising rental-DOM trend means longer vacancies and softer asking-rent achievability than the comps imply.
- What's the recent tenant-quality profile in this submarket — average credit score on applications, eviction rate, late-payment / NSF rate, and stable-employment percentage? A property-management company in the area should have these aggregated.
- How much new for-sale + rental construction is in the pipeline within 1–3 miles? Heavy new supply typically softens prices + rents 12–24 months out; constrained supply supports both.
Investment metrics
- 1% rule
- 0.49% ✗
- Cap rate
- 2.73%
- Cash-on-cash
- -12.72%
- DSCR
- 0.43
- GRM
- 17.0
CMA / ARV
- ARV (median comp)
- $790,478
- List price
- $699,990
- Delta
- -11.45%
- Verdict
- UNDERPRICED
- Comps
- 20 within 1.0 mi
Show comp detail 12 sales within ~0.75 mi
| Address | Dist | Beds/Ba | Sqft | Sold | Price | $/sf | Match |
|---|---|---|---|---|---|---|---|
| 8353 Largo Way | 0.13mi | 3/2.5 (-1) | 2,203 (0%) | 11mo | $755,000 | $343 | 78 |
| 8337 Columbo Cir | 0.23mi | 3/2.5 (-1) | 2,203 (0%) | 9mo | $685,000 | $311 | 75 |
| 9773 Carico Way | 0.37mi | 4/2.5 | 2,194 (-0%) | 10mo | $628,000 | $286 | 71 |
| 9836 Partington Cir | 0.27mi | 4/2.5 | 2,301 (+4%) | 10mo | $660,000 | $287 | 70 |
| 10032 Wagoner Way | 0.61mi | 3/3.0 (-1) | 2,127 (-3%) | 0mo | $705,000 | $331 | 60 |
| 9628 Oak Reserve Ln | 0.73mi | 3/2.5 (-1) | 2,254 (+2%) | 4mo | $617,500 | $274 | 52 |
| 9916 Bluefin Way | 0.34mi | 4/2.0 | 1,904 (-14%) | 10mo | $662,000 | $348 | 49 |
| 8215 Red Elk Dr | 0.74mi | 5/2.5 (+1) | 2,184 (-1%) | 10mo | $600,000 | $275 | 49 |
| 8012 Spiess Ct | 0.58mi | 4/2.0 | 2,038 (-8%) | 11mo | $667,500 | $328 | 48 |
| 9995 Swordfish Cir | 0.74mi | 4/3.0 | 2,352 (+7%) | 8mo | $697,000 | $296 | 47 |
| 10016 Wagoner Way | 0.58mi | 4/3.0 | 2,476 (+12%) | 8mo | $925,000 | $374 | 46 |
| 9730 Clemenza Way | 0.73mi | 5/3.0 (+1) | 2,409 (+9%) | 11mo | $700,000 | $291 | 36 |
Match score weights: distance 35% · size 25% · config 20% · recency 20%. Top-matched comps best support the ARV.
Projected returns pro-forma
10.0% appreciation · 4.54% rent growth · sell at horizon
- IRR
- 15.7%
- Equity multiple
- 2.30×
- Total profit
- $254,386
- Equity at exit
- $630,606
- IRR
- 15.4%
- Equity multiple
- 5.41×
- Total profit
- $864,853
- Equity at exit
- $1,359,927
Cash invested: $195,997 (down + closing). Projections, not guarantees.
Landlord ↔ Tenant lean methodology
- Overall (STATE)
- 18 Strongly Tenant-Friendly
- State California
- 18 Strongly Tenant-Friendly · D+13
- County
- — inherits STATE
- City
- — inherits STATE
ZIP-level market 95757
- Home prices YoY
- 13.5%
- Rents YoY
- 4.5%
- Active inventory
- 297
- Price-to-rent
- 17.0×
Monthly cashflow live
- Estimated rent
- $3,433 high interval (Pro) →
- Mortgage (P&I)
- −$3,671
- Tax from tax record
- −$826 /mo · $9,917/yr
- Insurance
- −$292
- HOA
- −$0
- Vacancy / Maint / Mgmt
- −$721
- Net cashflow
- $-2,077
Break-even live
Sensitivity live
| Price | -10% $-1,681 | -5% $-1,879 | +0% $-2,077 | +5% $-2,275 | +10% $-2,473 |
|---|---|---|---|---|---|
| Rent | -10% $-2,348 | -5% $-2,212 | +0% $-2,077 | +5% $-1,941 | +10% $-1,806 |
| Rate | -1.0pp $-1,724 | -0.5pp $-1,899 | base $-2,077 | +0.5pp $-2,258 | +1.0pp $-2,443 |
UW: 25.0% down · 7.5% · 30yr · 1.5% tax · 5.0% vac · 8.0% maint · 8.0% mgmt
Financing live
Cash to close
- Down payment
- $174,998
- Closing costs
- $21,000
- Reserves months
- —
- Total cash needed
- —
Loan-product check · same deal, 3 products live
Conventional
25% down · 7.5% · 30yr
- Down + closing
- —
- Monthly P&I
- —
- Monthly cashflow
- —
- DSCR
- —
- Eligible?
- —
Personal DTI + credit; lowest rate.
DSCR
20% down · 8.5% · 30yr
- Down + closing
- —
- Monthly P&I
- —
- Monthly cashflow
- —
- DSCR
- —
- Eligible?
- —
No personal income docs; deal must DSCR.
Hard money
10% down · 12.0% · 12mo
- Down + closing
- —
- Monthly P&I
- —
- Monthly cashflow
- —
- DSCR
- —
- Eligible?
- —
Short-term bridge; refi at stabilization.
Rent comps 31 comps
| Address | Beds | Baths | Sqft | Rent | $/sqft | DOM | Units | Dist |
|---|---|---|---|---|---|---|---|---|
| 9773 Philta Way Elk Grove, CA | 4.0 | 2.5 | 2564 | $3,500 | $1.37 | 6d | 1 | 0.30mi |
| 8418 Everson Ln Elk Grove, CA | 4.0 | 3.0 | 2476 | $3,400 | $1.37 | 25d | 1 | 0.71mi |
| 9534 Sunlight Ln Elk Grove, CA | 3.0 | 2.0 | 1427 | $2,650 | $1.86 | 19d | 1 | 0.72mi |
| 10110 Elise Way Elk Grove, CA | 3.0 | 2.5 | 1628 | $3,300 | $2.03 | 9d | 1 | 0.83mi |
| 10114 Elise Way Elk Grove, CA | 4.0 | 3.0 | 2214 | $2,995 | $1.35 | 9d | 1 | 0.84mi |
| 7706 Brabham Way Elk Grove, CA | 3.0 | 2.0 | 1434 | $2,995 | $2.09 | 45d | 1 | 0.92mi |
| 8008 Poppy Ridge Rd Elk Grove, CA | 4.0 | 3.0 | 2073 | $3,375 | $1.63 | 25d | 1 | 0.97mi |
| 10123 Blue Whale Way Elk Grove, CA | 4.0 | 3.0 | 2445 | $4,200 | $1.72 | 18d | 1 | 0.98mi |
| 7405 Rothschild Ct Elk Grove, CA | 3.0 | 2.0 | 1859 | $2,650 | $1.43 | 4d | 1 | 1.00mi |
| 8420 Mondale Way Elk Grove, CA | 4.0 | 3.0 | 2450 | $3,950 | $1.61 | 45d | 1 | 1.04mi |
| 8471 Anker Way Elk Grove, CA | 4.0 | 2.5 | 2107 | $3,200 | $1.52 | 25d | 1 | 1.09mi |
| 8403 Sinesky Way Elk Grove, CA | 3.0 | 2.0 | 1579 | $2,995 | $1.90 | 12d | 1 | 1.10mi |
| 8144 Crystal Walk Cir Elk Grove, CA | 4.0 | 2.5 | 1727 | $2,599 | $1.50 | 14d | 1 | 1.12mi |
| 10365 Bayson Way Elk Grove, CA | 4.0 | 3.0 | 2018 | $3,300 | $1.64 | 22d | 1 | 1.13mi |
| 10365 Bayson Way Elk Grove, CA | 4.0 | 3.0 | 2018 | $3,300 | $1.64 | 23d | 1 | 1.13mi |
| 8464 Crystal Walk Cir Elk Grove, CA | 4.0 | 2.5 | 1727 | $2,595 | $1.50 | 5d | 1 | 1.17mi |
| 8358 Akino Ct Elk Grove, CA | 4.0 | 3.5 | 2321 | $3,200 | $1.38 | 45d | 1 | 1.18mi |
| 8371 Valpane Way Elk Grove, CA | 4.0 | 3.0 | 2018 | $3,250 | $1.61 | 0d | 1 | 1.18mi |
| 8461 Crystal Walk Cir Elk Grove, CA | 3.0 | 2.5 | 2250 | $2,600 | $1.16 | 46d | 1 | 1.19mi |
| 9867 Tarzo Way Elk Grove, CA | 3.0 | 3.0 | 1905 | $2,700 | $1.42 | 45d | 1 | 1.20mi |
| 10333 Tempier Way Elk Grove, CA | 3.0 | 3.0 | 2795 | $3,350 | $1.20 | 45d | 1 | 1.23mi |
| 10333 Tempier Way Elk Grove, CA | 3.0 | 2.5 | 2795 | $3,195 | $1.14 | 19d | 1 | 1.23mi |
| 8151 Lavigne Cir Elk Grove, CA | 4.0 | 3.0 | 2928 | $3,445 | $1.18 | 45d | 1 | 1.28mi |
| 10446 Tamburlane Dr Elk Grove, CA | 4.0 | 3.5 | 2693 | $3,495 | $1.30 | 45d | 1 | 1.28mi |
| 9316 Caulfield Dr Elk Grove, CA | 3.0 | 2.0 | 1550 | $3,950 | $2.55 | 45d | 1 | 1.33mi |
| 8376 Solfrid Way Elk Grove, CA | 4.0 | 3.0 | 2070 | $3,200 | $1.55 | 19d | 1 | 1.33mi |
| 8357 Eleodoro Way Elk Grove, CA | 3.0 | 2.5 | 1730 | $3,245 | $1.88 | 4d | 1 | 1.35mi |
| 7104 Saltgrass Way Elk Grove, CA | 3.0 | 2.0 | 1818 | $2,750 | $1.51 | 45d | 1 | 1.46mi |
| 10350 Ducasse Way Elk Grove, CA | 3.0 | 3.5 | 2586 | $3,495 | $1.35 | 0d | 1 | 1.48mi |
| 9270 Emerald Crest Dr Elk Grove, CA | 3.0 | 2.0 | 1454 | $2,550 | $1.75 | 6d | 1 | 1.49mi |
| 8357 Luan Way Elk Grove, CA | 3.0 | 2.0 | 1967 | $2,895 | $1.47 | 21d | 1 | 1.50mi |
Tax reassessment forecast CA · Resets to sale price
- Current annual tax
- $9,917 · $826/mo
- Projected year-2 tax
- $9,917 · $826/mo
- Expected delta
- $0/yr ($0/mo · 0.0%)
ⓘ Screening estimate from a state-policy table — verify with the county assessor before closing.
Climate risk First Street
- Flood 1/10 Low FEMA zone X (unshaded) · 0% chance over 30 yrs
- Wildfire 4/10 Moderate
- Heat 7/10 Severe 7 d/yr ≥102°F today · 15 d/yr by 30 yrs out
- Wind 1/10 Low
- Air quality 10/10 Extreme 25 unhealthy d/yr today · 27 by 30 yrs out
Nearby sold comps map
Loading sold comps map…
Walkable amenities ~0.75 mi
Loading nearby amenities…
Taxation est. · year 1
- Rental income
- $41,197
- − Mortgage interest
- −$39,210
- − Property taxes
- −$9,917
- − Insurance
- −$3,500
- − Repairs & maintenance
- −$3,296
- − Management
- −$3,296
- − Depreciation
- −$20,363
- Taxable loss
- −$38,385
- Est. tax savings @ 24.0%
- +$9,212
- After-tax cash flow
- $-15,709/yr
For passive investors: Depreciation is non-cash, so a rental often shows a tax loss while cash-flowing — sheltering income. Rental losses are passive: they offset passive income freely, and up to $25,000/yr can offset ordinary (W-2) income if you actively participate and your MAGI is under $100k (phasing out to $0 by $150k); unused losses carry forward. On sale, claimed depreciation is recaptured at up to 25%, and gains may owe capital-gains tax (a 1031 exchange can defer both). Figures are a year-1 estimate at your 24.0% rate — not tax advice; consult a CPA.
Schools (NCES district)
- District
- Elk Grove Unified
- NCES district ID
- 0612330
- Math proficiency
- 40% ▼ -5.00%
- Reading proficiency
- 51% ▼ -5.00%
- Median HH income
- $67,860
- Composite
- 40.72/100
- National rank
- #3658
- State rank
- #165 of 517 in CA
Livability — Elk Grove
- Score
- 71/100
- State rank
- #212
- US rank
- #6681
Category grades
Schools grade is shown separately in the Schools card above.
Census & demographics
- Census place
- Elk Grove, CA
- County
- Sacramento County · 1,539,646 people
- City population
- 190,119
- Metro
- Sacramento-Roseville-Folsom, CA
- Population (ZIP)
- 56,764
- Household income
- $138,198
- Rent vs Own
- Severe rent burden
- 1121.0
Population outlook (Sacramento County) Hauer SSP2
- Today (2025)
- 1,660,763 people
- By 2030
- 1,732,990 · +4.3%
- By 2040
- 1,855,755 · +11.7%
- By 2050
- 1,941,335 · +16.9%
- By 2075
- 2,046,162 · +23.2%
- By 2100
- 1,961,444 · +18.1%
Race, ethnicity, and origin ACS 2023
- Neighborhood character
- Highly diverse neighborhood (Simpson 0.75)
- Race & ethnicity
- Asian 40% White 21% Hispanic / Latino 18% Two or more races 14% Black 11% Pacific Islander 1%
- Hispanic origin (detail)
- Mexican 14%
- Common ancestry
- Russian 1% Italian 1% Portuguese 1%
- Foreign-born
- 28% · China, Canada, Vietnam
- Languages at home
- 62% English-only · Spanish 8% Other Indo-European 7% Chinese 7%
Political lean MEDSL · Sacramento
- 2024 margin
- D (+19.7) · D 58.1% · R 38.4% · Other 3.5%
- 2008→2024 swing
- +0.7pp no change · 2008: 19.0pp · 2024: 19.7pp
- All cycles
- 2024: D+19.7 2020: D+25.3 2016: D+23.7 2012: D+16.3 2008: D+19.0
Not yet ingested
- Civics
- —
Market trends
- HPI YoY
- ▲ 39.15%
- Current HPI
- 328.5885
- Rent YoY
- ▲ 4.54%
- Metro
- Sacramento-Roseville-Folsom, CA
- State GDP YoY
- ▲ 3.21%
- F500 in state
- 116
Industry mix (Fortune 500 HQ in CA)
| Industry | F500 HQs | Revenue |
|---|---|---|
| Technology | 27 | $1,492B |
|
||
| Financial Services | 3 | $174B |
|
||
| Retail | 3 | $44B |
|
||
| Insurance | 3 | $26B |
|
||
| Media / Entertainment | 2 | $115B |
|
||
| Pharmaceuticals / Biotech | 2 | $62B |
|
||
Property tax history
+9.0%/yrLatest (2025): $9,917 · +1.9% YoY. Source: county tax records.
Cash-flow waterfall
monthlySold comps — $/sqft
last 12 mo · ≤1 miLoading sold comps…