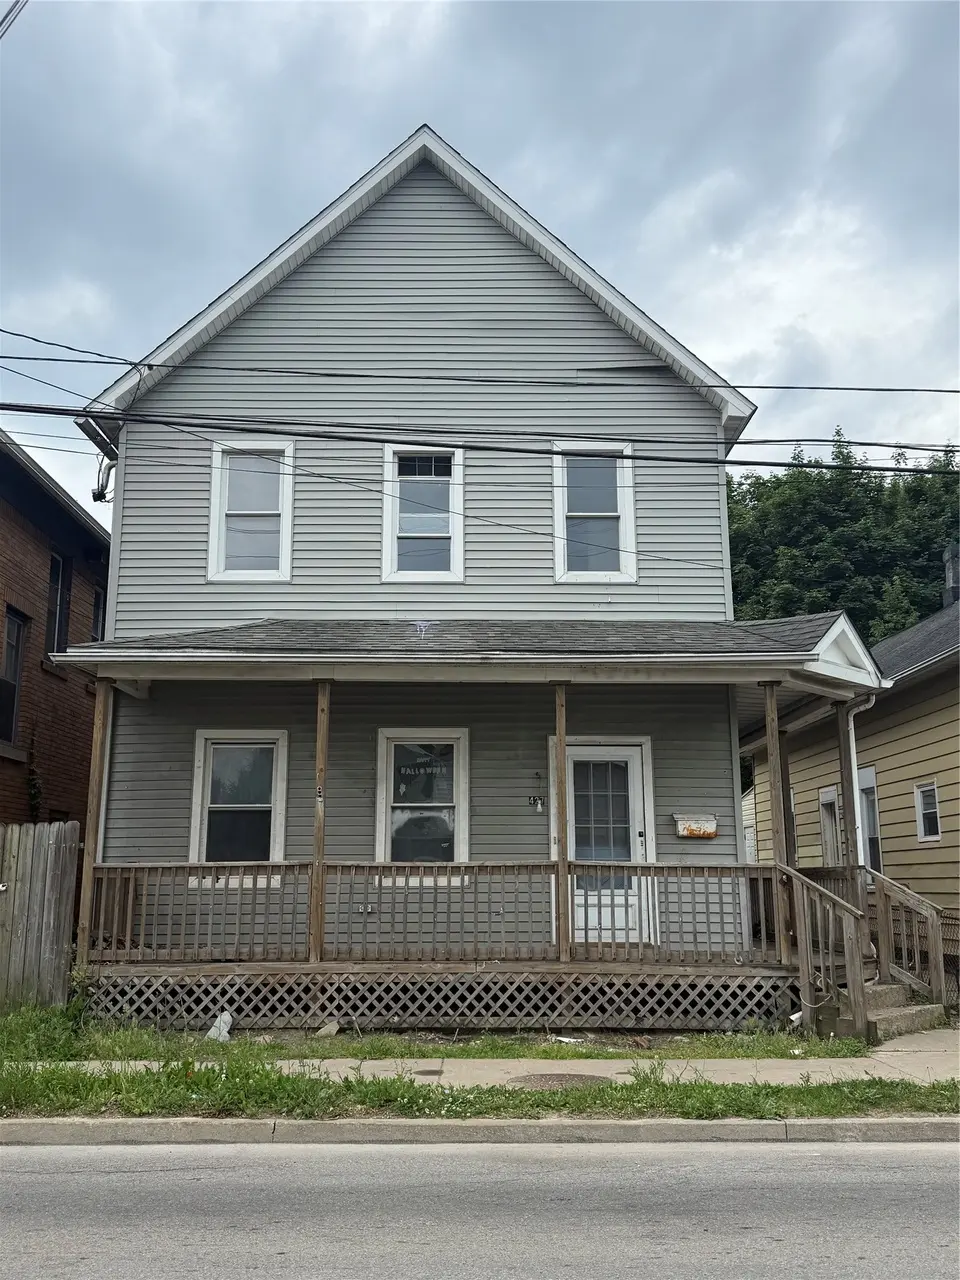
427 W 18th St · Erie, PA
Flood risk 1/10 · Minimal
- FEMA flood zone
- X (unshaded)
- Chance of flooding over 30 yrs
- 0.0%
- Est. flood insurance / yr
- $473 – $860
Fire risk 1/10 · Minimal
- Est. fire insurance / yr
- $511 – $949
Heat risk 2/10 · Minimal
- Hot days now (above 90°F)
- 7 days/yr
- Hot days in 30 yrs
- 17 days/yr
Wind risk 1/10 · Minimal
- Chance of severe wind over 30 yrs
- —
Air-quality risk 2/10 · Minimal
- Unhealthy air days now
- 1 days/yr
- Unhealthy air days in 30 yrs
- 3 days/yr
Risk factors via First Street. Map © Google.
Why this score? — see what drove the B- grade
The composite is a weighted blend of 9 inputs, each scored 0–100. Each bar is that input's sub-score; the figure is the points it added to the 100-point composite (weight × sub-score).
- Cash flow +30.0/30.0
- 1% rule +10.0/10.0
- DSCR +10.0/10.0
- ARV discount +7.5/15.0
- Livability +4.2/5.0
- Rent growth +3.2/5.0
- Condition / age +2.5/5.0
- Schools +1.3/10.0
- Appreciation +0.0/10.0
$50,000
🖨 Deal sheet (PDF) 📄 Offer letter ✓ Due diligence
Listing remarks MLS
HUD CASE #442-274872. ALL PROPERTIES SOLD "AS-IS" WITHOUT ANY GUARANTEE OR WARRANTY BY SELLER. COOPERATING BROKERS MAY RECEIVE UP TO 3% COMMISSION, FHA FINANCING - INSURED ESCROW, PLEASE VISIT www. hudhomestore.com FOR BIDDING INFORMATION.
Key facts
- Newer roof
- Flat fenced backyard
- Mixed zoning area
Tags
Property features AI
Finance
- Other:
- Financial info:
- HOA & community:
Exterior
- Parking: 2 parking spaces (parking accessed from rear alley via Chestnut or Walnut Street)
- Security:
- Utilities: Public water; Public sewer
- Home design: Single-family residence; Two levels
- Construction: Frame construction
- Exterior features: Front porch; Asphalt roof; Lot is roughly 34 x 130 (approximately 0.1015 acres); Lot zoning: R-1
Interior
- Kitchen:
- Bedrooms: Total rooms: 9 (includes bedrooms and living spaces)
- Flooring: Other
- Bathrooms: 2 full bathrooms
- Heating & cooling: Forced air heating; Window AC unit(s)
- Interior features: Unfinished basement; Other flooring
- Laundry & utility:
Neighborhood map
What this means for you Summary
Snapshot
- This is a 4-bed/3.0-bath single-family listed at $50k.
Deal economics
- At list price, monthly cash flow is $733 ($9k/yr) — positive.
- The deal already cash-flows at list — no discount required.
- Meets the 1% rule at list price ($1k rent vs $50k).
- Cap rate 23.9% vs local median 5.4% in Erie — top-decile yield for the area; either an underpriced asset or a hidden risk that comps aren't pricing in. Stress-test before assuming the spread holds.
Location & tenants
- Location reads 83/100 on livability (#109 in PA, #840 nationally) — a professional / high-income tenant draw. Strengths: amenities A+, commute A+, cost of living A+; Watch: crime D+, employment F.
- Erie City SD (urban): math 12% / reading 19% proficiency, ranked #510 of 539 in PA (top 95%) — low school quality limits family demand, transient renter base, plan for 1-2y turnover; 81% free/reduced lunch — lower-income household profile, screen leases tightly.
- Zoned schools: Pfeiffer-Burleigh Sch (math 7% / reading 14%, grade F, #1,396 of 1,518 statewide, top 92%, 565 students, 100% FRL); Northwest Pa Collegiate Academy (math 82%, 753 students, 100% FRL) — zoned schools average 100% FRL vs 81% district-wide (19 pts higher); higher-poverty schools than district average — tighter screening recommended.
- Market conditions: Rents rising (+3.0%/yr); 56 active listings in the ZIP; 5 comparable units currently listed for rent nearby; rentals lingering (median 46d on market — plan ~5-8 weeks vacancy on turnover, expect pricing pressure); 100% of comp listings sitting > 30 days — soft ceiling on asking rent; lower-income renter base — watch delinquency; 364 units permitted in Erie County in 2024 (188 in 5+ unit buildings).
- This rent runs 42% of the median local income ($39k/yr) — at the standard rent-burdened threshold; future hikes will face affordability resistance.
Forward outlook
- Local home prices are declining (-3.0%/yr); year-one equity from $346 of loan paydown is wiped out by about $2k of value loss. Plan a longer hold.
- Erie County population projected at -14% by 2050 — secular population decline; favor cash flow + early exit over multi-decade hold.
- At projected returns (-3.0% appreciation + 3.0% rent growth), your $14k cash investment doubles in ~2 years — after that, you're playing with house money.
Negotiation context
- Only 1 days on market — expect competitive offers; lowballing is unlikely to land.
- 3 sale attempts since 9y ago; this cycle's ask has dropped $10k (17%) from the opening price — seller is motivated, your offer sets the floor, not the list.
- Current owner paid $14k; list at $50k implies a 245% gain — meaningful room to come down on a strong offer.
Risks & watch-outs
- Watch-outs: built in 1872 — expect roof / HVAC / electrical / plumbing capex.
Questions for the listing agent
- Built in 1872 — when were the roof, HVAC, electrical panel, plumbing, and water heater last replaced?
- Is there a deadline driving the sale (1031 exchange, divorce, estate, relocation)? That informs how much negotiation room exists.
- Crime grade is D in this area — have there been break-ins, vandalism, or insurance claims at this property in the last 3 years? What carrier currently insures it and at what premium?
- What's the average days-on-market for RENTAL listings here right now (not sales)? A rising rental-DOM trend means longer vacancies and softer asking-rent achievability than the comps imply.
- What's the recent tenant-quality profile in this submarket — average credit score on applications, eviction rate, late-payment / NSF rate, and stable-employment percentage? A property-management company in the area should have these aggregated.
- How much new for-sale + rental construction is in the pipeline within 1–3 miles? Heavy new supply typically softens prices + rents 12–24 months out; constrained supply supports both.
Investment metrics
- 1% rule
- 2.73% ✓
- Cap rate
- 23.88%
- Cash-on-cash
- 62.82%
- DSCR
- 3.79
- GRM
- 3.1
CMA / ARV
- ARV (on-the-fly)
- $172,032
- Comps found
- 4
Show comp detail 4 sales within ~0.75 mi
| Address | Dist | Beds/Ba | Sqft | Sold | Price | $/sf | Match |
|---|---|---|---|---|---|---|---|
| 422 W 9th St | 0.64mi | 4/2.0 | 2,794 (+4%) | 16mo | $265,000 | $95 | 46 |
| 922 Myrtle St | 0.61mi | 5/2.5 (+1) | 2,810 (+4%) | 13mo | $179,900 | $64 | 46 |
| 1627 Myrtle St | 0.23mi | 5/1.0 (+1) | 2,323 (-14%) | 14mo | $125,000 | $54 | 42 |
| 2716 Peach St | 0.73mi | 5/2.0 (+1) | 2,400 (-11%) | 23mo | $147,500 | $61 | 20 |
Match score weights: distance 35% · size 25% · config 20% · recency 20%. Top-matched comps best support the ARV.
Projected returns pro-forma
-3.0% appreciation · 2.97% rent growth · sell at horizon
- IRR
- 61.8%
- Equity multiple
- 3.75×
- Total profit
- $38,552
- Equity at exit
- $7,455
- IRR
- 66.3%
- Equity multiple
- 7.68×
- Total profit
- $93,587
- Equity at exit
- $4,323
Cash invested: $14,000 (down + closing). Projections, not guarantees.
Landlord ↔ Tenant lean methodology
- Overall (STATE)
- 62 Landlord-Friendly
- State Pennsylvania
- 62 Landlord-Friendly · EVEN
- County
- — inherits STATE
- City
- — inherits STATE
ZIP-level market 16502
- Home prices YoY
- -30.5%
- Rents YoY
- 3.0%
- Active inventory
- 56
- Price-to-rent
- 3.1×
Monthly cashflow live
- Estimated rent
- $1,365 medium interval (Pro) →
- Mortgage (P&I)
- −$262
- Tax est. 1.5%
- −$62 /mo · $750/yr
- Insurance
- −$21
- HOA
- −$0
- Vacancy / Maint / Mgmt
- −$287
- Net cashflow
- $733
Break-even live
Sensitivity live
| Price | -10% $767 | -5% $750 | +0% $733 | +5% $716 | +10% $698 |
|---|---|---|---|---|---|
| Rent | -10% $625 | -5% $679 | +0% $733 | +5% $787 | +10% $841 |
| Rate | -1.0pp $758 | -0.5pp $746 | base $733 | +0.5pp $720 | +1.0pp $707 |
UW: 25.0% down · 7.5% · 30yr · 1.5% tax · 5.0% vac · 8.0% maint · 8.0% mgmt
Financing live
Cash to close
- Down payment
- $12,500
- Closing costs
- $1,500
- Reserves months
- —
- Total cash needed
- —
Loan-product check · same deal, 3 products live
Conventional
25% down · 7.5% · 30yr
- Down + closing
- —
- Monthly P&I
- —
- Monthly cashflow
- —
- DSCR
- —
- Eligible?
- —
Personal DTI + credit; lowest rate.
DSCR
20% down · 8.5% · 30yr
- Down + closing
- —
- Monthly P&I
- —
- Monthly cashflow
- —
- DSCR
- —
- Eligible?
- —
No personal income docs; deal must DSCR.
Hard money
10% down · 12.0% · 12mo
- Down + closing
- —
- Monthly P&I
- —
- Monthly cashflow
- —
- DSCR
- —
- Eligible?
- —
Short-term bridge; refi at stabilization.
Rent comps 5 comps
| Address | Beds | Baths | Sqft | Rent | $/sqft | DOM | Units | Dist |
|---|---|---|---|---|---|---|---|---|
| 538 W 8th St Unit 1 Erie, PA | 3.0 | 1.0 | 2000 | $1,650 | $0.82 | 45d | 1 | 0.74mi |
| 729 W 9th St Erie, PA | 4.0 | 2.0 | 1782 | $3,000 | $1.68 | 45d | 1 | 0.76mi |
| 115 W 32nd St Erie, PA | 3.0 | 2.0 | 1844 | $1,050 | $0.57 | 45d | 1 | 0.98mi |
| 2702 Raspberry St Unit 1 Erie, PA | 3.0 | 1.0 | 2000 | $1,200 | $0.60 | 45d | 1 | 0.99mi |
| 126 W 38th St Erie, PA | 4.0 | 2.0 | 1850 | $4,000 | $2.16 | 45d | 1 | 1.30mi |
Listing history 11 events
-
2026-06-21days on market $50,000 Active 1 DOM
-
2026-06-19days on market $50,000 Active 10 DOM
-
2026-06-18days on market $50,000 Active 9 DOM
-
2026-06-17days on market $50,000 Active 8 DOM
-
2026-06-17price $50,000 Active 7 DOM
-
2026-06-16days on market $59,900 Active 7 DOM
-
2026-06-15days on market $59,900 Active 6 DOM
-
2026-06-14days on market $59,900 Active 4 DOM
-
2026-06-13days on market $59,900 Active 3 DOM
-
2026-06-10remarks 679-char remark
-
2026-06-10$59,900 Active 1 DOM
ⓘ Source: listings_history table (triggers on properties + properties_extension) + one-shot
backfill from property_details.listing_events for pre-trigger history.
Climate risk First Street
- Flood 1/10 Low FEMA zone X (unshaded) · 0% chance over 30 yrs
- Wildfire 1/10 Low
- Heat 2/10 Low 7 d/yr ≥90°F today · 17 d/yr by 30 yrs out
- Wind 1/10 Low
- Air quality 2/10 Low 1 unhealthy d/yr today · 3 by 30 yrs out
Nearby sold comps map
Loading sold comps map…
Walkable amenities ~0.75 mi
Loading nearby amenities…
Taxation est. · year 1
- Rental income
- $16,380
- − Mortgage interest
- −$2,801
- − Property taxes
- −$750
- − Insurance
- −$250
- − Repairs & maintenance
- −$1,310
- − Management
- −$1,310
- − Depreciation
- −$1,455
- Taxable income
- $8,504
- Est. tax owed @ 24.0%
- −$2,041
- After-tax cash flow
- $6,753/yr
For passive investors: Depreciation is non-cash, so a rental often shows a tax loss while cash-flowing — sheltering income. Rental losses are passive: they offset passive income freely, and up to $25,000/yr can offset ordinary (W-2) income if you actively participate and your MAGI is under $100k (phasing out to $0 by $150k); unused losses carry forward. On sale, claimed depreciation is recaptured at up to 25%, and gains may owe capital-gains tax (a 1031 exchange can defer both). Figures are a year-1 estimate at your 24.0% rate — not tax advice; consult a CPA.
Schools (NCES district)
- District
- Erie City SD
- NCES district ID
- 4209300
- Math proficiency
- 12% ▼ -11.00%
- Reading proficiency
- 19% ▼ -16.00%
- Median HH income
- $33,625
- Composite
- 12.59/100
- National rank
- #9617
- State rank
- #510 of 539 in PA
Livability — Erie
- Score
- 83/100
- State rank
- #109
- US rank
- #840
Category grades
Schools grade is shown separately in the Schools card above.
Census & demographics
- Census place
- Erie, PA
- County
- Erie County · 92,215 people
- City population
- 92,215
- Metro
- Erie, PA
- Population (ZIP)
- 15,995
- Household income
- $38,566
- Rent vs Own
- Severe rent burden
- 1044.0
Population outlook (Erie County) Hauer SSP2
- Today (2025)
- 272,159 people
- By 2030
- 266,299 · -2.2%
- By 2040
- 250,987 · -7.8%
- By 2050
- 234,925 · -13.7%
- By 2075
- 199,164 · -26.8%
- By 2100
- 162,985 · -40.1%
Race, ethnicity, and origin ACS 2023
- Neighborhood character
- Predominantly White (66%)
- Race & ethnicity
- White 66% Two or more races 16% Hispanic / Latino 13% Black 11% Asian 2%
- Hispanic origin (detail)
- Mexican 5% Puerto Rican 5%
- Common ancestry
- Romanian 7% Serbian 2% Italian 1%
- Foreign-born
- 5% · Canada
- Languages at home
- 89% English-only · Spanish 8% Other Indo-European 1% Russian/Polish/Slavic 1%
Political lean MEDSL · Erie
- 2024 margin
- Toss-up / Even · D 49.0% · R 50.0%
- 2008→2024 swing
- -20.9pp toward R · 2008: 19.9pp · 2024: -1.0pp
- All cycles
- 2024: R+1.0 2020: D+1.0 2016: R+2.0 2012: D+16.9 2008: D+19.9
Not yet ingested
- Civics
- —
Market trends
- HPI YoY
- ▼ -92.73%
- Current HPI
- 211.4408
- Rent YoY
- ▲ 2.97%
- Metro
- Erie, PA
- State GDP YoY
- ▲ 1.68%
- F500 in state
- 34
Industry mix (Fortune 500 HQ in PA)
| Industry | F500 HQs | Revenue |
|---|---|---|
| Healthcare | 2 | $309B |
|
||
| Insurance | 2 | $27B |
|
||
| Telecommunications / Media | 1 | $124B |
|
||
| Industrial Distribution | 1 | $22B |
|
||
| Financial Services | 1 | $20B |
|
||
| Chemicals / Materials | 1 | $18B |
|
||
Price history
+130.5% since first listed5 events — show timeline
- 2026-06-09 Listed $59,900 GEBOR
- 2025-12-18 Listed $59,900 GEBOR
- 2017-11-29 Sold (MLS) $14,500 GEBOR
- 2017-04-30 Listed $19,600 GEBOR
- 2003-06-06 Sold (Public Records) $25,990 Public Records
Property tax history
+4.0%/yrLatest (2026): $2,665 · +3.4% YoY. Source: county tax records.
Cash-flow waterfall
monthlySold comps — $/sqft
last 12 mo · ≤1 miLoading sold comps…