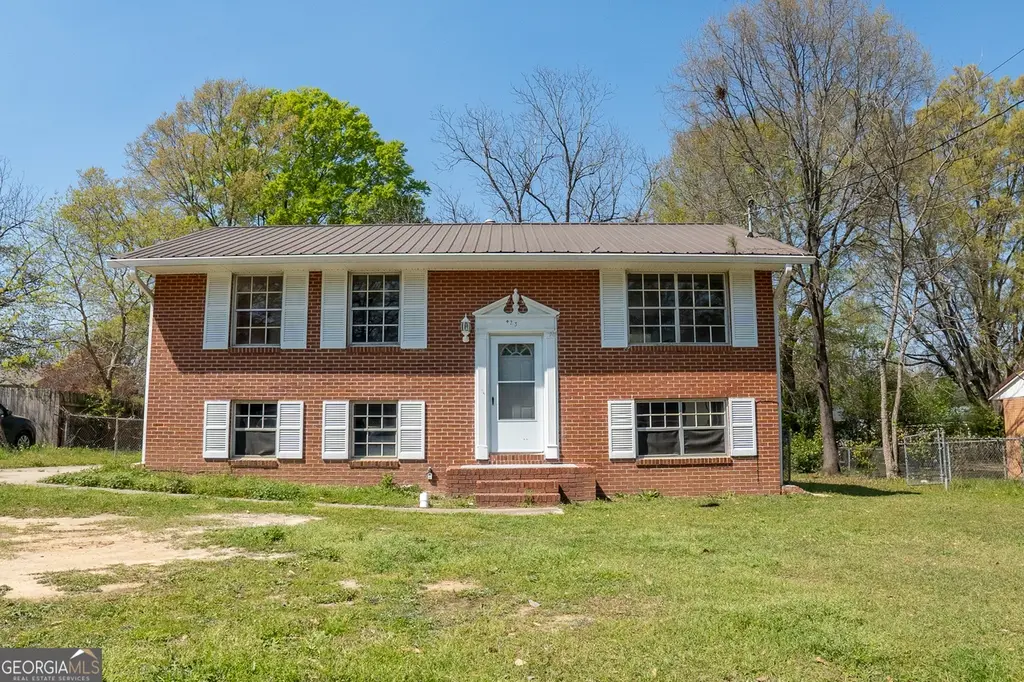
423 Alabama Ave · Warner Robins, GA
Flood risk 1/10 · Minimal
- FEMA flood zone
- X (unshaded)
- Chance of flooding over 30 yrs
- 0.0%
- Est. flood insurance / yr
- $507 – $1,088
Fire risk 1/10 · Minimal
- Est. fire insurance / yr
- $963 – $1,789
Heat risk 7/10 · Major
- Hot days now (above 108°F)
- 7 days/yr
- Hot days in 30 yrs
- 18 days/yr
Wind risk 7/10 · Major
- Chance of severe wind over 30 yrs
- 78.0%
Air-quality risk 3/10 · Minor
- Unhealthy air days now
- 2 days/yr
- Unhealthy air days in 30 yrs
- 4 days/yr
Risk factors via First Street. Map © Google.
Why this score? — see what drove the C- grade
The composite is a weighted blend of 9 inputs, each scored 0–100. Each bar is that input's sub-score; the figure is the points it added to the 100-point composite (weight × sub-score).
- Cash flow +23.0/30.0
- DSCR +7.4/10.0
- 1% rule +5.0/10.0
- Schools +3.9/10.0
- Rent growth +3.2/5.0
- Livability +3.2/5.0
- Condition / age +2.5/5.0
- ARV discount +2.2/15.0
- Appreciation +0.0/10.0
$182,500
🖨 Deal sheet 📄 Offer letter ✓ Due diligence
Listing remarks MLS
This traditional two-story brick home offers 5 bedrooms, 2 baths, and 1,850 sq ft of flexible living space. Featuring two full kitchens, a fenced yard, and a large deck, it's perfect for families or investors looking to convert to a duplex for multi-tenant income. The generous family room downstairs even doubles as the ideal movie or game room. Recent updates include refinished hardwoods, new LVP flooring, a range, water heater, gutters, HVAC, and a low-maintenance metal roof. A 20' x 11' backyard shed adds extra storage or workshop potential. Located just minutes from Robins Air Force Base, this home is a great option for owner-occupants or buyers seeking a smart investment. Previously rented at $1,685/month, the property offers strong income potential, and the seller is even open to owner financing options. Call to schedule a showing today!
Key facts
- Large deck
- Fenced yard
- Refinished hardwoods
Tags
Neighborhood map
What this means for you Summary
Snapshot
- This is a 5-bed/2.0-bath single-family listed at $182k.
Deal economics
- At list price, monthly cash flow is $325 ($4k/yr) — positive.
- The deal already cash-flows at list — no discount required.
- Meets the 1% rule at list price ($2k rent vs $182k).
- Recommended offer: $172k (6.0% below list) — sets the bar for market timing.
- Cap rate 8.4% vs local median 4.9% in Warner Robins — top-decile yield for the area; either an underpriced asset or a hidden risk that comps aren't pricing in. Stress-test before assuming the spread holds.
Location & tenants
- Location reads 65/100 on livability (#227 in GA) — a middle-class / working-renter tenant base. Strengths: cost of living A+, housing A+, health & safety A+; Watch: schools D+, employment D+, crime F.
- Houston County (urban): math 43% / reading 46% proficiency, ranked #23 of 174 in GA (top 13%) — families likely to look elsewhere, expect single-tenant / working-renter base with shorter leases.
- Market conditions: Rents rising (+2.8%/yr); 161 active listings in the ZIP; 1 comparable units currently listed for rent nearby; 1,545 units permitted in Houston County in 2024 (336 in 5+ unit buildings).
- At $1,830/mo this rent would consume 48% of the median local household income ($46k/yr) (locally 1516% of renters already pay >50% of income on rent) — very limited rent-growth headroom before tenants either downsize or default.
Forward outlook
- Local home prices are declining (-3.0%/yr); year-one equity from $1k of loan paydown is wiped out by about $5k of value loss. Plan a longer hold.
- Houston County population projected at +22% by 2050 — long-run rental-demand tailwind backs the buy-and-hold thesis.
Negotiation context
- It's been on market 61 days — a 6% lower offer ($172k) is reasonable based on typical stale-listing flexibility.
- 8 sale attempts since 10y ago with the ask held roughly flat each time — persistent listings suggest the price (not the market) is what's stuck; bring a comps-based counter.
- Current owner paid $60k; list at $182k implies a 204% gain — meaningful room to come down on a strong offer.
Risks & watch-outs
- Climate carrying-cost: major wind risk, 78% chance of damaging wind over 30y; extreme-heat days projected 7→18/yr by 2055 (HVAC capex compounding) — expect insurance premiums to compound above CPI over the hold.
Questions for the listing agent
- It's been on market 61 days. Have you received any prior offers? Is the seller open to a 6% concession, seller financing, or rate buy-down credit?
- Built in 1966 — when were the roof, HVAC, electrical panel, plumbing, and water heater last replaced?
- Why hasn't it sold? Are there any deal-killer items the seller is aware of (foundation, flood, title, zoning, code violations)?
- Is there a deadline driving the sale (1031 exchange, divorce, estate, relocation)? That informs how much negotiation room exists.
- Schools are D-rated, which usually means shorter tenancies and higher turnover. Who's the typical renter profile here, and what's been the actual vacancy rate?
- Crime grade is F in this area — have there been break-ins, vandalism, or insurance claims at this property in the last 3 years? What carrier currently insures it and at what premium?
- What's the average days-on-market for RENTAL listings here right now (not sales)? A rising rental-DOM trend means longer vacancies and softer asking-rent achievability than the comps imply.
- What's the recent tenant-quality profile in this submarket — average credit score on applications, eviction rate, late-payment / NSF rate, and stable-employment percentage? A property-management company in the area should have these aggregated.
- How much new for-sale + rental construction is in the pipeline within 1–3 miles? Heavy new supply typically softens prices + rents 12–24 months out; constrained supply supports both.
Investment metrics
- 1% rule
- 1.00% ✓
- Cap rate
- 8.43%
- Cash-on-cash
- 7.64%
- DSCR
- 1.34
- GRM
- 8.3
CMA / ARV
- ARV (median comp)
- $163,159
- List price
- $182,500
- Delta
- 11.85%
- Verdict
- OVERPRICED
- Comps
- 20 within 1.0 mi
Show comp detail 5 sales within ~0.75 mi
| Address | Dist | Beds/Ba | Sqft | Sold | Price | $/sf | Match |
|---|---|---|---|---|---|---|---|
| 106 Edna Pl | 0.36mi | 4/3.0 (-1) | 1,922 (+4%) | 2mo | $215,000 | $112 | 66 |
| 311 Orchard Lane Ln | 0.66mi | 4/2.0 (-1) | 1,834 (-1%) | 5mo | $80,000 | $44 | 59 |
| 122 Jay Dr | 0.45mi | 4/2.0 (-1) | 1,692 (-8%) | 2mo | $107,000 | $63 | 58 |
| 111 Wisconsin Ave | 0.42mi | 4/3.0 (-1) | 1,680 (-9%) | 2mo | $200,000 | $119 | 55 |
| 212 Wisconsin Ave | 0.36mi | 4/3.0 (-1) | 1,700 (-8%) | 18mo | $209,000 | $123 | 46 |
Match score weights: distance 35% · size 25% · config 20% · recency 20%. Top-matched comps best support the ARV.
Projected returns pro-forma
-3.0% appreciation · 2.78% rent growth · sell at horizon
- IRR
- -4.9%
- Equity multiple
- 0.82×
- Total profit
- $-9,309
- Equity at exit
- $27,211
- IRR
- 4.5%
- Equity multiple
- 1.33×
- Total profit
- $16,692
- Equity at exit
- $15,779
Cash invested: $51,100 (down + closing). Projections, not guarantees.
Landlord ↔ Tenant lean methodology
- Overall (STATE)
- 90 Strongly Landlord-Friendly
- State Georgia
- 90 Strongly Landlord-Friendly · R+3
- County
- — inherits STATE
- City
- — inherits STATE
ZIP-level market 31093
- Rents YoY
- 2.8%
- Active inventory
- 161
- Price-to-rent
- 8.3×
Monthly cashflow live
- Estimated rent
- $1,830 medium interval (Pro) →
- Mortgage (P&I)
- −$957
- Tax from tax record
- −$87 /mo · $1,048/yr
- Insurance
- −$76
- HOA
- −$0
- Vacancy / Maint / Mgmt
- −$384
- Net cashflow
- $325
Break-even live
UW: 25.0% down · 7.5% · 30yr · 1.5% tax · 5.0% vac · 8.0% maint · 8.0% mgmt
Financing live
Cash to close
- Down payment
- $45,625
- Closing costs
- $5,475
- Reserves months
- —
- Total cash needed
- —
Loan-product check · same deal, 3 products live
Conventional
25% down · 7.5% · 30yr
- Down + closing
- —
- Monthly P&I
- —
- Monthly cashflow
- —
- DSCR
- —
- Eligible?
- —
Personal DTI + credit; lowest rate.
DSCR
20% down · 8.5% · 30yr
- Down + closing
- —
- Monthly P&I
- —
- Monthly cashflow
- —
- DSCR
- —
- Eligible?
- —
No personal income docs; deal must DSCR.
Hard money
10% down · 12.0% · 12mo
- Down + closing
- —
- Monthly P&I
- —
- Monthly cashflow
- —
- DSCR
- —
- Eligible?
- —
Short-term bridge; refi at stabilization.
Rent comps 1 comps
| Address | Beds | Baths | Sqft | Rent | $/sqft | DOM | Units | Dist |
|---|---|---|---|---|---|---|---|---|
| 106 Edna Pl Warner Robins, GA | 4.0 | 3.0 | 1922 | $1,850 | $0.96 | 44d | 1 | 0.38mi |
Listing history 21 events
-
2026-03-26$182,500 New 854-char remark
Show marketing remark (854 chars)
This traditional two-story brick home offers 5 bedrooms, 2 baths, and 1,850 sq ft of flexible living space. Featuring two full kitchens, a fenced yard, and a large deck, it's perfect for families or investors looking to convert to a duplex for multi-tenant income. The generous family room downstairs even doubles as the ideal movie or game room. Recent updates include refinished hardwoods, new LVP flooring, a range, water heater, gutters, HVAC, and a low-maintenance metal roof. A 20' x 11' backyard shed adds extra storage or workshop potential. Located just minutes from Robins Air Force Base, this home is a great option for owner-occupants or buyers seeking a smart investment. Previously rented at $1,685/month, the property offers strong income potential, and the seller is even open to owner financing options. Call to schedule a showing today!
-
2026-03-25$182,500 Active 854-char remark
Show marketing remark (854 chars)
This traditional two-story brick home offers 5 bedrooms, 2 baths, and 1,850 sq ft of flexible living space. Featuring two full kitchens, a fenced yard, and a large deck, it's perfect for families or investors looking to convert to a duplex for multi-tenant income. The generous family room downstairs even doubles as the ideal movie or game room. Recent updates include refinished hardwoods, new LVP flooring, a range, water heater, gutters, HVAC, and a low-maintenance metal roof. A 20' x 11' backyard shed adds extra storage or workshop potential. Located just minutes from Robins Air Force Base, this home is a great option for owner-occupants or buyers seeking a smart investment. Previously rented at $1,685/month, the property offers strong income potential, and the seller is even open to owner financing options. Call to schedule a showing today!
-
2025-07-09historical
-
2025-07-08status Back On Market
-
2025-07-07historical Active Under Contract
-
2025-05-14$183,500 New
-
2023-10-18price $195,000
-
2023-08-19price $198,000
-
2023-05-30historical
-
2023-03-24$199,000 New
-
2023-02-24historical
-
2023-02-14price $189,900
-
2023-02-14price $189,900
-
2023-01-30$199,000 New
-
2022-08-29historical
-
2022-08-24price $179,000
-
2022-08-04price $172,500
-
2022-06-14$179,000 New
-
2017-06-16soldstatus $60,000
-
2017-06-09soldstatus $60,000
-
2016-11-14$70,000
ⓘ Source: listings_history table (triggers on properties + properties_extension) + one-shot
backfill from property_details.listing_events for pre-trigger history.
Tax reassessment forecast GA · Resets to sale price
- Current annual tax
- $1,048 · $87/mo
- Projected year-2 tax
- $1,679 · $140/mo
- Expected delta
- +$631/yr (+$53/mo · 60.2%)
ⓘ Screening estimate from a state-policy table — verify with the county assessor before closing.
Climate risk First Street
- Flood 1/10 Low FEMA zone X (unshaded) · 0% chance over 30 yrs
- Wildfire 1/10 Low
- Heat 7/10 Severe 7 d/yr ≥108°F today · 18 d/yr by 30 yrs out
- Wind 7/10 Severe 78% chance of damaging wind over 30 yrs
- Air quality 3/10 Moderate 2 unhealthy d/yr today · 4 by 30 yrs out
Nearby sold comps map
Loading sold comps map…
Walkable amenities ~0.75 mi
Loading nearby amenities…
Taxation est. · year 1
- Rental income
- $21,962
- − Mortgage interest
- −$10,223
- − Property taxes
- −$1,048
- − Insurance
- −$912
- − Repairs & maintenance
- −$1,757
- − Management
- −$1,757
- − Depreciation
- −$5,309
- Taxable income
- $956
- Est. tax owed @ 24.0%
- −$229
- After-tax cash flow
- $3,676/yr
For passive investors: Depreciation is non-cash, so a rental often shows a tax loss while cash-flowing — sheltering income. Rental losses are passive: they offset passive income freely, and up to $25,000/yr can offset ordinary (W-2) income if you actively participate and your MAGI is under $100k (phasing out to $0 by $150k); unused losses carry forward. On sale, claimed depreciation is recaptured at up to 25%, and gains may owe capital-gains tax (a 1031 exchange can defer both). Figures are a year-1 estimate at your 24.0% rate — not tax advice; consult a CPA.
Schools (NCES district)
- District
- Houston County
- NCES district ID
- 1302880
- Math proficiency
- 43% ▼ -7.00%
- Reading proficiency
- 46% ▼ -2.00%
- Median HH income
- $54,823
- Composite
- 38.68/100
- National rank
- #4144
- State rank
- #23 of 174 in GA
Livability — Warner Robins
- Score
- 65/100
- State rank
- #227
- US rank
- #13290
Category grades
Schools grade is shown separately in the Schools card above.
Census & demographics
- Census place
- Warner Robins, GA
- County
- Houston County · 157,321 people
- City population
- 92,102
- Metro
- Warner Robins, GA
- Population (ZIP)
- 26,872
- Household income
- $45,991
- Rent vs Own
- Severe rent burden
- 1516.0
Population outlook (Houston County) Hauer SSP2
- Today (2025)
- 169,502 people
- By 2030
- 178,486 · +5.3%
- By 2040
- 194,642 · +14.8%
- By 2050
- 207,119 · +22.2%
- By 2075
- 231,480 · +36.6%
- By 2100
- 235,034 · +38.7%
Race, ethnicity, and origin ACS 2023
- Neighborhood character
- Diverse neighborhood (Simpson 0.64)
- Race & ethnicity
- Black 47% White 35% Hispanic / Latino 10% Two or more races 7% Asian 1%
- Hispanic origin (detail)
- Mexican 5%
- Common ancestry
- Iranian 1% Serbian 1% Italian 1%
- Foreign-born
- 6% · Canada, Vietnam, South Korea
- Languages at home
- 91% English-only · Spanish 8%
Political lean MEDSL · Houston
- 2024 margin
- R (+11.3) · D 44.0% · R 55.3%
- 2008→2024 swing
- +8.9pp toward D · 2008: -20.2pp · 2024: -11.3pp
- All cycles
- 2024: R+11.3 2020: R+12.4 2016: R+21.6 2012: R+20.7 2008: R+20.2
Not yet ingested
- Civics
- —
Market trends
- HPI YoY
- ▼ -130.35%
- Current HPI
- 222.1627
- Rent YoY
- ▲ 2.78%
- Metro
- Warner Robins, GA
- State GDP YoY
- ▲ 2.66%
- F500 in state
- 28
Industry mix (Fortune 500 HQ in GA)
| Industry | F500 HQs | Revenue |
|---|---|---|
| Paper / Packaging | 2 | $29B |
|
||
| Retail | 1 | $160B |
|
||
| Transportation / Logistics | 1 | $91B |
|
||
| Airlines | 1 | $62B |
|
||
| Consumer Goods | 1 | $47B |
|
||
| Utilities | 1 | $25B |
|
||
Price history
+160.7% since first listed21 events — show timeline
- 2026-03-26 Listed $182,500 GAMLS
- 2026-03-25 Listed $182,500 MGMLS
- 2025-07-09 Listing Removed — GAMLS
- 2025-07-08 Relisted — GAMLS
- 2025-07-07 Contingent — GAMLS
- 2025-05-14 Listed $183,500 GAMLS
- 2023-10-18 Price Changed $195,000 CGMLS
- 2023-08-19 Price Changed $198,000 CGMLS
- 2023-05-30 Listing Removed — GAMLS
- 2023-03-24 Listed $199,000 GAMLS
- 2023-02-24 Listing Removed — GAMLS
- 2023-02-14 Price Changed $189,900 CGMLS
- 2023-02-14 Price Changed $189,900 GAMLS
- 2023-01-30 Listed $199,000 GAMLS
- 2022-08-29 Listing Removed — GAMLS
- 2022-08-24 Price Changed $179,000 GAMLS
- 2022-08-04 Price Changed $172,500 GAMLS
- 2022-06-14 Listed $179,000 GAMLS
- 2017-06-16 Sold (Public Records) $60,000 Public Records
- 2017-06-09 Sold (MLS) $60,000 MGMLS
- 2016-11-14 Listed $70,000 MGMLS
Property tax history
+5.2%/yrLatest (2025): $1,048 · +6.8% YoY. Source: county tax records.
Cash-flow waterfall
monthlySold comps — $/sqft
last 12 mo · ≤1 miLoading sold comps…