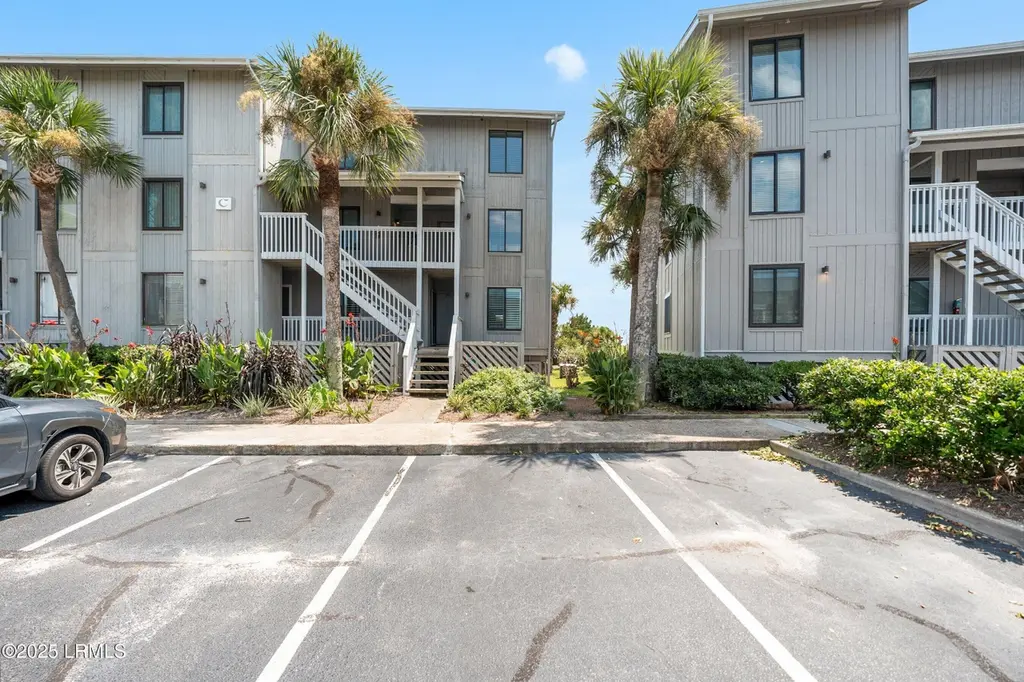
6 Cedar Reef Dr Unit C201-B · Harbor Island, SC
Flood risk 10/10 · Severe
- FEMA flood zone
- AE
- Chance of flooding over 30 yrs
- 0.99%
- Est. flood insurance / yr
- $1,737 – $8,500
Fire risk 3/10 · Minor
- Est. fire insurance / yr
- $783 – $1,453
Heat risk 10/10 · Severe
- Hot days now (above 105°F)
- 7 days/yr
- Hot days in 30 yrs
- 22 days/yr
Wind risk 9/10 · Severe
- Chance of severe wind over 30 yrs
- 99.0%
Air-quality risk 2/10 · Minimal
- Unhealthy air days now
- 1 days/yr
- Unhealthy air days in 30 yrs
- 1 days/yr
Risk factors via First Street. Map © Google.
Why this score? — see what drove the D+ grade
The composite is a weighted blend of 9 inputs, each scored 0–100. Each bar is that input's sub-score; the figure is the points it added to the 100-point composite (weight × sub-score).
- Cash flow +15.0/30.0
- ARV discount +7.5/15.0
- 1% rule +5.0/10.0
- DSCR +5.0/10.0
- Schools +4.1/10.0
- Condition / age +4.0/5.0
- Rent growth +2.5/5.0
- Livability +2.5/5.0
- Appreciation +0.0/10.0
$45,000
🖨 Deal sheet (PDF) 📄 Offer letter ✓ Due diligence
Listing remarks
Amazing ocean-marsh views on this beautiful 2 bedroom, 2.5 bath condo. This villa is managed privately by the owners and there is a weekly rotation plan in place. You have access to the condo one week every eight weeks. If you are looking for a budgeted, friendly vacation and don't want sole ownership, then this is what you are looking for.
Key facts
- $150 HOA
- Community pool
- Built 1981
Property features AI
Finance
- HOA & community: HOA fee charged annually; HOA fee amount: $1,796.69 per year; Community amenities include fitness center, dog park, pool, playground
Exterior
- Parking: No attached garage
- Security: Gated community security
- Home design: Condominium; Shared interest ownership (18% share)
- Construction: Building area about 1,080
- Exterior features: Residential zoning
Interior
- Kitchen: Dishwasher; Disposal; Microwave; Refrigerator
- Bathrooms: 2 full bathrooms; 1 half bathroom (3 total)
- Interior features: Ceiling fans
- Laundry & utility: Washer; Dryer; Washer and dryer included
Neighborhood map
What this means for you Summary
Snapshot
- This is a 2-bed/2.5-bath condo listed at $45k. Condition is rated good.
Deal economics
- At list price, monthly cash flow is $842 ($10k/yr) — positive.
- The deal already cash-flows at list — no discount required.
- Meets the 1% rule at list price ($2k rent vs $45k).
- Cap rate 40.1% vs local median 1.0% in Harbor Island — top-decile yield for the area; either an underpriced asset or a hidden risk that comps aren't pricing in. Stress-test before assuming the spread holds.
Location & tenants
- Location reads: area grade D — affects rentability + tenant quality, not the cash-flow math above.
- Beaufort 01 (town): math 42% / reading 51% proficiency, ranked #17 of 80 in SC (top 21%) — families likely to look elsewhere, expect single-tenant / working-renter base with shorter leases.
- Zoned schools: St. Helena Elementary (math 17% / reading 22%, grade F, #499 of 597 statewide, top 84%, 347 students, 100% FRL) — zoned schools average 100% FRL vs 48% district-wide (52 pts higher); higher-poverty schools than district average — tighter screening recommended.
- Zoned-school proficiency averages 20% at this address vs 46% district-wide (-27 pts) — the specific schools serving this property underperform the Beaufort 01 average; the district grade overstates school quality for this exact location.
- Market conditions: 328 active listings in the ZIP; 1,824 units permitted in Beaufort County in 2024 (618 in 5+ unit buildings).
Forward outlook
- Local home prices are declining (-3.0%/yr); year-one equity from $311 of loan paydown is wiped out by about $1k of value loss. Plan a longer hold.
- Beaufort County population projected at +30% by 2050 — long-run rental-demand tailwind backs the buy-and-hold thesis.
- At projected returns (-3.0% appreciation + 3.0% rent growth), your $13k cash investment doubles in ~2 years — after that, you're playing with house money.
Negotiation context
- Only 5 days on market — expect competitive offers; lowballing is unlikely to land.
Risks & watch-outs
- Watch-outs: flood insurance adds $427/mo.
- Climate carrying-cost: in FEMA flood zone AE (mandatory federal flood insurance); severe wind risk, 99% chance of damaging wind over 30y; extreme-heat days projected 7→22/yr by 2055 (HVAC capex compounding) — expect insurance premiums to compound above CPI over the hold.
Questions for the listing agent
- What's the actual annual flood-insurance premium (NFIP or private), and is the property in a SFHA with mandatory coverage?
- What does the HOA fee cover, when was the last increase, and are there any pending special assessments or reserve-fund shortfalls?
- Any open or pending special assessments — roof, HVAC, plumbing, elevator, façade? What's the per-unit balance and payoff schedule, and is the seller paying it off at close or rolling it to the buyer?
- Is there a deadline driving the sale (1031 exchange, divorce, estate, relocation)? That informs how much negotiation room exists.
- The area grade is low — what's the realistic commute time and amenity access for the typical tenant pool here? Any planned neighborhood developments (good or bad) we should know about?
- What's the average days-on-market for RENTAL listings here right now (not sales)? A rising rental-DOM trend means longer vacancies and softer asking-rent achievability than the comps imply.
- What's the recent tenant-quality profile in this submarket — average credit score on applications, eviction rate, late-payment / NSF rate, and stable-employment percentage? A property-management company in the area should have these aggregated.
- How much new apartment / multifamily construction is in the pipeline within 1–3 miles? Heavy new supply (>2% of stock underway) typically softens rents 12–24 months out; light construction supports rent growth.
Investment metrics
- 1% rule
- 4.86% ✓
- Cap rate
- 40.11%
- Cash-on-cash
- 120.78%
- DSCR
- 6.37
- GRM
- 1.7
CMA / ARV
No comps found within radius.
Projected returns pro-forma
-3.0% appreciation · 3.0% rent growth · sell at horizon
- IRR
- 80.6%
- Equity multiple
- 4.71×
- Total profit
- $46,703
- Equity at exit
- $6,710
- IRR
- 84.1%
- Equity multiple
- 9.83×
- Total profit
- $111,269
- Equity at exit
- $3,891
Cash invested: $12,600 (down + closing). Projections, not guarantees.
Landlord ↔ Tenant lean methodology
- Overall (STATE)
- 90 Strongly Landlord-Friendly
- State South Carolina
- 90 Strongly Landlord-Friendly · R+6
- County
- — inherits STATE
- City
- — inherits STATE
ZIP-level market 29920
- Home prices YoY
- -14.5%
- Active inventory
- 328
- Price-to-rent
- 1.7×
Monthly cashflow live
- Estimated rent
- $2,189 medium interval (Pro) →
- Mortgage (P&I)
- −$236
- Tax est. 1.5%
- −$56 /mo · $675/yr
- Insurance
- −$19
- Flood insurance flood zone
- −$427 /mo · $5,118/yr
- HOA
- −$150
- Vacancy / Maint / Mgmt
- −$460
- Net cashflow
- $842
Break-even live
Sensitivity live
| Price | -10% $873 | -5% $857 | +0% $842 | +5% $826 | +10% $811 |
|---|---|---|---|---|---|
| Rent | -10% $669 | -5% $755 | +0% $842 | +5% $928 | +10% $1,015 |
| Rate | -1.0pp $864 | -0.5pp $853 | base $842 | +0.5pp $830 | +1.0pp $818 |
UW: 25.0% down · 7.5% · 30yr · 1.5% tax · 5.0% vac · 8.0% maint · 8.0% mgmt
Financing live
Cash to close
- Down payment
- $11,250
- Closing costs
- $1,350
- Reserves months
- —
- Total cash needed
- —
Loan-product check · same deal, 3 products live
Conventional
25% down · 7.5% · 30yr
- Down + closing
- —
- Monthly P&I
- —
- Monthly cashflow
- —
- DSCR
- —
- Eligible?
- —
Personal DTI + credit; lowest rate.
DSCR
20% down · 8.5% · 30yr
- Down + closing
- —
- Monthly P&I
- —
- Monthly cashflow
- —
- DSCR
- —
- Eligible?
- —
No personal income docs; deal must DSCR.
Hard money
10% down · 12.0% · 12mo
- Down + closing
- —
- Monthly P&I
- —
- Monthly cashflow
- —
- DSCR
- —
- Eligible?
- —
Short-term bridge; refi at stabilization.
HOA detail condo
- Monthly dues
- $150 · $1,800/yr
- Assessments
- None detected in remarks — confirm with the listing agent.
Listing history 5 events
-
2026-06-09status $45,000 Pending 5 DOM
-
2026-06-08days on market $45,000 Active 5 DOM
-
2026-06-07days on market $45,000 Active 4 DOM
-
2026-06-05remarks 342-char remark
-
2026-06-05$45,000 Active 1 DOM
ⓘ Source: listings_history table (triggers on properties + properties_extension) + one-shot
backfill from property_details.listing_events for pre-trigger history.
Climate risk First Street
- Flood 10/10 Extreme FEMA zone AE · 99% chance over 30 yrs
- Wildfire 3/10 Moderate
- Heat 10/10 Extreme 7 d/yr ≥105°F today · 22 d/yr by 30 yrs out
- Wind 9/10 Extreme 99% chance of damaging wind over 30 yrs
- Air quality 2/10 Low 1 unhealthy d/yr today · 1 by 30 yrs out
Nearby sold comps map
Loading sold comps map…
Walkable amenities ~0.75 mi
Loading nearby amenities…
Taxation est. · year 1
- Rental income
- $26,266
- − Mortgage interest
- −$2,521
- − Property taxes
- −$675
- − Insurance
- −$5,344
- − Repairs & maintenance
- −$2,101
- − Management
- −$2,101
- − HOA
- −$1,800
- − Depreciation
- −$1,309
- Taxable income
- $10,416
- Est. tax owed @ 24.0%
- −$2,500
- After-tax cash flow
- $7,600/yr
For passive investors: Depreciation is non-cash, so a rental often shows a tax loss while cash-flowing — sheltering income. Rental losses are passive: they offset passive income freely, and up to $25,000/yr can offset ordinary (W-2) income if you actively participate and your MAGI is under $100k (phasing out to $0 by $150k); unused losses carry forward. On sale, claimed depreciation is recaptured at up to 25%, and gains may owe capital-gains tax (a 1031 exchange can defer both). Figures are a year-1 estimate at your 24.0% rate — not tax advice; consult a CPA.
Condition & rehab AI · 6 photos
This 2-bedroom, 2.5-bath condo is in good condition with no visible major repairs needed. It has a good exterior and interior condition, and the landscaping adds to its curb appeal. The property is move-in ready and has a good rental potential.
Value-add opportunities
- Both Paint the exterior siding — Painting the exterior siding can improve the curb appeal and add value to the property.
- Both Inspect and clean the air conditioning unit — Maintaining the HVAC system can improve the comfort and energy efficiency of the property, which can increase its value.
- Both Upgrade the flooring — Upgrading the flooring can improve the aesthetic appeal and add value to the property.
- Both Paint the interior walls and ceilings — Painting the interior walls and ceilings can improve the aesthetic appeal and add value to the property.
- Both Replace the light fixtures — Replacing outdated light fixtures can improve the aesthetic appeal and add value to the property.
- Both Replace the hardware — Replacing outdated hardware can improve the aesthetic appeal and add value to the property.
- Both Upgrade the kitchen appliances — Upgrading the kitchen appliances can improve the aesthetic appeal and add value to the property.
- Both Upgrade the bathrooms — Upgrading the bathrooms can improve the aesthetic appeal and add value to the property.
- Both Upgrade the HVAC system — Upgrading the HVAC system can improve the comfort and energy efficiency of the property, which can increase its value.
- Both Landscaping improvements — Landscaping improvements can improve the curb appeal and add value to the property.
Renovation cost estimate screening
Value-add ROI direction
- Both Paint the exterior siding — Painting the exterior siding can improve the curb appeal and add value to the property. ↑
- Both Inspect and clean the air conditioning unit — Maintaining the HVAC system can improve the comfort and energy efficiency of the property, which can increase its value. ↑
- Both Upgrade the flooring — Upgrading the flooring can improve the aesthetic appeal and add value to the property. ↑
- Both Paint the interior walls and ceilings — Painting the interior walls and ceilings can improve the aesthetic appeal and add value to the property. ↑
- Both Replace the light fixtures — Replacing outdated light fixtures can improve the aesthetic appeal and add value to the property. ↑
- Both Replace the hardware — Replacing outdated hardware can improve the aesthetic appeal and add value to the property. ↑
- Both Upgrade the kitchen appliances — Upgrading the kitchen appliances can improve the aesthetic appeal and add value to the property. ↑
- Both Upgrade the bathrooms — Upgrading the bathrooms can improve the aesthetic appeal and add value to the property. ↑
- Both Upgrade the HVAC system — Upgrading the HVAC system can improve the comfort and energy efficiency of the property, which can increase its value. ↑
- Both Landscaping improvements — Landscaping improvements can improve the curb appeal and add value to the property. ↑
ⓘ Cost ranges are severity-bucket heuristics (US national rule-of-thumb). Get contractor quotes + a written scope before underwriting a rehab budget.
Schools (NCES district)
- District
- Beaufort 01
- NCES district ID
- 4501110
- Math proficiency
- 42% ▼ -8.00%
- Reading proficiency
- 51% ▲ 2.00%
- Median HH income
- $57,430
- Composite
- 40.56/100
- National rank
- #3699
- State rank
- #17 of 80 in SC
Livability — Harbor Island
No livability data for this city. (Only ~50 U.S. cities are tracked.)
Census & demographics
- Census place
- Harbor Island, SC
- Population (ZIP)
- 9,918
Population outlook (Beaufort County) Hauer SSP2
- Today (2025)
- 211,915 people
- By 2030
- 227,272 · +7.2%
- By 2040
- 253,861 · +19.8%
- By 2050
- 275,126 · +29.8%
- By 2075
- 311,022 · +46.8%
- By 2100
- 321,286 · +51.6%
Race, ethnicity, and origin ACS 2023
- Neighborhood character
- Diverse neighborhood (Simpson 0.60)
- Race & ethnicity
- Black 48% White 41% Hispanic / Latino 7% Two or more races 6%
- Hispanic origin (detail)
- Mexican 5%
- Common ancestry
- Slovak 2% Serbian 2% Romanian 1%
- Foreign-born
- 6% · Canada
- Languages at home
- 93% English-only · Spanish 5%
Political lean MEDSL · Beaufort
- 2024 margin
- R (+14.5) · D 42.1% · R 56.6% · Other 1.2%
- 2008→2024 swing
- -3.7pp toward R · 2008: -10.8pp · 2024: -14.5pp
- All cycles
- 2024: R+14.5 2020: R+10.0 2016: R+14.3 2012: R+17.5 2008: R+10.8
Not yet ingested
- Civics
- —
Market trends
- HPI YoY
- ▼ -48.29%
- Current HPI
- 284.2064
- Rent YoY
- —
- Metro
- —
- State GDP YoY
- ▲ 4.51%
- F500 in state
- 2
Industry mix (Fortune 500 HQ in SC)
| Industry | F500 HQs | Revenue |
|---|---|---|
| Packaging | 1 | $7B |
|
||
Price history
1 event — show timeline
- 2026-06-03 Listed $45,000 LRMLS
Cash-flow waterfall
monthlySold comps — $/sqft
last 12 mo · ≤1 miLoading sold comps…