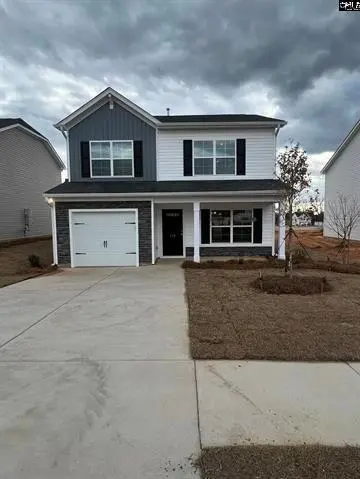
607 Marbled Teal Ln · Columbia, SC
Flood risk 1/10 · Minimal
- FEMA flood zone
- X (unshaded)
- Chance of flooding over 30 yrs
- 0.0%
- Est. flood insurance / yr
- $507 – $1,088
Fire risk 4/10 · Minor
- Est. fire insurance / yr
- $783 – $1,453
Heat risk 6/10 · Moderate
- Hot days now (above 107°F)
- 7 days/yr
- Hot days in 30 yrs
- 15 days/yr
Wind risk 6/10 · Moderate
- Chance of severe wind over 30 yrs
- 67.0%
Air-quality risk 3/10 · Minor
- Unhealthy air days now
- 2 days/yr
- Unhealthy air days in 30 yrs
- 2 days/yr
Risk factors via First Street. Map © Google.
Why this score? — see what drove the D grade
The composite is a weighted blend of 9 inputs, each scored 0–100. Each bar is that input's sub-score; the figure is the points it added to the 100-point composite (weight × sub-score).
- Cash flow +13.1/30.0
- ARV discount +12.4/15.0
- DSCR +3.9/10.0
- Livability +3.9/5.0
- 1% rule +3.8/10.0
- Schools +2.6/10.0
- Rent growth +2.5/5.0
- Condition / age +2.5/5.0
- Appreciation +0.0/10.0
$219,000
🖨 Deal sheet (PDF) 📄 Offer letter ✓ Due diligence
Listing remarks
Move in ready!!! The Poplar floor plan provides 1404 square feet and a single car garage. The first floor presents the open concept that creates an inviting, connected space for the kitchen, dining area, and living room. A powder room blends the extra convenience you'd expect in a 2-story home. The 3 bedrooms—including the master bedroom—are located upstairs for the privacy many homeowners want. The laundry room is also on the 2nd floor. The master bath has a large walk-in closet and double vanity. Use address 600 Marbled Teal Land Hopkins SC 29061 for GPS mapping
Key facts
- 6,969 sq ft lot
- Garage
- Built 2023
Neighborhood map
What this means for you Summary
Snapshot
- This is a 3-bed/2.5-bath single-family listed at $219k.
Deal economics
- At list price, monthly cash flow is $-9 ($-113/yr) — negative.
- To cash-flow at today's rent, offer at most $218k (0.6% below list).
- To meet the 1% rule (rent ≥ 1% of price), the offer needs to be $193k (11.9% below list).
- Recommended offer: $193k (11.9% below list) — sets the bar for 1% rule.
- Cap rate 6.2% vs local median 5.1% in Columbia — meaningfully above typical; check what's discounted (condition, days-on-market, listing class) to confirm the premium yield is real.
Location & tenants
- Location reads 78/100 on livability (#18 in SC, #2,436 nationally) — a middle-class / working-renter tenant base. Strengths: amenities A+, commute A+, cost of living A+; Watch: employment D, crime F.
- Richland 01 (urban): math 26% / reading 36% proficiency, ranked #54 of 80 in SC (top 68%) — families likely to look elsewhere, expect single-tenant / working-renter base with shorter leases; 64% free/reduced lunch — lower-income household profile, screen leases tightly.
- Zoned schools: Caughman Road Elementary (math 22% / reading 27%, grade F, #452 of 597 statewide, top 78%, 707 students, 100% FRL); Hopkins Middle (math 8% / reading 17%, grade F, #213 of 229 statewide, top 94%, 493 students, 100% FRL); Lower Richland High (math 5% / reading 64%, grade F, #185 of 196 statewide, top 94%, 1,244 students, 100% FRL) — zoned schools average 100% FRL vs 64% district-wide (36 pts higher); higher-poverty schools than district average — tighter screening recommended.
- Market conditions: 335 active listings in the ZIP; 11 comparable units currently listed for rent nearby; rentals at typical pace (median 21d on market — plan ~3-4 weeks tenant-placement turnaround); 3,472 units permitted in Richland County in 2024 (1,096 in 5+ unit buildings).
- This rent runs 38% of the median local income ($60k/yr) — at the standard rent-burdened threshold; future hikes will face affordability resistance.
Forward outlook
- Local home prices are declining (-3.0%/yr); year-one equity from $2k of loan paydown is wiped out by about $7k of value loss. Plan a longer hold.
- Richland County population projected at +30% by 2050 — long-run rental-demand tailwind backs the buy-and-hold thesis.
Negotiation context
- Only 2 days on market — expect competitive offers; lowballing is unlikely to land.
- 9 sale attempts since 3y ago; this cycle's ask is 11738% above the opening price — seller raised mid-cycle; expect resistance to lowballs.
Risks & watch-outs
- Climate carrying-cost: major wind risk, 67% chance of damaging wind over 30y; extreme-heat days projected 7→15/yr by 2055 (HVAC capex compounding) — expect insurance premiums to compound above CPI over the hold.
Questions for the listing agent
- What do current leases actually rent for vs. the listed asking? Can we see a recent rent roll and the last 12 months of T-12 income?
- What does the HOA fee cover, when was the last increase, and are there any pending special assessments or reserve-fund shortfalls?
- Is there a deadline driving the sale (1031 exchange, divorce, estate, relocation)? That informs how much negotiation room exists.
- Schools are D-rated, which usually means shorter tenancies and higher turnover. Who's the typical renter profile here, and what's been the actual vacancy rate?
- Crime grade is F in this area — have there been break-ins, vandalism, or insurance claims at this property in the last 3 years? What carrier currently insures it and at what premium?
- The area grade is low — what's the realistic commute time and amenity access for the typical tenant pool here? Any planned neighborhood developments (good or bad) we should know about?
- What's the average days-on-market for RENTAL listings here right now (not sales)? A rising rental-DOM trend means longer vacancies and softer asking-rent achievability than the comps imply.
- What's the recent tenant-quality profile in this submarket — average credit score on applications, eviction rate, late-payment / NSF rate, and stable-employment percentage? A property-management company in the area should have these aggregated.
- How much new for-sale + rental construction is in the pipeline within 1–3 miles? Heavy new supply typically softens prices + rents 12–24 months out; constrained supply supports both.
Investment metrics
- 1% rule
- 0.88% ✗
- Cap rate
- 6.24%
- Cash-on-cash
- -0.18%
- DSCR
- 0.99
- GRM
- 9.5
CMA / ARV
- ARV (on-the-fly)
- $245,700
- Comps found
- 1
Show comp detail 1 sale within ~0.75 mi
| Address | Dist | Beds/Ba | Sqft | Sold | Price | $/sf | Match |
|---|---|---|---|---|---|---|---|
| 250 Saskatoon Dr | 0.29mi | 3/2.5 | 1,307 (-7%) | 22mo | $228,530 | $175 | 57 |
Match score weights: distance 35% · size 25% · config 20% · recency 20%. Top-matched comps best support the ARV.
Projected returns pro-forma
-3.0% appreciation · 3.0% rent growth · sell at horizon
- IRR
- -16.6%
- Equity multiple
- 0.41×
- Total profit
- $-36,046
- Equity at exit
- $32,654
- IRR
- -8.3%
- Equity multiple
- 0.48×
- Total profit
- $-31,991
- Equity at exit
- $18,935
Cash invested: $61,320 (down + closing). Projections, not guarantees.
Landlord ↔ Tenant lean methodology
- Overall (STATE)
- 90 Strongly Landlord-Friendly
- State South Carolina
- 90 Strongly Landlord-Friendly · R+6
- County
- — inherits STATE
- City
- — inherits STATE
ZIP-level market 29061
- Home prices YoY
- -22.8%
- Active inventory
- 335
- Price-to-rent
- 9.5×
Monthly cashflow live
- Estimated rent
- $1,930 high interval (Pro) →
- Mortgage (P&I)
- −$1,148
- Tax est. 1.5%
- −$274 /mo · $3,285/yr
- Insurance
- −$91
- HOA
- −$21
- Vacancy / Maint / Mgmt
- −$405
- Net cashflow
- $-9
Break-even live
Sensitivity live
| Price | -10% $142 | -5% $66 | +0% $-9 | +5% $-85 | +10% $-161 |
|---|---|---|---|---|---|
| Rent | -10% $-162 | -5% $-86 | +0% $-9 | +5% $67 | +10% $143 |
| Rate | -1.0pp $101 | -0.5pp $46 | base $-9 | +0.5pp $-66 | +1.0pp $-124 |
UW: 25.0% down · 7.5% · 30yr · 1.5% tax · 5.0% vac · 8.0% maint · 8.0% mgmt
Financing live
Cash to close
- Down payment
- $54,750
- Closing costs
- $6,570
- Reserves months
- —
- Total cash needed
- —
Loan-product check · same deal, 3 products live
Conventional
25% down · 7.5% · 30yr
- Down + closing
- —
- Monthly P&I
- —
- Monthly cashflow
- —
- DSCR
- —
- Eligible?
- —
Personal DTI + credit; lowest rate.
DSCR
20% down · 8.5% · 30yr
- Down + closing
- —
- Monthly P&I
- —
- Monthly cashflow
- —
- DSCR
- —
- Eligible?
- —
No personal income docs; deal must DSCR.
Hard money
10% down · 12.0% · 12mo
- Down + closing
- —
- Monthly P&I
- —
- Monthly cashflow
- —
- DSCR
- —
- Eligible?
- —
Short-term bridge; refi at stabilization.
Rent comps 11 comps
| Address | Beds | Baths | Sqft | Rent | $/sqft | DOM | Units | Dist |
|---|---|---|---|---|---|---|---|---|
| 385 Saskatoon Dr Unit 385 Columbia, SC | 3.0 | 2.0 | 1330 | $2,000 | $1.50 | 25d | 1 | 0.19mi |
| 331 Crooked Pine Ct Columbia, SC | 4.0 | 2.5 | 1775 | $2,133 | $1.20 | 21d | 1 | 0.22mi |
| 302 Crooked Pine Ct Columbia, SC | 3.0 | 2.0 | 1399 | $1,883 | $1.35 | 25d | 1 | 0.38mi |
| 305 Shoreditch Dr Columbia, SC | 3.0 | 1.5 | 1378 | $1,586 | $1.15 | 21d | 1 | 0.47mi |
| 313 Shoreditch Dr Columbia, SC | 3.0 | 1.5 | 1056 | $1,775 | $1.68 | 25d | 1 | 0.49mi |
| 101 Shagbark Ave Columbia, SC | 3.0 | 1.0 | 1000 | $1,295 | $1.29 | 21d | 1 | 0.69mi |
| 429 Mockernut Ln Columbia, SC | 3.0 | 1.0 | 1010 | $1,250 | $1.24 | 25d | 1 | 0.80mi |
| 329 Ovanta Rd Columbia, SC | 3.0 | 1.5 | 1100 | $1,200 | $1.09 | 25d | 1 | 0.92mi |
| 440 Delahays Rd Columbia, SC | 3.0 | 2.5 | 1704 | $1,900 | $1.12 | 16d | 1 | 0.94mi |
| 457 Delahays Rd Columbia, SC | 3.0 | 2.0 | 1704 | $2,000 | $1.17 | 16d | 1 | 0.99mi |
| 4022 Ulmer Rd Columbia, SC | 2.0–3.0 | 1.0–2.0 | 1202 | $1,322 | $1.10 | 21d | 1 | 1.36mi |
HOA detail
- Monthly dues
- $21 · $252/yr
Listing history 18 events
-
2025-05-30historical $1,850
-
2025-05-12$1,850
-
2025-05-03historical $1,850
-
2025-04-01$1,850
-
2025-03-14historical $1,850
-
2025-02-10$1,850
-
2024-01-10status Pending
-
2024-01-09status Pending
-
2024-01-08$219,000 Active
-
2024-01-02historical
-
2024-01-01$219,900 Active
-
2023-12-28$219,900 Active
-
2023-12-20status Active
-
2023-11-19status Pending
-
2023-11-17price $219,900
-
2023-11-17status Active
-
2023-06-19status Pending
-
2023-06-19$217,900 Active
ⓘ Source: listings_history table (triggers on properties + properties_extension) + one-shot
backfill from property_details.listing_events for pre-trigger history.
Climate risk First Street
- Flood 1/10 Low FEMA zone X (unshaded) · 0% chance over 30 yrs
- Wildfire 4/10 Moderate
- Heat 6/10 Major 7 d/yr ≥107°F today · 15 d/yr by 30 yrs out
- Wind 6/10 Major 67% chance of damaging wind over 30 yrs
- Air quality 3/10 Moderate 2 unhealthy d/yr today · 2 by 30 yrs out
Nearby sold comps map
Loading sold comps map…
Walkable amenities ~0.75 mi
Loading nearby amenities…
Taxation est. · year 1
- Rental income
- $23,165
- − Mortgage interest
- −$12,267
- − Property taxes
- −$3,285
- − Insurance
- −$1,095
- − Repairs & maintenance
- −$1,853
- − Management
- −$1,853
- − HOA
- −$252
- − Depreciation
- −$6,371
- Taxable loss
- −$3,812
- Est. tax savings @ 24.0%
- +$915
- After-tax cash flow
- $802/yr
For passive investors: Depreciation is non-cash, so a rental often shows a tax loss while cash-flowing — sheltering income. Rental losses are passive: they offset passive income freely, and up to $25,000/yr can offset ordinary (W-2) income if you actively participate and your MAGI is under $100k (phasing out to $0 by $150k); unused losses carry forward. On sale, claimed depreciation is recaptured at up to 25%, and gains may owe capital-gains tax (a 1031 exchange can defer both). Figures are a year-1 estimate at your 24.0% rate — not tax advice; consult a CPA.
Schools (NCES district)
- District
- Richland 01
- NCES district ID
- 4503360
- Math proficiency
- 26% ▼ -7.00%
- Reading proficiency
- 36% ▼ -5.00%
- Median HH income
- $38,931
- Composite
- 25.94/100
- National rank
- #7335
- State rank
- #54 of 80 in SC
Livability — Columbia
- Score
- 78/100
- State rank
- #18
- US rank
- #2436
Category grades
Schools grade is shown separately in the Schools card above.
Census & demographics
- Census place
- Columbia, SC
- County
- Richland County · 389,530 people
- City population
- 12,538
- Metro
- Columbia, SC
- Population (ZIP)
- 12,538
- Household income
- $60,307
- Rent vs Own
- Severe rent burden
- 236.0
Population outlook (Richland County) Hauer SSP2
- Today (2025)
- 459,667 people
- By 2030
- 487,524 · +6.1%
- By 2040
- 542,035 · +17.9%
- By 2050
- 595,371 · +29.5%
- By 2075
- 732,998 · +59.5%
- By 2100
- 820,415 · +78.5%
Race, ethnicity, and origin ACS 2023
- Neighborhood character
- Predominantly Black (68%)
- Race & ethnicity
- Black 68% White 23% Two or more races 6% Hispanic / Latino 4%
- Common ancestry
- Italian 1% Lithuanian 1% Romanian 1%
- Foreign-born
- 3% · Canada
- Languages at home
- 96% English-only · Spanish 3%
Political lean MEDSL · Richland
- 2024 margin
- Solid D (+34.6) · D 66.4% · R 31.8% · Other 1.8%
- 2008→2024 swing
- +5.7pp toward D · 2008: 28.9pp · 2024: 34.6pp
- All cycles
- 2024: D+34.6 2020: D+38.3 2016: D+32.9 2012: D+33.3 2008: D+28.9
Not yet ingested
- Civics
- —
Market trends
- HPI YoY
- ▼ -57.44%
- Current HPI
- 194.8986
- Rent YoY
- —
- Metro
- Columbia, SC
- State GDP YoY
- ▲ 4.51%
- F500 in state
- 2
Industry mix (Fortune 500 HQ in SC)
| Industry | F500 HQs | Revenue |
|---|---|---|
| Packaging | 1 | $7B |
|
||
Price history
-99.2% since first listed18 events — show timeline
- 2025-05-30 Rental Removed $1,850 Avail
- 2025-05-12 Listed for Rent $1,850 Avail
- 2025-05-03 Rental Removed $1,850 Avail
- 2025-04-01 Listed for Rent $1,850 Avail
- 2025-03-14 Rental Removed $1,850 Avail
- 2025-02-10 Listed for Rent $1,850 Avail
- 2024-01-10 Pending — SBOR
- 2024-01-09 Pending — Consolidated MLS
- 2024-01-08 Listed $219,000 SBOR
- 2024-01-02 Delisted — Consolidated MLS
- 2024-01-01 Listed $219,900 Consolidated MLS
- 2023-12-28 Listed $219,900 Charleston Trident MLS
- 2023-12-20 Relisted — Consolidated MLS
- 2023-11-19 Pending — Consolidated MLS
- 2023-11-17 Price Changed $219,900 Consolidated MLS
- 2023-11-17 Relisted — Consolidated MLS
- 2023-06-19 Pending — Consolidated MLS
- 2023-06-19 Listed $217,900 Consolidated MLS
Cash-flow waterfall
monthlySold comps — $/sqft
last 12 mo · ≤1 miLoading sold comps…