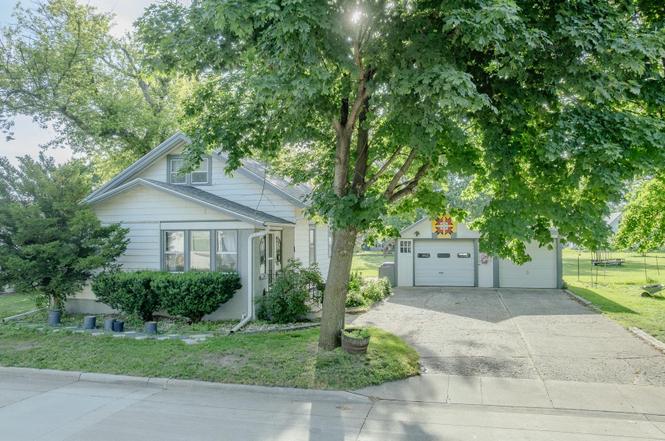
540 7th Ave W · Spencer, IA
Flood risk 1/10 · Minimal
- FEMA flood zone
- X (unshaded)
- Chance of flooding over 30 yrs
- 0.0%
- Est. flood insurance / yr
- $473 – $860
Fire risk 3/10 · Minor
- Est. fire insurance / yr
- $902 – $1,676
Heat risk 2/10 · Minimal
- Hot days now (above 99°F)
- 7 days/yr
- Hot days in 30 yrs
- 16 days/yr
Wind risk 2/10 · Minimal
- Chance of severe wind over 30 yrs
- —
Air-quality risk 1/10 · Minimal
- Unhealthy air days now
- 0 days/yr
- Unhealthy air days in 30 yrs
- 0 days/yr
Risk factors via First Street. Map © Google.
Why this score? — see what drove the C+ grade
The composite is a weighted blend of 9 inputs, each scored 0–100. Each bar is that input's sub-score; the figure is the points it added to the 100-point composite (weight × sub-score).
- Cash flow +25.7/30.0
- DSCR +8.5/10.0
- Schools +6.1/10.0
- 1% rule +5.9/10.0
- ARV discount +5.8/15.0
- Livability +3.9/5.0
- Rent growth +2.5/5.0
- Condition / age +2.5/5.0
- Appreciation +0.0/10.0
$129,000
🖨 Deal sheet 📄 Offer letter ✓ Due diligence
Listing remarks
This charming 1½-story bungalow, built in 1900, is a solid, well-maintained home full of character and potential. Situated on a generous property that includes an extra lot, it offers added flexibility for future expansion, additional parking, or other possibilities, with the curb already in place for a driveway approach. The home features 2+ bedrooms, 1½ bathrooms, a welcoming 3-season room, and a detached 2-car garage. A full bathroom is located in the basement, although the fixtures were not replaced following the 2024 flood, providing an opportunity for the new owner to finish the space to their liking. As a result of the flood, the furnace, water heater, washer, and dryer
Key facts
- Extra lot
- New furnace
- New water heater
Tags
Property features AI
Finance
- Financial info: Annual tax amount listed (see full listing for details)
Exterior
- Parking: Detached concrete garage with 2-car capacity
- Utilities: Public water; Public sewer
- Home design: Single-family residence; One and one-half level; One-story listed; Aluminum siding; Asphalt roof; Located in HAINES COURT subdivision
- Construction: Built with aluminum siding
- Exterior features: Publicly maintained road access; Lot approximately 84 x 140 (0.27 acres)
Interior
- Bathrooms: One three-quarter bathroom; One half bathroom
- Heating & cooling: Natural gas forced air heating; Central air conditioning
- Interior features: Full basement; Porch
Neighborhood map
What this means for you Summary
Snapshot
- This is a 2-bed/3.0-bath single-family listed at $129k.
Deal economics
- At list price, monthly cash flow is $307 ($4k/yr) — positive.
- The deal already cash-flows at list — no discount required.
- Meets the 1% rule at list price ($1k rent vs $129k).
- Cap rate 9.2% vs local median 4.6% in Spencer — top-decile yield for the area; either an underpriced asset or a hidden risk that comps aren't pricing in. Stress-test before assuming the spread holds.
Location & tenants
- Location reads 77/100 on livability (#168 in IA, #3,020 nationally) — a middle-class / working-renter tenant base. Strengths: schools A+, crime A+, cost of living A+; Watch: employment D, amenities F, commute F.
- Spencer Community School District (town): math 73% / reading 72% proficiency, ranked #114 of 289 in IA (top 39%) — strong family-tenant draw, lease renewals of 3-5y typical.
- Market conditions: 108 active listings in the ZIP; 2 comparable units currently listed for rent nearby; 11 units permitted in Clay County in 2024 (0 in 5+ unit buildings).
Forward outlook
- Local home prices are declining (-3.0%/yr); year-one equity from $892 of loan paydown is wiped out by about $4k of value loss. Plan a longer hold.
- Clay County population projected to shrink 6% by 2050 — rents likely to lag national; underwrite the cash flow, not the appreciation.
Negotiation context
- Only 3 days on market — expect competitive offers; lowballing is unlikely to land.
Risks & watch-outs
- Watch-outs: built in 1900 — expect roof / HVAC / electrical / plumbing capex.
Questions for the listing agent
- Built in 1900 — when were the roof, HVAC, electrical panel, plumbing, and water heater last replaced?
- Is there a deadline driving the sale (1031 exchange, divorce, estate, relocation)? That informs how much negotiation room exists.
- Schools are A-rated — typically a magnet for longer-tenancy family renters. What's the average tenant stay here, and is there a school-zone premium baked into asking?
- What's the average days-on-market for RENTAL listings here right now (not sales)? A rising rental-DOM trend means longer vacancies and softer asking-rent achievability than the comps imply.
- What's the recent tenant-quality profile in this submarket — average credit score on applications, eviction rate, late-payment / NSF rate, and stable-employment percentage? A property-management company in the area should have these aggregated.
- How much new for-sale + rental construction is in the pipeline within 1–3 miles? Heavy new supply typically softens prices + rents 12–24 months out; constrained supply supports both.
Investment metrics
- 1% rule
- 1.09% ✓
- Cap rate
- 9.15%
- Cash-on-cash
- 10.21%
- DSCR
- 1.45
- GRM
- 7.7
CMA / ARV
- ARV (on-the-fly)
- $124,416
- Comps found
- 12
Show comp detail 12 sales within ~0.75 mi
| Address | Dist | Beds/Ba | Sqft | Sold | Price | $/sf | Match |
|---|---|---|---|---|---|---|---|
| 422 11th Ave W | 0.27mi | 3/1.0 (+1) | 1,107 (-4%) | 6mo | $152,500 | $138 | 63 |
| 1025 W 7th St | 0.29mi | 2/1.0 | 1,080 (-6%) | 7mo | $118,000 | $109 | 62 |
| 821 Fisher Ct | 0.21mi | 2/1.5 | 1,296 (+12%) | 2mo | $140,000 | $108 | 62 |
| 309 Tompkins Ct | 0.62mi | 3/1.0 (+1) | 1,160 (+1%) | 3mo | $107,500 | $93 | 54 |
| 309 12th Ave W | 0.41mi | 3/1.0 (+1) | 1,232 (+7%) | 2mo | $123,600 | $100 | 54 |
| 1112 3rd Ave W | 0.49mi | 3/1.0 (+1) | 1,144 (-1%) | 10mo | $102,800 | $90 | 54 |
| 32 W 1st St | 0.57mi | 3/1.0 (+1) | 1,195 (+4%) | 2mo | $114,000 | $95 | 53 |
| 1211 W 7th St | 0.41mi | 2/1.5 | 1,243 (+8%) | 13mo | $169,000 | $136 | 51 |
| 302 E 9th St | 0.74mi | 2/2.0 | 1,224 (+6%) | 12mo | $137,500 | $112 | 41 |
| 120 E 3rd St | 0.67mi | 3/1.0 (+1) | 1,041 (-10%) | 6mo | $120,000 | $115 | 35 |
| 106 E 10th St | 0.64mi | 3/1.0 (+1) | 1,296 (+12%) | 6mo | $112,500 | $87 | 32 |
| 721 3rd Ave E | 0.70mi | 3/1.0 (+1) | 1,307 (+14%) | 13mo | $89,500 | $68 | 21 |
Match score weights: distance 35% · size 25% · config 20% · recency 20%. Top-matched comps best support the ARV.
Projected returns pro-forma
-3.0% appreciation · 3.0% rent growth · sell at horizon
- IRR
- -1.0%
- Equity multiple
- 0.96×
- Total profit
- $-1,373
- Equity at exit
- $19,234
- IRR
- 8.7%
- Equity multiple
- 1.66×
- Total profit
- $23,860
- Equity at exit
- $11,154
Cash invested: $36,120 (down + closing). Projections, not guarantees.
Landlord ↔ Tenant lean methodology
- Overall (STATE)
- 83 Strongly Landlord-Friendly
- State Iowa
- 83 Strongly Landlord-Friendly · R+6
- County
- — inherits STATE
- City
- — inherits STATE
ZIP-level market 51301
- Home prices YoY
- -35.0%
- Active inventory
- 108
- Price-to-rent
- 7.7×
Monthly cashflow live
- Estimated rent
- $1,405 medium interval (Pro) →
- Mortgage (P&I)
- −$676
- Tax from tax record
- −$72 /mo · $868/yr
- Insurance
- −$54
- HOA
- −$0
- Vacancy / Maint / Mgmt
- −$295
- Net cashflow
- $307
Break-even live
UW: 25.0% down · 7.5% · 30yr · 1.5% tax · 5.0% vac · 8.0% maint · 8.0% mgmt
Financing live
Cash to close
- Down payment
- $32,250
- Closing costs
- $3,870
- Reserves months
- —
- Total cash needed
- —
Loan-product check · same deal, 3 products live
Conventional
25% down · 7.5% · 30yr
- Down + closing
- —
- Monthly P&I
- —
- Monthly cashflow
- —
- DSCR
- —
- Eligible?
- —
Personal DTI + credit; lowest rate.
DSCR
20% down · 8.5% · 30yr
- Down + closing
- —
- Monthly P&I
- —
- Monthly cashflow
- —
- DSCR
- —
- Eligible?
- —
No personal income docs; deal must DSCR.
Hard money
10% down · 12.0% · 12mo
- Down + closing
- —
- Monthly P&I
- —
- Monthly cashflow
- —
- DSCR
- —
- Eligible?
- —
Short-term bridge; refi at stabilization.
Rent comps 2 comps
| Address | Beds | Baths | Sqft | Rent | $/sqft | DOM | Units | Dist |
|---|---|---|---|---|---|---|---|---|
| 801 9th St SW Unit 814-D6 Spencer, IA | 3.0 | 2.0 | 1230 | $1,460 | $1.19 | 43d | 1 | 0.95mi |
| 801 9th St SW Unit 1001-201 Spencer, IA | 3.0 | 2.0 | 998 | $1,345 | $1.35 | 43d | 1 | 0.95mi |
Listing history 4 events
-
2026-06-18days on market $129,000 Active 3 DOM
-
2026-06-17days on market $129,000 Active 2 DOM
-
2026-06-16remarks 685-char remark
-
2026-06-16$129,000 Active 1 DOM
ⓘ Source: listings_history table (triggers on properties + properties_extension) + one-shot
backfill from property_details.listing_events for pre-trigger history.
Tax reassessment forecast IA · Partial reset (capped growth)
- Current annual tax
- $868 · $72/mo
- Projected year-2 tax
- $1,447 · $121/mo
- Expected delta
- +$579/yr (+$48/mo · 66.7%)
ⓘ Screening estimate from a state-policy table — verify with the county assessor before closing.
Climate risk First Street
- Flood 1/10 Low FEMA zone X (unshaded) · 0% chance over 30 yrs
- Wildfire 3/10 Moderate
- Heat 2/10 Low 7 d/yr ≥99°F today · 16 d/yr by 30 yrs out
- Wind 2/10 Low
- Air quality 1/10 Low 0 unhealthy d/yr today · 0 by 30 yrs out
Nearby sold comps map
Loading sold comps map…
Walkable amenities ~0.75 mi
Loading nearby amenities…
Taxation est. · year 1
- Rental income
- $16,857
- − Mortgage interest
- −$7,226
- − Property taxes
- −$868
- − Insurance
- −$645
- − Repairs & maintenance
- −$1,349
- − Management
- −$1,349
- − Depreciation
- −$3,753
- Taxable income
- $1,668
- Est. tax owed @ 24.0%
- −$400
- After-tax cash flow
- $3,286/yr
For passive investors: Depreciation is non-cash, so a rental often shows a tax loss while cash-flowing — sheltering income. Rental losses are passive: they offset passive income freely, and up to $25,000/yr can offset ordinary (W-2) income if you actively participate and your MAGI is under $100k (phasing out to $0 by $150k); unused losses carry forward. On sale, claimed depreciation is recaptured at up to 25%, and gains may owe capital-gains tax (a 1031 exchange can defer both). Figures are a year-1 estimate at your 24.0% rate — not tax advice; consult a CPA.
Schools (NCES district)
- District
- Spencer Community School District
- NCES district ID
- 1926910
- Math proficiency
- 73% ▼ -7.00%
- Reading proficiency
- 72% ▼ -6.00%
- Median HH income
- $45,474
- Composite
- 61.02/100
- National rank
- #797
- State rank
- #114 of 289 in IA
Livability — Spencer
- Score
- 77/100
- State rank
- #168
- US rank
- #3020
Category grades
Schools grade is shown separately in the Schools card above.
Census & demographics
- Census place
- Spencer, IA
- City population
- 12,402
- Population (ZIP)
- 12,402
Population outlook (Clay County) Hauer SSP2
- Today (2025)
- 16,277 people
- By 2030
- 16,073 · -1.3%
- By 2040
- 15,638 · -3.9%
- By 2050
- 15,315 · -5.9%
- By 2075
- 15,026 · -7.7%
- By 2100
- 14,638 · -10.1%
Race, ethnicity, and origin ACS 2023
- Neighborhood character
- Predominantly White (91%)
- Race & ethnicity
- White 91% Hispanic / Latino 5% Two or more races 4%
- Hispanic origin (detail)
- Mexican 4%
- Common ancestry
- Portuguese 14% Iranian 4% Lithuanian 2%
- Foreign-born
- 1% · Canada, South Korea
- Languages at home
- 98% English-only · Spanish 1%
Political lean MEDSL · Clay
- 2024 margin
- Solid R (+43.2) · D 27.8% · R 71.0% · Other 1.2%
- 2008→2024 swing
- -38.1pp toward R · 2008: -5.1pp · 2024: -43.2pp
- All cycles
- 2024: R+43.2 2020: R+38.7 2016: R+42.4 2012: R+18.7 2008: R+5.1
Not yet ingested
- Civics
- —
Market trends
- HPI YoY
- ▼ -103.43%
- Current HPI
- 192.1741
- Rent YoY
- —
- Metro
- —
- State GDP YoY
- ▲ 2.48%
- F500 in state
- 4
Industry mix (Fortune 500 HQ in IA)
| Industry | F500 HQs | Revenue |
|---|---|---|
| Financial Services | 1 | $16B |
|
||
| Retail / Convenience | 1 | $15B |
|
||
Price history
1 event — show timeline
- 2026-06-15 Listed $129,000 Iowa Great Lakes BOR
Property tax history
-1.6%/yrLatest (2025): $868 · -6.7% YoY. Source: county tax records.
Cash-flow waterfall
monthlySold comps — $/sqft
last 12 mo · ≤1 miLoading sold comps…