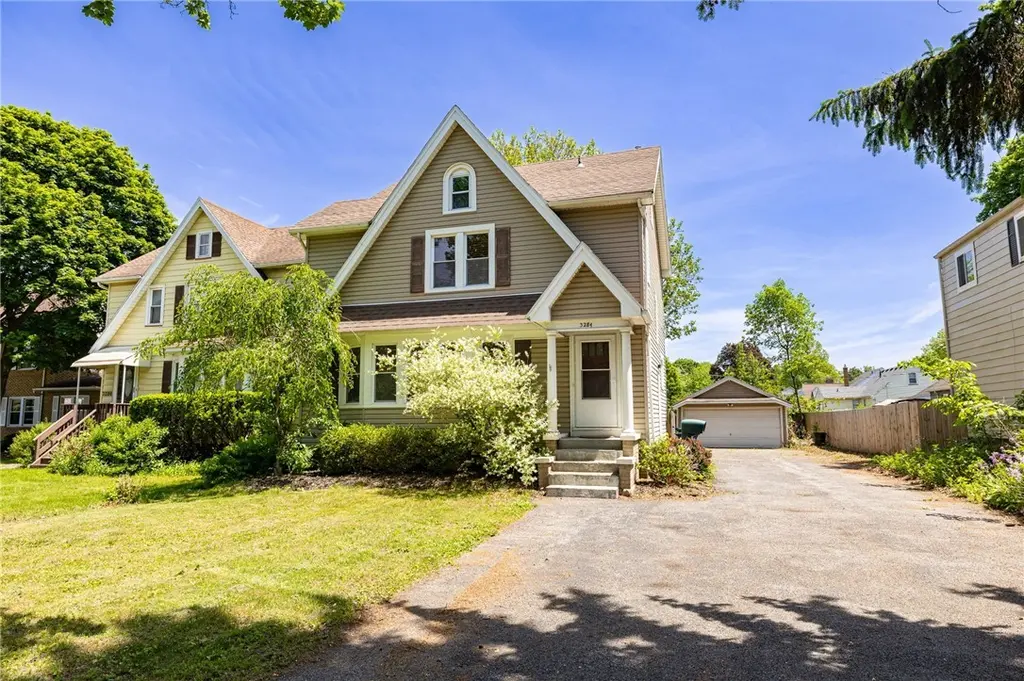
3284 Culver Rd · Irondequoit, NY
Flood risk 1/10 · Minimal
- FEMA flood zone
- X (unshaded)
- Chance of flooding over 30 yrs
- 0.0%
- Est. flood insurance / yr
- $473 – $860
Fire risk 1/10 · Minimal
- Est. fire insurance / yr
- $691 – $1,283
Heat risk 2/10 · Minimal
- Hot days now (above 95°F)
- 7 days/yr
- Hot days in 30 yrs
- 16 days/yr
Wind risk 1/10 · Minimal
- Chance of severe wind over 30 yrs
- —
Air-quality risk 2/10 · Minimal
- Unhealthy air days now
- 1 days/yr
- Unhealthy air days in 30 yrs
- 2 days/yr
Risk factors via First Street. Map © Google.
Why this score? — see what drove the C- grade
The composite is a weighted blend of 9 inputs, each scored 0–100. Each bar is that input's sub-score; the figure is the points it added to the 100-point composite (weight × sub-score).
- ARV discount +15.0/15.0
- Cash flow +13.5/30.0
- 1% rule +5.4/10.0
- DSCR +4.1/10.0
- Livability +4.0/5.0
- Schools +3.7/10.0
- Rent growth +2.5/5.0
- Condition / age +2.5/5.0
- Appreciation +0.0/10.0
$219,900
🖨 Deal sheet 📄 Offer letter ✓ Due diligence
Listing remarks MLS
CHARMING COLONIAL!! This one is a SLAM DUNK!! Fall in love with the Bay Window lined Living Room and built ins that hug the gas log fireplace. Can you say cozy? Ample sized archways make everything feel OPEN. Large Dining Room with a French door, that leads to the deck AND paver patio, perfect for backyard cookouts! The Kitchen has subway tile backsplash, stainless steel appliances and a newer dishwasher. Hardwoods throughout!! UPDATED Full Bathroom (in the last 4 years) with a BRAND NEW vanity (2025). Extra storage in the full walk up attic! AND if you're still looking for space to spread out, the partially finished basement with a half bath is your blank canvas to create that extra room you want or need! Enjoy splendid summers in the FULLY fenced backyard (and again, the deck and patio!). The two car detached garage means you can say goodbye to your snow brush next winter! THIS HOUSE HAS IT ALL! Close to shopping, restaurants and schools! Other features include: Furnace (2015), central air, vinyl replacement windows throughout and greenlight internet. Better have this one in your bracket- this home a WINNER! Delayed negotiations on file: Showings begin Thursday March 27th at 9am, Offers due Tuesday April 1st at 2pm.
Key facts
- French doors
- Updated kitchen
- Paver patio
Tags
Property features AI
Exterior
- Parking: Detached garage; 2-car garage with garage door opener
- Utilities: Public water connected; Sewer connected; Cable available; High-speed internet available
- Home design: 2-story residence; Vinyl siding; Block foundation; Existing (resale) property
- Construction: Built (existing); Vinyl siding construction; Block foundation
- Exterior features: Deck; Patio; Fully fenced yard; Blacktop driveway; Rectangular lot; Main thoroughfare frontage
Interior
- Kitchen: Electric oven; Electric range; Dishwasher; Garbage disposal; Refrigerator
- Flooring: Hardwood; Ceramic tile; Tile; Vinyl; Linoleum; Varied flooring
- Bathrooms: 1 full bathroom; 1 half bathroom
- Heating & cooling: Forced air heating (gas); Central air conditioning
- Interior features: Separate formal dining room; Separate formal living room; Full, partially finished basement; Basement laundry area; One fireplace
- Laundry & utility: Washer; Dryer (located in basement); Gas water heater
Neighborhood map
What this means for you Summary
Snapshot
- This is a 3-bed/1.5-bath single-family listed at $220k.
Deal economics
- At list price, monthly cash flow is $8 ($92/yr) — positive.
- The deal already cash-flows at list — no discount required.
- Meets the 1% rule at list price ($2k rent vs $220k).
- Cap rate 6.3% vs local median 4.5% in Irondequoit — top-decile yield for the area; either an underpriced asset or a hidden risk that comps aren't pricing in. Stress-test before assuming the spread holds.
Location & tenants
- Location reads 81/100 on livability (#92 in NY, #1,414 nationally) — a professional / high-income tenant draw. Strengths: housing A+, health & safety A+, crime B+; Watch: amenities F.
- East Irondequoit Central School District (suburban): math 40% / reading 47% proficiency, ranked #475 of 590 in NY (top 80%) — families likely to look elsewhere, expect single-tenant / working-renter base with shorter leases.
- Market conditions: 47 active listings in the ZIP; 4 comparable units currently listed for rent nearby; rentals at typical pace (median 21d on market — plan ~3-4 weeks tenant-placement turnaround); solid renter incomes; 1,169 units permitted in Monroe County in 2024 (591 in 5+ unit buildings).
- This rent runs 36% of the median local income ($75k/yr) — at the standard rent-burdened threshold; future hikes will face affordability resistance.
Forward outlook
- Local home prices are declining (-3.0%/yr); year-one equity from $2k of loan paydown is wiped out by about $7k of value loss. Plan a longer hold.
- Monroe County population projected to shrink 6% by 2050 — rents likely to lag national; underwrite the cash flow, not the appreciation.
Negotiation context
- Only 1 days on market — expect competitive offers; lowballing is unlikely to land.
- 8 sale attempts since 15y ago with the ask held roughly flat each time — persistent listings suggest the price (not the market) is what's stuck; bring a comps-based counter.
Risks & watch-outs
- Watch-outs: property tax is 3.0% of price; built in 1930 — expect roof / HVAC / electrical / plumbing capex.
Questions for the listing agent
- Built in 1930 — when were the roof, HVAC, electrical panel, plumbing, and water heater last replaced?
- Property tax is high relative to price — has the assessment been appealed recently, and will the sale trigger a re-assessment?
- Is there a deadline driving the sale (1031 exchange, divorce, estate, relocation)? That informs how much negotiation room exists.
- Schools are B-rated — typically a magnet for longer-tenancy family renters. What's the average tenant stay here, and is there a school-zone premium baked into asking?
- What's the average days-on-market for RENTAL listings here right now (not sales)? A rising rental-DOM trend means longer vacancies and softer asking-rent achievability than the comps imply.
- What's the recent tenant-quality profile in this submarket — average credit score on applications, eviction rate, late-payment / NSF rate, and stable-employment percentage? A property-management company in the area should have these aggregated.
- How much new for-sale + rental construction is in the pipeline within 1–3 miles? Heavy new supply typically softens prices + rents 12–24 months out; constrained supply supports both.
Investment metrics
- 1% rule
- 1.04% ✓
- Cap rate
- 6.33%
- Cash-on-cash
- 0.15%
- DSCR
- 1.01
- GRM
- 8.0
CMA / ARV
- ARV (on-the-fly)
- $308,028
- Comps found
- 12
Show comp detail 12 sales within ~0.75 mi
| Address | Dist | Beds/Ba | Sqft | Sold | Price | $/sf | Match |
|---|---|---|---|---|---|---|---|
| 3450 Culver Rd | 0.24mi | 3/2.0 | 1,496 (-6%) | 2mo | $165,000 | $110 | 75 |
| 1975 Titus Ave | 0.18mi | 3/2.0 | 1,461 (-8%) | 2mo | $225,000 | $154 | 74 |
| 85 Hartsdale Rd | 0.37mi | 3/2.5 | 1,532 (-4%) | 1mo | $285,000 | $186 | 72 |
| 294 Walzer Rd | 0.14mi | 4/1.0 (+1) | 1,472 (-8%) | 3mo | $184,600 | $125 | 71 |
| 269 Hartsdale Rd | 0.59mi | 3/1.5 | 1,566 (-2%) | 1mo | $355,000 | $227 | 69 |
| 278 Winfield Rd | 0.40mi | 3/2.0 | 1,501 (-6%) | 1mo | $290,000 | $193 | 69 |
| 379 Brandon Rd | 0.63mi | 4/2.0 (+1) | 1,536 (-4%) | 1mo | $302,500 | $197 | 56 |
| 234 Pemberton Rd | 0.47mi | 3/2.0 | 1,417 (-11%) | 1mo | $350,000 | $247 | 56 |
| 268 Angelus Dr | 0.71mi | 3/2.0 | 1,463 (-8%) | 0mo | $251,202 | $172 | 51 |
| 54 Ransford Ave | 0.54mi | 3/2.5 | 1,368 (-14%) | 2mo | $287,000 | $210 | 45 |
| 2820 Culver Rd | 0.67mi | 3/1.5 | 1,362 (-15%) | 2mo | $250,350 | $184 | 43 |
| 333 Brandon Rd | 0.58mi | 4/2.0 (+1) | 1,824 (+14%) | 1mo | $382,000 | $209 | 41 |
Match score weights: distance 35% · size 25% · config 20% · recency 20%. Top-matched comps best support the ARV.
Projected returns pro-forma
-3.0% appreciation · 3.0% rent growth · sell at horizon
- IRR
- -16.0%
- Equity multiple
- 0.43×
- Total profit
- $-34,940
- Equity at exit
- $32,788
- IRR
- -7.4%
- Equity multiple
- 0.53×
- Total profit
- $-28,969
- Equity at exit
- $19,013
Cash invested: $61,572 (down + closing). Projections, not guarantees.
Landlord ↔ Tenant lean methodology
- Overall (STATE)
- 15 Strongly Tenant-Friendly
- State New York
- 15 Strongly Tenant-Friendly · D+10
- County
- — inherits STATE
- City
- — inherits STATE
ZIP-level market 14622
- Home prices YoY
- -8.1%
- Active inventory
- 47
- Price-to-rent
- 8.0×
Monthly cashflow live
- Estimated rent
- $2,281 medium interval (Pro) →
- Mortgage (P&I)
- −$1,153
- Tax from tax record
- −$549 /mo · $6,591/yr
- Insurance
- −$92
- HOA
- −$0
- Vacancy / Maint / Mgmt
- −$479
- Net cashflow
- $8
Break-even live
UW: 25.0% down · 7.5% · 30yr · 1.5% tax · 5.0% vac · 8.0% maint · 8.0% mgmt
Financing live
Cash to close
- Down payment
- $54,975
- Closing costs
- $6,597
- Reserves months
- —
- Total cash needed
- —
Loan-product check · same deal, 3 products live
Conventional
25% down · 7.5% · 30yr
- Down + closing
- —
- Monthly P&I
- —
- Monthly cashflow
- —
- DSCR
- —
- Eligible?
- —
Personal DTI + credit; lowest rate.
DSCR
20% down · 8.5% · 30yr
- Down + closing
- —
- Monthly P&I
- —
- Monthly cashflow
- —
- DSCR
- —
- Eligible?
- —
No personal income docs; deal must DSCR.
Hard money
10% down · 12.0% · 12mo
- Down + closing
- —
- Monthly P&I
- —
- Monthly cashflow
- —
- DSCR
- —
- Eligible?
- —
Short-term bridge; refi at stabilization.
Rent comps 4 comps
| Address | Beds | Baths | Sqft | Rent | $/sqft | DOM | Units | Dist |
|---|---|---|---|---|---|---|---|---|
| 2 Kings Ct Way Rochester, NY | 1.0–2.0 | 1.0–1.5 | 999 | $1,615 | $1.62 | 2d | 8 | 0.90mi |
| 100 Hulda Park Rochester, NY | 1.0–2.0 | 1.0–1.5 | 3759 | $782 | $0.21 | 21d | 1 | 1.00mi |
| 149 Brookdale Park Rochester, NY | 4.0 | 1.5 | 1543 | $2,950 | $1.91 | 21d | 1 | 1.05mi |
| 2450 Culver Rd Rochester, NY | 3.0 | 1.5 | 1380 | $2,400 | $1.74 | 3d | 1 | 1.20mi |
Listing history 2 events
-
2026-06-18remarks 693-char remark
-
2026-06-18$219,900 Active 1 DOM
ⓘ Source: listings_history table (triggers on properties + properties_extension) + one-shot
backfill from property_details.listing_events for pre-trigger history.
Tax reassessment forecast NY · Partial reset (capped growth)
- Current annual tax
- $6,591 · $549/mo
- Projected year-2 tax
- $6,591 · $549/mo
- Expected delta
- $0/yr ($0/mo · 0.0%)
ⓘ Screening estimate from a state-policy table — verify with the county assessor before closing.
Climate risk First Street
- Flood 1/10 Low FEMA zone X (unshaded) · 0% chance over 30 yrs
- Wildfire 1/10 Low
- Heat 2/10 Low 7 d/yr ≥95°F today · 16 d/yr by 30 yrs out
- Wind 1/10 Low
- Air quality 2/10 Low 1 unhealthy d/yr today · 2 by 30 yrs out
Nearby sold comps map
Loading sold comps map…
Walkable amenities ~0.75 mi
Loading nearby amenities…
Taxation est. · year 1
- Rental income
- $27,368
- − Mortgage interest
- −$12,318
- − Property taxes
- −$6,591
- − Insurance
- −$1,100
- − Repairs & maintenance
- −$2,189
- − Management
- −$2,189
- − Depreciation
- −$6,397
- Taxable loss
- −$3,416
- Est. tax savings @ 24.0%
- +$820
- After-tax cash flow
- $912/yr
For passive investors: Depreciation is non-cash, so a rental often shows a tax loss while cash-flowing — sheltering income. Rental losses are passive: they offset passive income freely, and up to $25,000/yr can offset ordinary (W-2) income if you actively participate and your MAGI is under $100k (phasing out to $0 by $150k); unused losses carry forward. On sale, claimed depreciation is recaptured at up to 25%, and gains may owe capital-gains tax (a 1031 exchange can defer both). Figures are a year-1 estimate at your 24.0% rate — not tax advice; consult a CPA.
Schools (NCES district)
- District
- East Irondequoit Central School District
- NCES district ID
- 3609690
- Math proficiency
- 40% ▼ -12.00%
- Reading proficiency
- 47% ▲ 8.00%
- Median HH income
- $48,946
- Composite
- 37.27/100
- National rank
- #4451
- State rank
- #475 of 590 in NY
Livability — Irondequoit
- Score
- 81/100
- State rank
- #92
- US rank
- #1414
Category grades
Schools grade is shown separately in the Schools card above.
Census & demographics
- Census place
- Irondequoit, NY
- County
- Monroe County · 674,131 people
- City population
- 74,252
- Metro
- Rochester, NY
- Population (ZIP)
- 12,574
- Household income
- $75,439
- Rent vs Own
- Severe rent burden
- 240.0
Population outlook (Monroe County) Hauer SSP2
- Today (2025)
- 759,460 people
- By 2030
- 757,154 · -0.3%
- By 2040
- 740,644 · -2.5%
- By 2050
- 714,443 · -5.9%
- By 2075
- 645,883 · -15.0%
- By 2100
- 547,084 · -28.0%
Race, ethnicity, and origin ACS 2023
- Neighborhood character
- Predominantly White (77%)
- Race & ethnicity
- White 77% Hispanic / Latino 10% Black 5% Two or more races 5% Asian 4%
- Hispanic origin (detail)
- Puerto Rican 8%
- Common ancestry
- Romanian 8% Lithuanian 2% Iranian 2%
- Foreign-born
- 6% · Canada, South Korea, Philippines
- Languages at home
- 89% English-only · Spanish 4% Russian/Polish/Slavic 2% Other Asian/Pacific 2%
Political lean MEDSL · Monroe
- 2024 margin
- D (+19.1) · D 59.5% · R 40.5%
- 2008→2024 swing
- +1.4pp toward D · 2008: 17.7pp · 2024: 19.1pp
- All cycles
- 2024: D+19.1 2020: D+21.0 2016: D+14.1 2012: D+17.4 2008: D+17.7
Not yet ingested
- Civics
- —
Market trends
- HPI YoY
- ▼ -23.93%
- Current HPI
- 271.5626
- Rent YoY
- —
- Metro
- Rochester, NY
- State GDP YoY
- ▲ 2.60%
- F500 in state
- 92
Industry mix (Fortune 500 HQ in NY)
| Industry | F500 HQs | Revenue |
|---|---|---|
| Financial Services | 10 | $950B |
|
||
| Consumer Goods | 9 | $162B |
|
||
| Insurance | 4 | $225B |
|
||
| Telecommunications | 2 | $144B |
|
||
| Pharmaceuticals | 2 | $112B |
|
||
| Media / Entertainment | 2 | $69B |
|
||
Price history
+729.8% since first listed28 events — show timeline
- 2026-06-17 Listed $219,900 UNYREIS
- 2025-04-30 Sold (MLS) $305,000 UNYREIS
- 2025-04-03 Pending — UNYREIS
- 2025-03-26 Listed $199,900 UNYREIS
- 2018-10-17 Sold (Public Records) $132,000 Public Records
- 2018-10-16 Sold (MLS) $131,700 UNYREIS
- 2018-09-13 Pending — UNYREIS
- 2018-09-10 Listed $129,900 UNYREIS
- 2017-11-06 Sold (Public Records) $125,500 Public Records
- 2017-11-03 Sold (MLS) $125,500 UNYREIS
- 2017-10-02 Pending — UNYREIS
- 2017-09-08 Pending — UNYREIS
- 2017-08-30 Listed $124,900 UNYREIS
- 2016-06-27 Listing Removed — UNYREIS
- 2016-04-04 Price Changed $124,900 UNYREIS
- 2016-03-22 Listed $129,900 UNYREIS
- 2016-03-22 Listing Removed — UNYREIS
- 2016-02-24 Listed $129,900 UNYREIS
- 2013-07-15 Listing Removed — UNYREIS
- 2013-03-25 Sold (Public Records) $125,000 Public Records
- 2013-03-22 Sold (MLS) $125,000 UNYREIS
- 2012-11-06 Listed $129,900 UNYREIS
- 2011-05-12 Sold (Public Records) $115,000 Public Records
- 2011-05-11 Sold (MLS) $115,000 UNYREIS
- 2011-03-01 Listed $119,900 UNYREIS
- 2008-06-02 Sold (Public Records) $114,900 Public Records
- 2008-01-18 Sold (Public Records) $58,000 Public Records
- 2007-10-16 Sold (Public Records) $26,500 Public Records
Property tax history
+1.0%/yrLatest (2025): $6,591 · +1.7% YoY. Source: county tax records.
Cash-flow waterfall
monthlySold comps — $/sqft
last 12 mo · ≤1 miLoading sold comps…