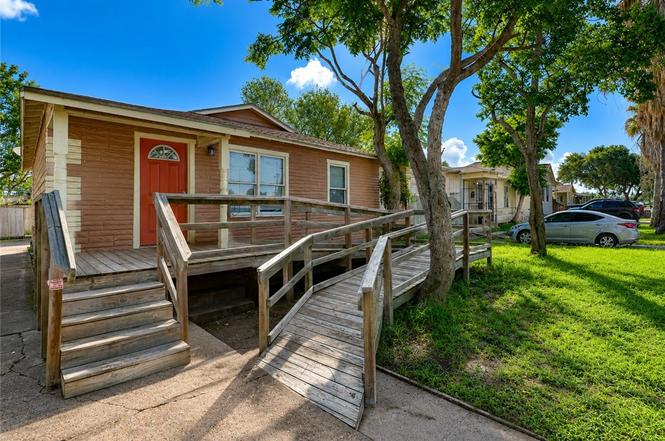
1714 Islla Dr · Corpus Christi, TX
Flood risk 6/10 · Moderate
- FEMA flood zone
- AE
- Chance of flooding over 30 yrs
- 0.68%
- Est. flood insurance / yr
- $1,737 – $8,500
Fire risk 1/10 · Minimal
- Est. fire insurance / yr
- $1,222 – $2,270
Heat risk 10/10 · Severe
- Hot days now (above 107°F)
- 5 days/yr
- Hot days in 30 yrs
- 17 days/yr
Wind risk 9/10 · Severe
- Chance of severe wind over 30 yrs
- 99.0%
Air-quality risk 1/10 · Minimal
- Unhealthy air days now
- 0 days/yr
- Unhealthy air days in 30 yrs
- 0 days/yr
Risk factors via First Street. Map © Google.
Why this score? — see what drove the B+ grade
The composite is a weighted blend of 9 inputs, each scored 0–100. Each bar is that input's sub-score; the figure is the points it added to the 100-point composite (weight × sub-score).
- Cash flow +30.0/30.0
- 1% rule +10.0/10.0
- DSCR +10.0/10.0
- ARV discount +7.5/15.0
- Appreciation +7.2/10.0
- Livability +3.9/5.0
- Schools +2.8/10.0
- Rent growth +2.5/5.0
- Condition / age +2.5/5.0
$66,000
🖨 Deal sheet 📄 Offer letter ✓ Due diligence
Listing remarks
Welcome to 1714 Islla Dr in Corpus Christi, TX! This 4 bedroom, 2 bathroom home is full of potential and waiting for your personal touch. Inside, you’ll find a spacious layout ready for updates and customization to make it truly your own. Outside features include a detached storage area, plenty of shaded space to relax or entertain, and room to enjoy the outdoors. Whether you’re looking for a place to call home or your next investment opportunity, this property offers endless possibilities. Come view today!
Key facts
- Shaded space
- 5,480 sq ft lot
- Built 1954
Tags
Property features AI
Exterior
- Parking: Rear/side/off-street parking
- Security: Smoke detector(s)
- Utilities: Public water; Public sewer; Water and sewer available
- Home design: Single-story home; Wood siding exterior; Pillar/post/pier foundation; Shingle roof
- Construction: Built with wood siding; Shingle roof; Pillar/post/pier foundation; 1 story
- Exterior features: Open patio; Patio; Chain link fencing; Interior lot on a city street
Interior
- Flooring: Carpet; Vinyl
- Bathrooms: 2 full bathrooms
- Interior features: Carpet and vinyl flooring; Smoke detectors
- Laundry & utility: Washer hookup; Dryer hookup
Neighborhood map
What this means for you Summary
Snapshot
- This is a 4-bed/2.0-bath single-family listed at $66k.
Deal economics
- At list price, monthly cash flow is $448 ($5k/yr) — positive.
- The deal already cash-flows at list — no discount required.
- Meets the 1% rule at list price ($2k rent vs $66k).
- Cap rate 22.2% vs local median 3.6% in Corpus Christi — top-decile yield for the area; either an underpriced asset or a hidden risk that comps aren't pricing in. Stress-test before assuming the spread holds.
Location & tenants
- Location reads 78/100 on livability (#66 in TX, #2,404 nationally) — a middle-class / working-renter tenant base. Strengths: commute A+, cost of living A+, housing A+; Watch: crime F.
- Corpus Christi ISD (urban): math 31% / reading 35% proficiency, ranked #562 of 826 in TX (top 68%) — families likely to look elsewhere, expect single-tenant / working-renter base with shorter leases; 63% free/reduced lunch — lower-income household profile, screen leases tightly.
- Market conditions: 44 active listings in the ZIP; 8 comparable units currently listed for rent nearby; rentals lingering (median 44d on market — plan ~5-8 weeks vacancy on turnover, expect pricing pressure); 62% of comp listings sitting > 30 days — soft ceiling on asking rent; lower-income renter base — watch delinquency; 1,397 units permitted in Nueces County in 2024 (47 in 5+ unit buildings).
- At $1,846/mo this rent would consume 51% of the median local household income ($43k/yr) (locally 386% of renters already pay >50% of income on rent) — very limited rent-growth headroom before tenants either downsize or default.
Forward outlook
- In year one you build about $3k of equity ($456 loan paydown + $3k appreciation (4.4% local appreciation)).
- Nueces County population projected at +36% by 2050 — long-run rental-demand tailwind backs the buy-and-hold thesis.
- At projected returns (4.4% appreciation + 3.0% rent growth), your $18k cash investment doubles in ~3 years — after that, you're playing with house money.
- By year 10, paydown + projected appreciation supports a ~$33k cash-out refi (75% LTV) — recoverable capital for the next deal without selling this one.
Negotiation context
- Only 4 days on market — expect competitive offers; lowballing is unlikely to land.
Risks & watch-outs
- Watch-outs: property tax is 3.8% of price; flood insurance adds $427/mo; built in 1954 — expect roof / HVAC / electrical / plumbing capex.
- Climate carrying-cost: in FEMA flood zone AE (mandatory federal flood insurance); severe wind risk, 99% chance of damaging wind over 30y; extreme-heat days projected 5→17/yr by 2055 (HVAC capex compounding) — expect insurance premiums to compound above CPI over the hold.
Questions for the listing agent
- Built in 1954 — when were the roof, HVAC, electrical panel, plumbing, and water heater last replaced?
- Property tax is high relative to price — has the assessment been appealed recently, and will the sale trigger a re-assessment?
- What's the actual annual flood-insurance premium (NFIP or private), and is the property in a SFHA with mandatory coverage?
- Is there a deadline driving the sale (1031 exchange, divorce, estate, relocation)? That informs how much negotiation room exists.
- Crime grade is F in this area — have there been break-ins, vandalism, or insurance claims at this property in the last 3 years? What carrier currently insures it and at what premium?
- What's the average days-on-market for RENTAL listings here right now (not sales)? A rising rental-DOM trend means longer vacancies and softer asking-rent achievability than the comps imply.
- What's the recent tenant-quality profile in this submarket — average credit score on applications, eviction rate, late-payment / NSF rate, and stable-employment percentage? A property-management company in the area should have these aggregated.
- How much new for-sale + rental construction is in the pipeline within 1–3 miles? Heavy new supply typically softens prices + rents 12–24 months out; constrained supply supports both.
Investment metrics
- 1% rule
- 2.80% ✓
- Cap rate
- 22.19%
- Cash-on-cash
- 56.77%
- DSCR
- 3.53
- GRM
- 3.0
CMA / ARV
- ARV (on-the-fly)
- $167,808
- Comps found
- 11
Show comp detail 11 sales within ~0.75 mi
| Address | Dist | Beds/Ba | Sqft | Sold | Price | $/sf | Match |
|---|---|---|---|---|---|---|---|
| 1826 Yale St | 0.34mi | 4/2.0 | 1,805 (+3%) | 12mo | $65,000 | $36 | 69 |
| 1609 Sherman St | 0.20mi | 5/2.5 (+1) | 1,874 (+7%) | 14mo | $181,600 | $97 | 60 |
| 1805 Sherman St | 0.25mi | 5/2.0 (+1) | 1,680 (-4%) | 22mo | $168,000 | $100 | 59 |
| 1621 Birch Pl | 0.53mi | 4/2.0 | 1,699 (-3%) | 16mo | $67,000 | $39 | 58 |
| 1826 Horne Rd | 0.39mi | 3/2.0 (-1) | 1,844 (+6%) | 13mo | $185,900 | $101 | 57 |
| 1806 Juarez St | 0.45mi | 4/3.0 | 1,704 (-2%) | 18mo | $169,900 | $100 | 56 |
| 1705 Sherman St | 0.18mi | 3/2.5 (-1) | 1,976 (+13%) | 9mo | $189,000 | $96 | 55 |
| 1526 Madrid Dr | 0.50mi | 3/3.0 (-1) | 1,730 (-1%) | 15mo | $110,000 | $64 | 54 |
| 1806 Loritte Dr | 0.50mi | 3/2.0 (-1) | 1,946 (+11%) | 15mo | $179,900 | $92 | 40 |
| 1401 Barcelona Dr | 0.69mi | 4/1.0 | 1,507 (-14%) | 3mo | $161,000 | $107 | 38 |
| 4621 Bluebelle Ln | 0.66mi | 3/2.0 (-1) | 1,492 (-15%) | 23mo | $115,000 | $77 | 21 |
Match score weights: distance 35% · size 25% · config 20% · recency 20%. Top-matched comps best support the ARV.
Projected returns pro-forma
4.38% appreciation · 3.0% rent growth · sell at horizon
- IRR
- 37.6%
- Equity multiple
- 3.26×
- Total profit
- $41,776
- Equity at exit
- $34,936
- IRR
- 36.4%
- Equity multiple
- 6.60×
- Total profit
- $103,531
- Equity at exit
- $58,348
Cash invested: $18,480 (down + closing). Projections, not guarantees.
Landlord ↔ Tenant lean methodology
- Overall (STATE)
- 87 Strongly Landlord-Friendly
- State Texas
- 87 Strongly Landlord-Friendly · R+5
- County
- — inherits STATE
- City
- — inherits STATE
ZIP-level market 78416
- Home prices YoY
- 3.2%
- Active inventory
- 44
- Price-to-rent
- 3.0×
Monthly cashflow live
- Estimated rent
- $1,846 high interval (Pro) →
- Mortgage (P&I)
- −$346
- Tax from tax record
- −$210 /mo · $2,522/yr
- Insurance
- −$28
- Flood insurance flood zone
- −$427 /mo · $5,118/yr
- HOA
- −$0
- Vacancy / Maint / Mgmt
- −$388
- Net cashflow
- $448
Break-even live
UW: 25.0% down · 7.5% · 30yr · 1.5% tax · 5.0% vac · 8.0% maint · 8.0% mgmt
Financing live
Cash to close
- Down payment
- $16,500
- Closing costs
- $1,980
- Reserves months
- —
- Total cash needed
- —
Loan-product check · same deal, 3 products live
Conventional
25% down · 7.5% · 30yr
- Down + closing
- —
- Monthly P&I
- —
- Monthly cashflow
- —
- DSCR
- —
- Eligible?
- —
Personal DTI + credit; lowest rate.
DSCR
20% down · 8.5% · 30yr
- Down + closing
- —
- Monthly P&I
- —
- Monthly cashflow
- —
- DSCR
- —
- Eligible?
- —
No personal income docs; deal must DSCR.
Hard money
10% down · 12.0% · 12mo
- Down + closing
- —
- Monthly P&I
- —
- Monthly cashflow
- —
- DSCR
- —
- Eligible?
- —
Short-term bridge; refi at stabilization.
Rent comps 8 comps
| Address | Beds | Baths | Sqft | Rent | $/sqft | DOM | Units | Dist |
|---|---|---|---|---|---|---|---|---|
| 1837 Horne Rd Corpus Christi, TX | 3.0 | 2.0 | 1226 | $1,800 | $1.47 | 44d | 1 | 0.36mi |
| 2041 Harvard St Corpus Christi, TX | 3.0 | 2.0 | 1230 | $1,400 | $1.14 | 13d | 1 | 0.48mi |
| 1618 Birch Pl Corpus Christi, TX | 3.0 | 1.0 | 1558 | $1,500 | $0.96 | 13d | 1 | 0.54mi |
| 1070 Golden Gate Cir Corpus Christi, TX | 3.0 | 2.0 | 1644 | $1,700 | $1.03 | 44d | 1 | 1.20mi |
| 225 Watson St Corpus Christi, TX | 3.0 | 1.0 | 1472 | $1,295 | $0.88 | 44d | 1 | 1.32mi |
| 1722 Trenton Dr Corpus Christi, TX | 4.0 | 2.0 | 1432 | $2,100 | $1.47 | 13d | 1 | 1.37mi |
| 4241 Green Grove Dr Corpus Christi, TX | 3.0 | 2.0 | 1345 | $1,700 | $1.26 | 44d | 1 | 1.45mi |
| 4005 Green Grove Dr Corpus Christi, TX | 3.0 | 2.0 | 1406 | $1,695 | $1.21 | 44d | 1 | 1.49mi |
Listing history 5 events
-
2026-06-18days on market $66,000 Active 4 DOM
-
2026-06-17days on market $66,000 Active 3 DOM
-
2026-06-16days on market $66,000 Active 2 DOM
-
2026-06-15remarks 512-char remark
-
2026-06-15$66,000 Active 1 DOM
ⓘ Source: listings_history table (triggers on properties + properties_extension) + one-shot
backfill from property_details.listing_events for pre-trigger history.
Tax reassessment forecast TX · Resets to sale price
- Current annual tax
- $2,522 · $210/mo
- Projected year-2 tax
- $2,522 · $210/mo
- Expected delta
- $0/yr ($0/mo · 0.0%)
ⓘ Screening estimate from a state-policy table — verify with the county assessor before closing.
Climate risk First Street
- Flood 6/10 Major FEMA zone AE · 68% chance over 30 yrs
- Wildfire 1/10 Low
- Heat 10/10 Extreme 5 d/yr ≥107°F today · 17 d/yr by 30 yrs out
- Wind 9/10 Extreme 99% chance of damaging wind over 30 yrs
- Air quality 1/10 Low 0 unhealthy d/yr today · 0 by 30 yrs out
Nearby sold comps map
Loading sold comps map…
Walkable amenities ~0.75 mi
Loading nearby amenities…
Taxation est. · year 1
- Rental income
- $22,146
- − Mortgage interest
- −$3,697
- − Property taxes
- −$2,522
- − Insurance
- −$5,448
- − Repairs & maintenance
- −$1,772
- − Management
- −$1,772
- − Depreciation
- −$1,920
- Taxable income
- $5,016
- Est. tax owed @ 24.0%
- −$1,204
- After-tax cash flow
- $4,168/yr
For passive investors: Depreciation is non-cash, so a rental often shows a tax loss while cash-flowing — sheltering income. Rental losses are passive: they offset passive income freely, and up to $25,000/yr can offset ordinary (W-2) income if you actively participate and your MAGI is under $100k (phasing out to $0 by $150k); unused losses carry forward. On sale, claimed depreciation is recaptured at up to 25%, and gains may owe capital-gains tax (a 1031 exchange can defer both). Figures are a year-1 estimate at your 24.0% rate — not tax advice; consult a CPA.
Schools (NCES district)
- District
- Corpus Christi ISD
- NCES district ID
- 4815270
- Math proficiency
- 31% ▼ -18.00%
- Reading proficiency
- 35% ▼ -7.00%
- Median HH income
- $45,672
- Composite
- 28.27/100
- National rank
- #6793
- State rank
- #562 of 826 in TX
Livability — Corpus Christi
- Score
- 78/100
- State rank
- #66
- US rank
- #2404
Category grades
Schools grade is shown separately in the Schools card above.
Census & demographics
- Census place
- Corpus Christi, TX
- County
- Nueces County · 296,836 people
- City population
- 296,836
- Metro
- Corpus Christi, TX
- Population (ZIP)
- 12,480
- Household income
- $43,198
- Rent vs Own
- Severe rent burden
- 386.0
Population outlook (Nueces County) Hauer SSP2
- Today (2025)
- 418,037 people
- By 2030
- 447,123 · +7.0%
- By 2040
- 505,911 · +21.0%
- By 2050
- 567,522 · +35.8%
- By 2075
- 729,686 · +74.6%
- By 2100
- 847,087 · +102.6%
Race, ethnicity, and origin ACS 2023
- Neighborhood character
- Predominantly Hispanic (79%)
- Race & ethnicity
- Hispanic / Latino 79% Two or more races 38% Black 16% White 4%
- Hispanic origin (detail)
- Mexican 72%
- Foreign-born
- 12% · Canada
- Languages at home
- 50% English-only · Spanish 49%
Political lean MEDSL · Nueces
- 2024 margin
- R (+11.5) · D 43.8% · R 55.3%
- 2008→2024 swing
- -7.1pp toward R · 2008: -4.4pp · 2024: -11.5pp
- All cycles
- 2024: R+11.5 2020: R+2.9 2016: R+1.5 2012: R+3.2 2008: R+4.4
Not yet ingested
- Civics
- —
Market trends
- HPI YoY
- ▲ 4.38%
- Current HPI
- 139.6557
- Rent YoY
- —
- Metro
- Corpus Christi, TX
- State GDP YoY
- ▲ 3.95%
- F500 in state
- 110
Industry mix (Fortune 500 HQ in TX)
| Industry | F500 HQs | Revenue |
|---|---|---|
| Energy | 16 | $1,198B |
|
||
| Technology | 5 | $198B |
|
||
| Engineering / Construction | 4 | $72B |
|
||
| Energy Services | 3 | $60B |
|
||
| Utilities | 3 | $41B |
|
||
| Healthcare | 2 | $330B |
|
||
Price history
1 event — show timeline
- 2026-06-10 Listed $66,000 CBMLS
Property tax history
+3.2%/yrLatest (2025): $2,522 · +12.0% YoY. Source: county tax records.
Cash-flow waterfall
monthlySold comps — $/sqft
last 12 mo · ≤1 miLoading sold comps…