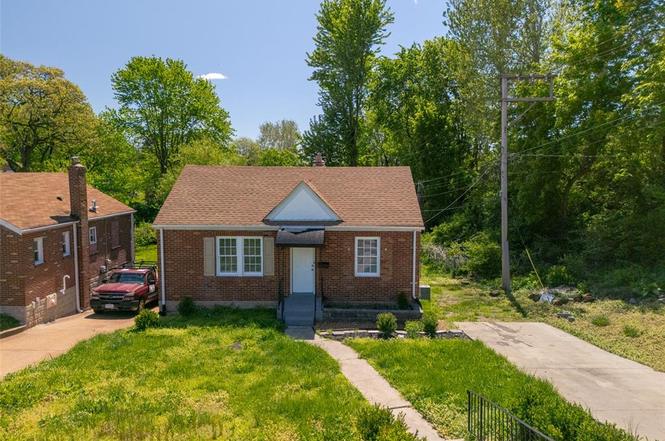
8320 Lucas And Hunt Rd · Jennings, MO
Flood risk 6/10 · Moderate
- FEMA flood zone
- X (unshaded)
- Chance of flooding over 30 yrs
- 0.69%
- Est. flood insurance / yr
- $473 – $860
Fire risk 1/10 · Minimal
- Est. fire insurance / yr
- $1,054 – $1,958
Heat risk 5/10 · Moderate
- Hot days now (above 107°F)
- 7 days/yr
- Hot days in 30 yrs
- 21 days/yr
Wind risk 2/10 · Minimal
- Chance of severe wind over 30 yrs
- 1.0%
Air-quality risk 4/10 · Minor
- Unhealthy air days now
- 4 days/yr
- Unhealthy air days in 30 yrs
- 5 days/yr
Risk factors via First Street. Map © Google.
Why this score? — see what drove the C+ grade
The composite is a weighted blend of 9 inputs, each scored 0–100. Each bar is that input's sub-score; the figure is the points it added to the 100-point composite (weight × sub-score).
- Cash flow +25.0/30.0
- DSCR +8.1/10.0
- ARV discount +7.5/15.0
- Appreciation +6.9/10.0
- 1% rule +5.7/10.0
- Rent growth +3.7/5.0
- Livability +3.4/5.0
- Condition / age +2.5/5.0
- Schools +1.1/10.0
$99,999
🖨 Deal sheet 📄 Offer letter ✓ Due diligence
Listing remarks MLS
Investor Special – Great Addition to Your Portfolio! This 3-bedroom, 1-bath home offers 720 square feet of living space and is being sold as-is. Featuring a newer roof, updated electrical, plumbing, furnace, and water heater, the major systems are already in place—just bring a little TLC to unlock its full potential. Ideal for investors seeking a solid rental property or a light renovation project, this home presents an excellent opportunity to add value with minimal upfront improvements. Whether you’re expanding your portfolio or looking for your next investment, this property checks the boxes. Sold AS-IS. Seller to make no repairs.
Key facts
- Fresh paint
- Brand new lighting
- Brand new cabinets
Tags
Property features AI
Finance
- Other: Living area reported as 720 (above-grade finished area per public records)
- Financial info: Annual taxes noted (details available in listing)
Exterior
- Utilities: Public water; Public sewer; Electric service by Ameren; Cable available; Natural gas connected; Electricity connected; Sewer connected; Water connected
- Home design: Single-family residence; One-story
- Construction: Aluminum siding, asbestos, and brick exterior materials; Block foundation
- Exterior features: Corner lot; Adjoins common ground; Panel doors
Interior
- Bedrooms: 3 bedrooms on the main level
- Bathrooms: 1 full bathroom on the main level
- Heating & cooling: Forced air heating; Central air conditioning
- Interior features: Main-level layout; 6 total rooms; Block basement
Neighborhood map
What this means for you Summary
Snapshot
- This is a 2-bed/1.0-bath single-family listed at $100k.
Deal economics
- At list price, monthly cash flow is $217 ($3k/yr) — positive.
- The deal already cash-flows at list — no discount required.
- Meets the 1% rule at list price ($1k rent vs $100k).
- Recommended offer: $94k (6.0% below list) — sets the bar for market timing.
- Cap rate 8.9% vs local median 12.2% in Jennings — below-typical yield; the buyer is paying a premium for something (appreciation thesis, condition, location) that the cap rate doesn't capture.
Location & tenants
- Location reads 67/100 on livability (#208 in MO) — a middle-class / working-renter tenant base. Strengths: cost of living A+, commute A-, housing A-; Watch: crime F, amenities F, employment F.
- Jennings (suburban): math 8% / reading 20% proficiency, ranked #315 of 324 in MO (top 97%) — low school quality limits family demand, transient renter base, plan for 1-2y turnover; 86% free/reduced lunch — lower-income household profile, screen leases tightly.
- Zoned schools: Woodland Elem. (math 5% / reading 15%, grade F, #1,027 of 1,115 statewide, top 93%, 256 students, 100% FRL); Jennings High (math 8% / reading 17%, grade F, #497 of 521 statewide, top 96%, 691 students, 100% FRL).
- Market conditions: Rents rising fast (+5.0%/yr); 372 active listings in the ZIP; 12 comparable units currently listed for rent nearby; rentals at typical pace (median 24d on market — plan ~3-4 weeks tenant-placement turnaround); 42% of comp listings sitting > 30 days — soft ceiling on asking rent; lower-income renter base — watch delinquency; 920 units permitted in St. Louis County in 2024 (250 in 5+ unit buildings).
Forward outlook
- In year one you build about $4k of equity ($691 loan paydown + $4k appreciation (3.8% local appreciation)).
- At projected returns (3.8% appreciation + 5.0% rent growth), your $28k cash investment doubles in ~4 years — after that, you're playing with house money.
- By year 8, paydown + projected appreciation supports a ~$33k cash-out refi (75% LTV) — recoverable capital for the next deal without selling this one.
Negotiation context
- It's been on market 86 days — a 6% lower offer ($94k) is reasonable based on typical stale-listing flexibility.
- 5 sale attempts since 4y ago with the ask held roughly flat each time — persistent listings suggest the price (not the market) is what's stuck; bring a comps-based counter.
- Current owner paid $21k; list at $100k implies a 376% gain — meaningful room to come down on a strong offer.
Risks & watch-outs
- Watch-outs: built in 1941 — expect roof / HVAC / electrical / plumbing capex.
- Climate carrying-cost: major flood risk; extreme-heat days projected 7→21/yr by 2055 (HVAC capex compounding) — expect insurance premiums to compound above CPI over the hold.
Questions for the listing agent
- It's been on market 86 days. Have you received any prior offers? Is the seller open to a 6% concession, seller financing, or rate buy-down credit?
- Built in 1941 — when were the roof, HVAC, electrical panel, plumbing, and water heater last replaced?
- Why hasn't it sold? Are there any deal-killer items the seller is aware of (foundation, flood, title, zoning, code violations)?
- Is there a deadline driving the sale (1031 exchange, divorce, estate, relocation)? That informs how much negotiation room exists.
- Schools are D-rated, which usually means shorter tenancies and higher turnover. Who's the typical renter profile here, and what's been the actual vacancy rate?
- Crime grade is F in this area — have there been break-ins, vandalism, or insurance claims at this property in the last 3 years? What carrier currently insures it and at what premium?
- What's the average days-on-market for RENTAL listings here right now (not sales)? A rising rental-DOM trend means longer vacancies and softer asking-rent achievability than the comps imply.
- What's the recent tenant-quality profile in this submarket — average credit score on applications, eviction rate, late-payment / NSF rate, and stable-employment percentage? A property-management company in the area should have these aggregated.
- How much new for-sale + rental construction is in the pipeline within 1–3 miles? Heavy new supply typically softens prices + rents 12–24 months out; constrained supply supports both.
Investment metrics
- 1% rule
- 1.07% ✓
- Cap rate
- 8.89%
- Cash-on-cash
- 9.28%
- DSCR
- 1.41
- GRM
- 7.8
CMA / ARV
- ARV (on-the-fly)
- $62,640
- Comps found
- 12
Show comp detail 12 sales within ~0.75 mi
| Address | Dist | Beds/Ba | Sqft | Sold | Price | $/sf | Match |
|---|---|---|---|---|---|---|---|
| 8320 Lucas And Hunt Rd | 0.00mi | 2/2.0 | 720 (0%) | 5mo | $60,000 | $83 | 92 |
| 7521 Chandler Ave | 0.11mi | 2/1.0 | 772 (+7%) | 6mo | $76,400 | $99 | 77 |
| 8339 Eton Pl | 0.59mi | 2/1.0 | 750 (+4%) | 3mo | $22,500 | $30 | 63 |
| 7446 Calvin Ave | 0.25mi | 2/1.5 | 650 (-10%) | 11mo | $45,000 | $69 | 61 |
| 2604 Avie Dr | 0.26mi | 2/1.0 | 825 (+15%) | 3mo | $99,900 | $121 | 61 |
| 8340 Eton Pl | 0.61mi | 2/1.0 | 750 (+4%) | 8mo | $50,000 | $67 | 58 |
| 5613 Statler Ave | 0.36mi | 2/1.0 | 792 (+10%) | 11mo | $62,400 | $79 | 58 |
| 7439 Embury Ct | 0.58mi | 2/1.0 | 792 (+10%) | 2mo | $69,000 | $87 | 55 |
| 8324 Strathmore Pl | 0.71mi | 2/1.0 | 750 (+4%) | 10mo | $80,000 | $107 | 52 |
| 8352 Strathmore Pl | 0.71mi | 2/1.0 | 750 (+4%) | 12mo | $70,000 | $93 | 50 |
| 7431 Esterbrook Dr | 0.63mi | 3/1.0 (+1) | 792 (+10%) | 2mo | $110,000 | $139 | 48 |
| 2508 Ada Ave | 0.52mi | 2/1.0 | 816 (+13%) | 12mo | $23,900 | $29 | 44 |
Match score weights: distance 35% · size 25% · config 20% · recency 20%. Top-matched comps best support the ARV.
Projected returns pro-forma
3.79% appreciation · 4.97% rent growth · sell at horizon
- IRR
- 19.2%
- Equity multiple
- 2.15×
- Total profit
- $32,225
- Equity at exit
- $49,478
- IRR
- 20.7%
- Equity multiple
- 4.35×
- Total profit
- $93,713
- Equity at exit
- $79,965
Cash invested: $28,000 (down + closing). Projections, not guarantees.
Landlord ↔ Tenant lean methodology
- Overall (STATE)
- 81 Strongly Landlord-Friendly
- State Missouri
- 81 Strongly Landlord-Friendly · R+10
- County
- — inherits STATE
- City
- — inherits STATE
ZIP-level market 63136
- Home prices YoY
- 0.9%
- Rents YoY
- 5.0%
- Active inventory
- 372
- Price-to-rent
- 7.8×
Monthly cashflow live
- Estimated rent
- $1,069 high interval (Pro) →
- Mortgage (P&I)
- −$524
- Tax from tax record
- −$62 /mo · $746/yr
- Insurance
- −$42
- HOA
- −$0
- Vacancy / Maint / Mgmt
- −$225
- Net cashflow
- $217
Break-even live
UW: 25.0% down · 7.5% · 30yr · 1.5% tax · 5.0% vac · 8.0% maint · 8.0% mgmt
Financing live
Cash to close
- Down payment
- $25,000
- Closing costs
- $3,000
- Reserves months
- —
- Total cash needed
- —
Loan-product check · same deal, 3 products live
Conventional
25% down · 7.5% · 30yr
- Down + closing
- —
- Monthly P&I
- —
- Monthly cashflow
- —
- DSCR
- —
- Eligible?
- —
Personal DTI + credit; lowest rate.
DSCR
20% down · 8.5% · 30yr
- Down + closing
- —
- Monthly P&I
- —
- Monthly cashflow
- —
- DSCR
- —
- Eligible?
- —
No personal income docs; deal must DSCR.
Hard money
10% down · 12.0% · 12mo
- Down + closing
- —
- Monthly P&I
- —
- Monthly cashflow
- —
- DSCR
- —
- Eligible?
- —
Short-term bridge; refi at stabilization.
Rent comps 12 comps
| Address | Beds | Baths | Sqft | Rent | $/sqft | DOM | Units | Dist |
|---|---|---|---|---|---|---|---|---|
| 7516 Chandler Ave Saint Louis, MO | 1.0 | 1.0 | 728 | $1,000 | $1.37 | 43d | 1 | 0.17mi |
| 5600 Gatesworth Ave Saint Louis, MO | 2.0 | 1.0 | 672 | $1,095 | $1.63 | 4d | 1 | 0.40mi |
| 8347 Eton Pl Saint Louis, MO | 2.0 | 1.0 | 750 | $1,075 | $1.43 | 43d | 1 | 0.60mi |
| 8344 Eton Pl Saint Louis, MO | 2.0 | 1.0 | 750 | $895 | $1.19 | 3d | 1 | 0.62mi |
| 3 Pohlman Ln Saint Louis, MO | 2.0 | 1.0 | 704 | $1,000 | $1.42 | 16d | 1 | 0.70mi |
| 7142 Lamont Dr Saint Louis, MO | 2.0 | 1.0 | 750 | $1,100 | $1.47 | 17d | 1 | 0.71mi |
| 8893 Maya Ln Jennings, MO | 1.0–2.0 | 1.0 | 600 | $930 | $1.55 | 23d | 6 | 0.98mi |
| 1550 Northwinds Estates Dr St. Louis, MO | 1.0–2.0 | 1.0–1.5 | 877 | $1,050 | $1.20 | 43d | 1 | 0.98mi |
| 5635 Hodiamont Ave Saint Louis, MO | 2.0 | 1.0 | 580 | $899 | $1.55 | 20d | 1 | 1.15mi |
| 7024 Idlewild Ave Saint Louis, MO | 2.0 | 1.0 | 588 | $995 | $1.69 | 43d | 1 | 1.15mi |
| 6180 Emerald Ave Saint Louis, MO | 2.0 | 1.0 | 729 | $1,300 | $1.78 | 43d | 1 | 1.16mi |
| 7733 Brand Ave Saint Louis, MO | 2.0 | 1.0 | 656 | $1,090 | $1.66 | 23d | 1 | 1.22mi |
Listing history 32 events
-
2026-06-18days on market $99,999 Active 86 DOM
-
2026-06-17days on market $99,999 Active 85 DOM
-
2026-06-16days on market $99,999 Active 84 DOM
-
2026-06-15days on market $99,999 Active 83 DOM
-
2026-06-13pricedays on market $99,999 Active 81 DOM
-
2026-06-09days on market $105,000 Active 77 DOM
-
2026-06-08days on market $105,000 Active 76 DOM
-
2026-06-07days on market $105,000 Active 75 DOM
-
2026-06-03days on market $105,000 Active 71 DOM
-
2026-06-02days on market $105,000 Active 70 DOM
-
2026-06-01days on market $105,000 Active 69 DOM
-
2026-05-31days on market $105,000 Active 68 DOM
-
2026-05-28status Active
-
2026-05-28price $105,000
-
2026-04-30historical Active Under Contract
-
2026-04-10price $99,900
-
2026-03-12$105,000 Active
-
2026-01-30soldstatus Closed 659-char remark
Show marketing remark (659 chars)
Investor Special – Great Addition to Your Portfolio! This 3-bedroom, 1-bath home offers 720 square feet of living space and is being sold as-is. Featuring a newer roof, updated electrical, plumbing, furnace, and water heater, the major systems are already in place—just bring a little TLC to unlock its full potential. Ideal for investors seeking a solid rental property or a light renovation project, this home presents an excellent opportunity to add value with minimal upfront improvements. Whether you’re expanding your portfolio or looking for your next investment, this property checks the boxes. Sold AS-IS. Seller to make no repairs.
-
2026-01-21status Pending 659-char remark
Show marketing remark (659 chars)
Investor Special – Great Addition to Your Portfolio! This 3-bedroom, 1-bath home offers 720 square feet of living space and is being sold as-is. Featuring a newer roof, updated electrical, plumbing, furnace, and water heater, the major systems are already in place—just bring a little TLC to unlock its full potential. Ideal for investors seeking a solid rental property or a light renovation project, this home presents an excellent opportunity to add value with minimal upfront improvements. Whether you’re expanding your portfolio or looking for your next investment, this property checks the boxes. Sold AS-IS. Seller to make no repairs.
-
2026-01-03$60,000 Active 659-char remark
Show marketing remark (659 chars)
Investor Special – Great Addition to Your Portfolio! This 3-bedroom, 1-bath home offers 720 square feet of living space and is being sold as-is. Featuring a newer roof, updated electrical, plumbing, furnace, and water heater, the major systems are already in place—just bring a little TLC to unlock its full potential. Ideal for investors seeking a solid rental property or a light renovation project, this home presents an excellent opportunity to add value with minimal upfront improvements. Whether you’re expanding your portfolio or looking for your next investment, this property checks the boxes. Sold AS-IS. Seller to make no repairs.
-
2022-07-22soldstatus $21,000
-
2022-07-18soldstatus Closed 28-char remark
Show marketing remark (28 chars)
Great investment opportunity
-
2022-07-08status Pending 28-char remark
Show marketing remark (28 chars)
Great investment opportunity
-
2022-06-24status Active 28-char remark
Show marketing remark (28 chars)
Great investment opportunity
-
2022-05-19historical Active Under Contract 28-char remark
Show marketing remark (28 chars)
Great investment opportunity
-
2022-05-14$24,900 Active 28-char remark
Show marketing remark (28 chars)
Great investment opportunity
-
2010-11-22soldstatus $6,000
-
1994-04-05soldstatus
-
1994-04-05soldstatus
-
1994-04-05soldstatus
-
1991-09-09soldstatus
-
1991-09-01soldstatus
ⓘ Source: listings_history table (triggers on properties + properties_extension) + one-shot
backfill from property_details.listing_events for pre-trigger history.
Tax reassessment forecast MO · Resets to sale price
- Current annual tax
- $746 · $62/mo
- Projected year-2 tax
- $970 · $81/mo
- Expected delta
- +$224/yr (+$19/mo · 30.0%)
ⓘ Screening estimate from a state-policy table — verify with the county assessor before closing.
Climate risk First Street
- Flood 6/10 Major FEMA zone X (unshaded) · 69% chance over 30 yrs
- Wildfire 1/10 Low
- Heat 5/10 Major 7 d/yr ≥107°F today · 21 d/yr by 30 yrs out
- Wind 2/10 Low 100% chance of damaging wind over 30 yrs
- Air quality 4/10 Moderate 4 unhealthy d/yr today · 5 by 30 yrs out
Nearby sold comps map
Loading sold comps map…
Walkable amenities ~0.75 mi
Loading nearby amenities…
Taxation est. · year 1
- Rental income
- $12,834
- − Mortgage interest
- −$5,601
- − Property taxes
- −$746
- − Insurance
- −$500
- − Repairs & maintenance
- −$1,027
- − Management
- −$1,027
- − Depreciation
- −$2,909
- Taxable income
- $1,023
- Est. tax owed @ 24.0%
- −$246
- After-tax cash flow
- $2,354/yr
For passive investors: Depreciation is non-cash, so a rental often shows a tax loss while cash-flowing — sheltering income. Rental losses are passive: they offset passive income freely, and up to $25,000/yr can offset ordinary (W-2) income if you actively participate and your MAGI is under $100k (phasing out to $0 by $150k); unused losses carry forward. On sale, claimed depreciation is recaptured at up to 25%, and gains may owe capital-gains tax (a 1031 exchange can defer both). Figures are a year-1 estimate at your 24.0% rate — not tax advice; consult a CPA.
Schools (NCES district)
- District
- Jennings
- NCES district ID
- 2916290
- Math proficiency
- 8% ▼ -16.00%
- Reading proficiency
- 20% ▼ -4.00%
- Median HH income
- $30,595
- Composite
- 11.04/100
- National rank
- #9739
- State rank
- #315 of 324 in MO
Livability — Jennings
- Score
- 67/100
- State rank
- #208
- US rank
- #10499
Category grades
Schools grade is shown separately in the Schools card above.
Census & demographics
- Census place
- Jennings, MO
- County
- Saint Louis County · 888,823 people
- Metro
- St. Louis, MO-IL
- Population (ZIP)
- 40,929
- Household income
- $41,154
- Rent vs Own
- Severe rent burden
- 3085.0
Population outlook (St. Louis County) Hauer SSP2
- Today (2025)
- 1,025,227 people
- By 2030
- 1,028,023 · +0.3%
- By 2040
- 1,020,940 · -0.4%
- By 2050
- 1,007,280 · -1.8%
- By 2075
- 987,277 · -3.7%
- By 2100
- 921,984 · -10.1%
Race, ethnicity, and origin ACS 2023
- Neighborhood character
- Predominantly Black (90%)
- Race & ethnicity
- Black 90% White 5% Two or more races 3%
- Foreign-born
- 1% · Canada
Political lean MEDSL · St. Louis
- 2024 margin
- Strong D (+23.4) · D 60.8% · R 37.4% · Other 1.7%
- 2008→2024 swing
- +3.5pp toward D · 2008: 19.9pp · 2024: 23.4pp
- All cycles
- 2024: D+23.4 2020: D+24.0 2016: D+16.2 2012: D+13.7 2008: D+19.9
Not yet ingested
- Civics
- —
Market trends
- HPI YoY
- ▲ 3.79%
- Current HPI
- 420.28
- Rent YoY
- ▲ 4.97%
- Metro
- St. Louis, MO-IL
- State GDP YoY
- ▲ 1.84%
- F500 in state
- 20
Industry mix (Fortune 500 HQ in MO)
| Industry | F500 HQs | Revenue |
|---|---|---|
| Healthcare | 1 | $163B |
|
||
| Insurance | 1 | $21B |
|
||
| Industrial Technology | 1 | $17B |
|
||
| Retail | 1 | $16B |
|
||
| Industrial Distribution | 1 | $10B |
|
||
| Utilities | 1 | $9B |
|
||
Price history
+1650.0% since first listed20 events — show timeline
- 2026-05-28 Relisted — MARIS as Distributed by MLS Grid
- 2026-05-28 Price Changed $105,000 MARIS as Distributed by MLS Grid
- 2026-04-30 Contingent — MARIS as Distributed by MLS Grid
- 2026-04-10 Price Changed $99,900 MARIS as Distributed by MLS Grid
- 2026-03-12 Listed $105,000 MARIS as Distributed by MLS Grid
- 2026-01-30 Sold (MLS) — MARIS as Distributed by MLS Grid
- 2026-01-21 Pending — MARIS as Distributed by MLS Grid
- 2026-01-03 Listed $60,000 MARIS as Distributed by MLS Grid
- 2022-07-22 Sold (Public Records) $21,000 Public Records
- 2022-07-18 Sold (MLS) — MARIS as Distributed by MLS Grid
- 2022-07-08 Pending — MARIS as Distributed by MLS Grid
- 2022-06-24 Relisted — MARIS as Distributed by MLS Grid
- 2022-05-19 Contingent — MARIS as Distributed by MLS Grid
- 2022-05-14 Listed $24,900 MARIS as Distributed by MLS Grid
- 2010-11-22 Sold (Public Records) $6,000 Public Records
- 1994-04-05 Sold (Public Records) — Public Records
- 1994-04-05 Sold (Public Records) — Public Records
- 1994-04-05 Sold (Public Records) — Public Records
- 1991-09-09 Sold (Public Records) — Public Records
- 1991-09-01 Sold (Public Records) — Public Records
Property tax history
-5.8%/yrLatest (2022): $746 · +1.5% YoY. Source: county tax records.
Cash-flow waterfall
monthlySold comps — $/sqft
last 12 mo · ≤1 miLoading sold comps…