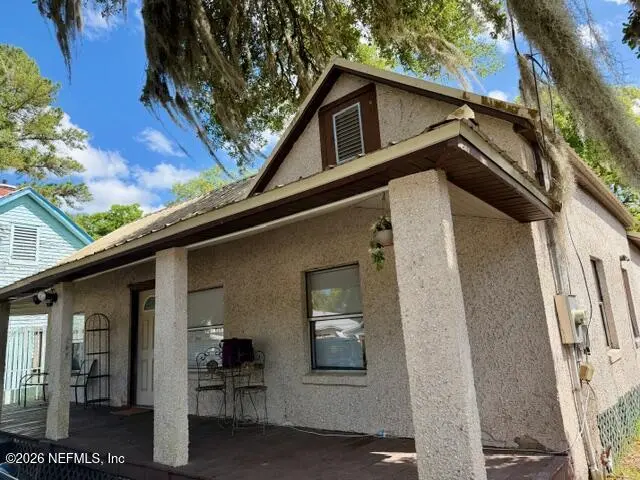
1319 Carr St · Palatka, FL
Flood risk 6/10 · Moderate
- FEMA flood zone
- X (unshaded)
- Chance of flooding over 30 yrs
- 0.74%
- Est. flood insurance / yr
- $507 – $1,088
Fire risk 4/10 · Minor
- Est. fire insurance / yr
- $947 – $1,759
Heat risk 9/10 · Severe
- Hot days now (above 108°F)
- 7 days/yr
- Hot days in 30 yrs
- 20 days/yr
Wind risk 9/10 · Severe
- Chance of severe wind over 30 yrs
- 99.0%
Air-quality risk 2/10 · Minimal
- Unhealthy air days now
- 2 days/yr
- Unhealthy air days in 30 yrs
- 2 days/yr
Risk factors via First Street. Map © Google.
Why this score? — see what drove the B- grade
The composite is a weighted blend of 9 inputs, each scored 0–100. Each bar is that input's sub-score; the figure is the points it added to the 100-point composite (weight × sub-score).
- Cash flow +30.0/30.0
- 1% rule +10.0/10.0
- DSCR +10.0/10.0
- ARV discount +7.5/15.0
- Rent growth +3.1/5.0
- Schools +3.0/10.0
- Livability +2.9/5.0
- Condition / age +2.5/5.0
- Appreciation +0.0/10.0
$75,900
🖨 Deal sheet (PDF) 📄 Offer letter ✓ Due diligence
Listing remarks MLS
Great investment. Currently rented. Needs repairs. Sold as is. House next door also available.
Key facts
- 5,227 sq ft lot
- Built 1920
- Listed 2 days
Property features AI
Finance
- HOA & community: Sidewalks in the community; Not a senior community
Exterior
- Parking: On-street parking; Additional parking available
- Security: Smoke detectors installed
- Utilities: 100 amp electric service; Public sewer; Cable available and connected; Electricity available and connected; Natural gas available and connected; Sewer available and connected; Water available and connected
- Home design: Single family residence; One story; Entry level: 1; North-facing; Property is attached
- Construction: Frame construction; Other construction materials
- Exterior features: Front porch; Covered porch; Chain link and wood backyard fencing; Some trees on the lot; Metal roof
Interior
- Kitchen: Electric water heater
- Bedrooms: 4 bedrooms
- Flooring: Vinyl flooring; Wood flooring
- Bathrooms: 2 full bathrooms
- Heating & cooling: Central heating (electric); Central air; Wall/window air conditioning units
- Interior features: Eat-in kitchen; Primary bedroom located on the ground floor
- Laundry & utility: In-unit laundry hookups with electric dryer hookup and washer hookup; Laundry located on lower level
Neighborhood map
What this means for you Summary
Snapshot
- This is a 2-bed/2.0-bath single-family listed at $76k.
Deal economics
- At list price, monthly cash flow is $507 ($6k/yr) — positive.
- The deal already cash-flows at list — no discount required.
- Meets the 1% rule at list price ($1k rent vs $76k).
- Cap rate 14.3% vs local median 3.8% in Palatka — top-decile yield for the area; either an underpriced asset or a hidden risk that comps aren't pricing in. Stress-test before assuming the spread holds.
Location & tenants
- Location reads 58/100 on livability (#839 in FL) — a working-class tenant base; expect higher turnover. Strengths: cost of living A+, housing B+; Watch: health & safety C-, crime D, amenities F.
- Putnam (town): math 34% / reading 39% proficiency, ranked #66 of 73 in FL (top 90%) — families likely to look elsewhere, expect single-tenant / working-renter base with shorter leases; 71% free/reduced lunch — lower-income household profile, screen leases tightly.
- Zoned schools: Palatka Jr - Sr High School (math 13% / reading 30%, grade F, #546 of 667 statewide, top 82%, 1,639 students, 64% FRL).
- Zoned-school proficiency averages 22% at this address vs 36% district-wide (-15 pts) — the specific schools serving this property underperform the Putnam average; the district grade overstates school quality for this exact location.
- Market conditions: Rents rising (+2.2%/yr); 319 active listings in the ZIP; 7 comparable units currently listed for rent nearby; rentals at typical pace (median 25d on market — plan ~3-4 weeks tenant-placement turnaround); 113 units permitted in Putnam County in 2024 (0 in 5+ unit buildings).
Forward outlook
- Local home prices are declining (-3.0%/yr); year-one equity from $525 of loan paydown is wiped out by about $2k of value loss. Plan a longer hold.
- Putnam County population projected at -31% by 2050 — secular population decline; favor cash flow + early exit over multi-decade hold.
- At projected returns (-3.0% appreciation + 2.2% rent growth), your $21k cash investment doubles in ~5 years — after that, you're playing with house money.
Negotiation context
- Only 2 days on market — expect competitive offers; lowballing is unlikely to land.
- 2 sale attempts since 21y ago with the ask held roughly flat each time — persistent listings suggest the price (not the market) is what's stuck; bring a comps-based counter.
- Current owner paid $50k; list at $76k implies a 52% gain — meaningful room to come down on a strong offer.
Risks & watch-outs
- Watch-outs: property tax is 3.4% of price; built in 1920 — expect roof / HVAC / electrical / plumbing capex.
- Climate carrying-cost: major flood risk; severe wind risk, 99% chance of damaging wind over 30y; extreme-heat days projected 7→20/yr by 2055 (HVAC capex compounding) — expect insurance premiums to compound above CPI over the hold.
Questions for the listing agent
- Built in 1920 — when were the roof, HVAC, electrical panel, plumbing, and water heater last replaced?
- Property tax is high relative to price — has the assessment been appealed recently, and will the sale trigger a re-assessment?
- Is there a deadline driving the sale (1031 exchange, divorce, estate, relocation)? That informs how much negotiation room exists.
- Crime grade is D in this area — have there been break-ins, vandalism, or insurance claims at this property in the last 3 years? What carrier currently insures it and at what premium?
- What's the average days-on-market for RENTAL listings here right now (not sales)? A rising rental-DOM trend means longer vacancies and softer asking-rent achievability than the comps imply.
- What's the recent tenant-quality profile in this submarket — average credit score on applications, eviction rate, late-payment / NSF rate, and stable-employment percentage? A property-management company in the area should have these aggregated.
- How much new for-sale + rental construction is in the pipeline within 1–3 miles? Heavy new supply typically softens prices + rents 12–24 months out; constrained supply supports both.
Investment metrics
- 1% rule
- 1.92% ✓
- Cap rate
- 14.31%
- Cash-on-cash
- 28.63%
- DSCR
- 2.27
- GRM
- 4.3
CMA / ARV
- ARV (on-the-fly)
- $171,513
- Comps found
- 12
Show comp detail 12 sales within ~0.75 mi
| Address | Dist | Beds/Ba | Sqft | Sold | Price | $/sf | Match |
|---|---|---|---|---|---|---|---|
| 1510 Laurel St | 0.15mi | 3/1.0 (+1) | 1,080 (-4%) | 4mo | $165,000 | $153 | 75 |
| 1304 President St | 0.19mi | 3/1.0 (+1) | 1,068 (-5%) | 1mo | $175,000 | $164 | 73 |
| 2121 Oak St | 0.51mi | 2/1.0 | 1,110 (-1%) | 3mo | $45,000 | $41 | 68 |
| 2207 Laurel St | 0.53mi | 2/1.0 | 1,107 (-1%) | 4mo | $200,000 | $181 | 66 |
| 220 S 14th St | 0.10mi | 3/2.0 (+1) | 988 (-12%) | 7mo | $125,000 | $127 | 65 |
| 805 S 15th St | 0.29mi | 3/1.0 (+1) | 1,054 (-6%) | 6mo | $175,000 | $166 | 63 |
| 1510 President St | 0.26mi | 3/1.0 (+1) | 1,036 (-8%) | 6mo | $101,793 | $98 | 62 |
| 2404 Crill Ave | 0.65mi | 2/1.5 | 1,193 (+6%) | 3mo | $154,900 | $130 | 55 |
| 2209 Gillis | 0.55mi | 3/2.0 (+1) | 1,232 (+10%) | 7mo | $205,000 | $166 | 47 |
| 1001 Cleveland Ave | 0.56mi | 3/1.0 (+1) | 980 (-13%) | 2mo | $125,000 | $128 | 42 |
| 2213 Gillis St | 0.58mi | 2/1.0 | 952 (-15%) | 7mo | $79,000 | $83 | 38 |
| 709 N 11th St | 0.71mi | 3/1.0 (+1) | 1,000 (-11%) | 3mo | $156,500 | $157 | 37 |
Match score weights: distance 35% · size 25% · config 20% · recency 20%. Top-matched comps best support the ARV.
Projected returns pro-forma
-3.0% appreciation · 2.23% rent growth · sell at horizon
- IRR
- 22.0%
- Equity multiple
- 1.89×
- Total profit
- $18,972
- Equity at exit
- $11,317
- IRR
- 29.6%
- Equity multiple
- 3.54×
- Total profit
- $53,971
- Equity at exit
- $6,562
Cash invested: $21,252 (down + closing). Projections, not guarantees.
Landlord ↔ Tenant lean methodology
- Overall (STATE)
- 87 Strongly Landlord-Friendly
- State Florida
- 87 Strongly Landlord-Friendly · R+3
- County
- — inherits STATE
- City
- — inherits STATE
ZIP-level market 32177
- Home prices YoY
- -28.1%
- Rents YoY
- 2.2%
- Active inventory
- 319
- Price-to-rent
- 4.3×
Monthly cashflow live
- Estimated rent
- $1,455 high interval (Pro) →
- Mortgage (P&I)
- −$398
- Tax from tax record
- −$213 /mo · $2,552/yr
- Insurance
- −$32
- HOA
- −$0
- Vacancy / Maint / Mgmt
- −$306
- Net cashflow
- $507
Break-even live
Sensitivity live
| Price | -10% $550 | -5% $529 | +0% $507 | +5% $486 | +10% $464 |
|---|---|---|---|---|---|
| Rent | -10% $392 | -5% $450 | +0% $507 | +5% $565 | +10% $622 |
| Rate | -1.0pp $545 | -0.5pp $526 | base $507 | +0.5pp $487 | +1.0pp $467 |
UW: 25.0% down · 7.5% · 30yr · 1.5% tax · 5.0% vac · 8.0% maint · 8.0% mgmt
Financing live
Cash to close
- Down payment
- $18,975
- Closing costs
- $2,277
- Reserves months
- —
- Total cash needed
- —
Loan-product check · same deal, 3 products live
Conventional
25% down · 7.5% · 30yr
- Down + closing
- —
- Monthly P&I
- —
- Monthly cashflow
- —
- DSCR
- —
- Eligible?
- —
Personal DTI + credit; lowest rate.
DSCR
20% down · 8.5% · 30yr
- Down + closing
- —
- Monthly P&I
- —
- Monthly cashflow
- —
- DSCR
- —
- Eligible?
- —
No personal income docs; deal must DSCR.
Hard money
10% down · 12.0% · 12mo
- Down + closing
- —
- Monthly P&I
- —
- Monthly cashflow
- —
- DSCR
- —
- Eligible?
- —
Short-term bridge; refi at stabilization.
Rent comps 7 comps
| Address | Beds | Baths | Sqft | Rent | $/sqft | DOM | Units | Dist |
|---|---|---|---|---|---|---|---|---|
| 1510 Laurel St Palatka, FL | 3.0 | 1.0 | 1080 | $1,659 | $1.54 | 5d | 1 | 0.15mi |
| 1010 Bronson St Apt 12 Palatka, FL | 2.0 | 1.0 | 700 | $1,095 | $1.56 | 5d | 1 | 0.65mi |
| 2113 Silver Lake Dr Palatka, FL | 2.0 | 1.0 | 988 | $1,500 | $1.52 | 24d | 1 | 0.73mi |
| 716 Bronson St Palatka, FL | 3.0 | 1.0 | 900 | $1,175 | $1.31 | 24d | 1 | 0.74mi |
| 105 N 2nd St Palatka, FL | 2.0 | 2.0 | 924 | $1,650 | $1.79 | 24d | 1 | 0.86mi |
| 1510 Cleveland Ave Palatka, FL | 2.0 | 1.0 | 916 | $1,350 | $1.47 | 24d | 1 | 0.90mi |
| 1511 S Palm Ave Unit 4 Palatka, FL | 3.0 | 1.0 | 1224 | $1,250 | $1.02 | 24d | 1 | 1.21mi |
Listing history 6 events
-
2026-05-01status Pending
-
2026-04-27$75,900 Active
-
2005-05-27soldstatus $49,900 98-char remark
Show marketing remark (98 chars)
Great investment. Currently rented. Needs repairs. Sold as is. House next door also available.
-
2005-02-05$49,900 98-char remark
Show marketing remark (98 chars)
Great investment. Currently rented. Needs repairs. Sold as is. House next door also available.
-
1991-12-01soldstatus $43,600
-
1981-10-01soldstatus $21,400
ⓘ Source: listings_history table (triggers on properties + properties_extension) + one-shot
backfill from property_details.listing_events for pre-trigger history.
Tax reassessment forecast FL · Resets to sale price
- Current annual tax
- $2,552 · $213/mo
- Projected year-2 tax
- $2,552 · $213/mo
- Expected delta
- $0/yr ($0/mo · 0.0%)
ⓘ Screening estimate from a state-policy table — verify with the county assessor before closing.
Climate risk First Street
- Flood 6/10 Major FEMA zone X (unshaded) · 74% chance over 30 yrs
- Wildfire 4/10 Moderate
- Heat 9/10 Extreme 7 d/yr ≥108°F today · 20 d/yr by 30 yrs out
- Wind 9/10 Extreme 99% chance of damaging wind over 30 yrs
- Air quality 2/10 Low 2 unhealthy d/yr today · 2 by 30 yrs out
Nearby sold comps map
Loading sold comps map…
Walkable amenities ~0.75 mi
Loading nearby amenities…
Taxation est. · year 1
- Rental income
- $17,459
- − Mortgage interest
- −$4,252
- − Property taxes
- −$2,552
- − Insurance
- −$380
- − Repairs & maintenance
- −$1,397
- − Management
- −$1,397
- − Depreciation
- −$2,208
- Taxable income
- $5,275
- Est. tax owed @ 24.0%
- −$1,266
- After-tax cash flow
- $4,819/yr
For passive investors: Depreciation is non-cash, so a rental often shows a tax loss while cash-flowing — sheltering income. Rental losses are passive: they offset passive income freely, and up to $25,000/yr can offset ordinary (W-2) income if you actively participate and your MAGI is under $100k (phasing out to $0 by $150k); unused losses carry forward. On sale, claimed depreciation is recaptured at up to 25%, and gains may owe capital-gains tax (a 1031 exchange can defer both). Figures are a year-1 estimate at your 24.0% rate — not tax advice; consult a CPA.
Schools (NCES district)
- District
- Putnam
- NCES district ID
- 1201620
- Math proficiency
- 34% ▼ -10.00%
- Reading proficiency
- 39% ▼ -4.00%
- Median HH income
- $33,350
- Composite
- 29.99/100
- National rank
- #6361
- State rank
- #66 of 73 in FL
Livability — Palatka
- Score
- 58/100
- State rank
- #839
- US rank
- #20793
Category grades
Schools grade is shown separately in the Schools card above.
Census & demographics
- Census place
- Palatka, FL
- County
- Putnam County · 25,645 people
- City population
- 25,645
- Metro
- Palatka, FL
- Population (ZIP)
- 25,645
- Household income
- $47,796
- Rent vs Own
- Severe rent burden
- 806.0
Population outlook (Putnam County) Hauer SSP2
- Today (2025)
- 65,299 people
- By 2030
- 61,255 · -6.2%
- By 2040
- 52,930 · -18.9%
- By 2050
- 45,051 · -31.0%
- By 2075
- 28,720 · -56.0%
- By 2100
- 15,852 · -75.7%
Race, ethnicity, and origin ACS 2023
- Neighborhood character
- Majority White (62%)
- Race & ethnicity
- White 62% Black 28% Hispanic / Latino 7% Two or more races 5%
- Hispanic origin (detail)
- Mexican 2% Puerto Rican 3% Cuban 2%
- Common ancestry
- Lithuanian 2% Hispanic 1% Slovak 1%
- Foreign-born
- 3% · Canada
- Languages at home
- 94% English-only · Spanish 5% French/Haitian/Cajun 1%
Political lean MEDSL · Putnam
- 2024 margin
- Solid R (+47.8) · D 25.8% · R 73.6%
- 2008→2024 swing
- -28.5pp toward R · 2008: -19.3pp · 2024: -47.8pp
- All cycles
- 2024: R+47.8 2020: R+41.2 2016: R+36.6 2012: R+24.5 2008: R+19.3
Not yet ingested
- Civics
- —
Market trends
- HPI YoY
- ▼ -87.10%
- Current HPI
- 223.1966
- Rent YoY
- ▲ 2.23%
- Metro
- Palatka, FL
- State GDP YoY
- ▲ 3.28%
- F500 in state
- 36
Industry mix (Fortune 500 HQ in FL)
| Industry | F500 HQs | Revenue |
|---|---|---|
| Industrial Technology | 2 | $29B |
|
||
| Insurance | 2 | $17B |
|
||
| Retail | 1 | $60B |
|
||
| Technology Distribution | 1 | $58B |
|
||
| Homebuilding | 1 | $35B |
|
||
| Technology Manufacturing | 1 | $35B |
|
||
Price history
+254.7% since first listed6 events — show timeline
- 2026-05-01 Pending — realMLS
- 2026-04-27 Listed $75,900 realMLS
- 2005-05-27 Sold (MLS) $49,900 realMLS
- 2005-02-05 Listed $49,900 realMLS
- 1991-12-01 Sold (Public Records) $43,600 Public Records
- 1981-10-01 Sold (Public Records) $21,400 Public Records
Property tax history
+5.7%/yrLatest (2025): $2,552 · +5.5% YoY. Source: county tax records.
Cash-flow waterfall
monthlySold comps — $/sqft
last 12 mo · ≤1 miLoading sold comps…