 🏗️ New Construction
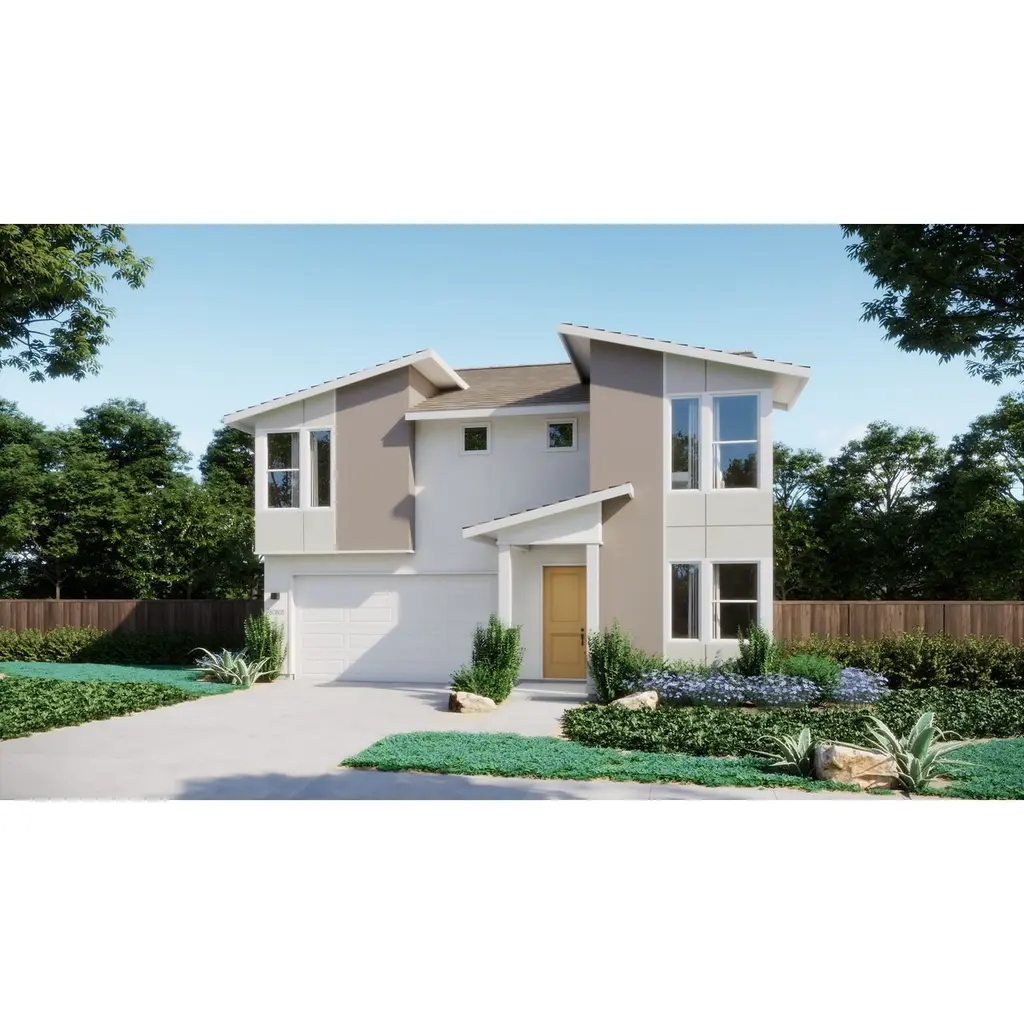
Residence 5 Plan · Rancho Cordova, CA
Flood risk No data
- FEMA flood zone
- —
- Chance of flooding over 30 yrs
- —
- Est. flood insurance / yr
- —
Fire risk No data
- Est. fire insurance / yr
- —
Heat risk No data
- Hot days now (above threshold)
- —
- Hot days in 30 yrs
- —
Wind risk No data
- Chance of severe wind over 30 yrs
- —
Air-quality risk No data
- Unhealthy air days now
- —
- Unhealthy air days in 30 yrs
- —
Risk factors via First Street. Map © Google.
Why this score? — see what drove the F grade
The composite is a weighted blend of 9 inputs, each scored 0–100. Each bar is that input's sub-score; the figure is the points it added to the 100-point composite (weight × sub-score).
- Appreciation +10.0/10.0
- ARV discount +7.5/15.0
- Schools +4.1/10.0
- Livability +3.4/5.0
- Rent growth +3.0/5.0
- Cash flow +2.6/30.0
- Condition / age +2.5/5.0
- 1% rule +0.0/10.0
- DSCR +0.0/10.0
$615,000
🖨 Deal sheet (PDF) 📄 Offer letter ✓ Due diligence
Listing remarks MLS
Residence Five: The most expansive plan in the collection at Park Haven, this home is ideal for growing families. . It includes options for a den, office, or fifth bedroom, along with an open-concept layout, walk-in closets in nearly every room, and a downstairs guest suite or bonus space. Enjoy the luxuries included in a Cresleigh Home such as hand set tiles in entry way, kitchen and wet areas, large eat-in kitchen island, ample storage, and All-Ready Smart Home package.
Key facts
- Walk-in closets
- Open-concept layout
- Ample storage
Tags
Neighborhood map
What this means for you Summary
Snapshot
- This is a 4-bed/2.5-bath single-family listed at $615k.
Deal economics
- At list price, monthly cash flow is $-2k ($-30k/yr) — negative.
- To cash-flow at today's rent, offer at most $372k (39.5% below list).
- To meet the 1% rule (rent ≥ 1% of price), the offer needs to be $326k (47.0% below list).
- Recommended offer: $326k (47.0% below list) — sets the bar for 1% rule.
- Cap rate 2.2% vs local median 3.0% in Rancho Cordova — below-typical yield; the buyer is paying a premium for something (appreciation thesis, condition, location) that the cap rate doesn't capture.
Location & tenants
- Location reads 68/100 on livability (#268 in CA) — a middle-class / working-renter tenant base. Strengths: housing A+, employment B; Watch: commute C-, crime D, cost of living F.
- Elk Grove Unified (suburban): math 40% / reading 51% proficiency, ranked #165 of 517 in CA (top 32%) — families likely to look elsewhere, expect single-tenant / working-renter base with shorter leases.
- Zoned schools: Sunrise Elementary (math 65% / reading 67%, grade B+, #176 of 1,571 statewide, top 11%, 966 students, 21% FRL); Katherine L. Albiani Middle (math 55% / reading 67%, grade B+, #57 of 498 statewide, top 12%, 1,307 students, 27% FRL); Pleasant Grove High (math 57% / reading 74%, grade B, #157 of 1,170 statewide, top 14%, 2,520 students, 22% FRL) — zoned schools average 23% FRL vs 43% district-wide (19 pts lower); this property's tenant base skews higher-income than the district average.
- Zoned-school proficiency averages 64% at this address vs 46% district-wide (+19 pts) — the actual schools serving this property are materially stronger than the Elk Grove Unified average implies; a family-tenant draw the district grade alone would hide.
- Market conditions: Rents rising (+2.1%/yr); 471 active listings in the ZIP; 15 comparable units currently listed for rent nearby; rentals at typical pace (median 18d on market — plan ~3-4 weeks tenant-placement turnaround); high-income renter base; 6,825 units permitted in Sacramento County in 2024 (1,752 in 5+ unit buildings).
Forward outlook
- In year one you build about $78k of equity ($5k loan paydown + $73k appreciation (10.0% local appreciation)).
- Sacramento County population projected at +17% by 2050 — long-run rental-demand tailwind backs the buy-and-hold thesis.
- By year 2, paydown + projected appreciation supports a ~$126k cash-out refi (75% LTV) — recoverable capital for the next deal without selling this one.
Negotiation context
- It's been on market 199 days — a 12% lower offer ($541k) is reasonable based on typical stale-listing flexibility.
Questions for the listing agent
- What do current leases actually rent for vs. the listed asking? Can we see a recent rent roll and the last 12 months of T-12 income?
- It's been on market 199 days. Have you received any prior offers? Is the seller open to a 47% concession, seller financing, or rate buy-down credit?
- Why hasn't it sold? Are there any deal-killer items the seller is aware of (foundation, flood, title, zoning, code violations)?
- Is there a deadline driving the sale (1031 exchange, divorce, estate, relocation)? That informs how much negotiation room exists.
- Crime grade is D in this area — have there been break-ins, vandalism, or insurance claims at this property in the last 3 years? What carrier currently insures it and at what premium?
- The area grade is low — what's the realistic commute time and amenity access for the typical tenant pool here? Any planned neighborhood developments (good or bad) we should know about?
- What's the average days-on-market for RENTAL listings here right now (not sales)? A rising rental-DOM trend means longer vacancies and softer asking-rent achievability than the comps imply.
- What's the recent tenant-quality profile in this submarket — average credit score on applications, eviction rate, late-payment / NSF rate, and stable-employment percentage? A property-management company in the area should have these aggregated.
- How much new for-sale + rental construction is in the pipeline within 1–3 miles? Heavy new supply typically softens prices + rents 12–24 months out; constrained supply supports both.
Investment metrics
- 1% rule
- 0.44% ✗
- Cap rate
- 2.21%
- Cash-on-cash
- -14.59%
- DSCR
- 0.35
- GRM
- 18.8
CMA / ARV
- ARV (median comp)
- $733,597
- List price
- $615,000
- Delta
- -16.17%
- Verdict
- UNDERPRICED
- Comps
- 20 within 1.0 mi
Show comp detail 12 sales within ~0.75 mi
| Address | Dist | Beds/Ba | Sqft | Sold | Price | $/sf | Match |
|---|---|---|---|---|---|---|---|
| 3950 Aura Way | 0.18mi | 4/2.5 | 2,547 (0%) | 1mo | $615,000 | $241 | 91 |
| 12051 Mircado Way | 0.64mi | 4/3.0 | 2,557 (+0%) | 0mo | $657,308 | $257 | 67 |
| 4121 Peak Ct | 0.25mi | 3/2.0 (-1) | 2,293 (-10%) | 0mo | $700,000 | $305 | 64 |
| 4159 Aura Way | 0.24mi | 3/2.0 (-1) | 2,293 (-10%) | 2mo | $795,000 | $347 | 64 |
| 12021 Tiresias Way | 0.53mi | 4/3.0 | 2,365 (-7%) | 2mo | $628,888 | $266 | 60 |
| 4006 Quarter Dome Cir | 0.74mi | 4/2.0 | 2,597 (+2%) | 0mo | $695,000 | $268 | 60 |
| 4195 Dovekie Ct | 0.68mi | 4/3.0 | 2,399 (-6%) | 1mo | $745,000 | $311 | 56 |
| 4179 Dovekie Ct | 0.67mi | 4/3.0 | 2,399 (-6%) | 2mo | $768,280 | $320 | 56 |
| 4327 Orpheus Cir | 0.66mi | 4/3.0 | 2,365 (-7%) | 0mo | $650,000 | $275 | 55 |
| 12445 Kibbie Lake Way | 0.75mi | 3/2.0 (-1) | 2,597 (+2%) | 1mo | $770,000 | $296 | 54 |
| 4263 Orpheus Cir | 0.69mi | 4/3.0 | 2,365 (-7%) | 1mo | $636,400 | $269 | 53 |
| 12425 Kibbie Lake Way | 0.68mi | 3/2.0 (-1) | 2,246 (-12%) | 1mo | $712,000 | $317 | 41 |
Match score weights: distance 35% · size 25% · config 20% · recency 20%. Top-matched comps best support the ARV.
Projected returns pro-forma
10.0% appreciation · 2.08% rent growth · sell at horizon
- IRR
- 14.0%
- Equity multiple
- 2.16×
- Total profit
- $237,583
- Equity at exit
- $660,883
- IRR
- 13.9%
- Equity multiple
- 4.99×
- Total profit
- $818,951
- Equity at exit
- $1,425,218
Cash invested: $205,407 (down + closing). Projections, not guarantees.
Landlord ↔ Tenant lean methodology
- Overall (STATE)
- 18 Strongly Tenant-Friendly
- State California
- 18 Strongly Tenant-Friendly · D+13
- County
- — inherits STATE
- City
- — inherits STATE
ZIP-level market 95742
- Home prices YoY
- 28.3%
- Rents YoY
- 2.1%
- Active inventory
- 471
- Price-to-rent
- 15.7×
Monthly cashflow live
- Estimated rent
- $3,257 high interval (Pro) →
- Mortgage (P&I)
- −$3,847
- Tax est. 1.5%
- −$917 /mo · $11,004/yr
- Insurance
- −$306
- HOA
- −$0
- Vacancy / Maint / Mgmt
- −$684
- Net cashflow
- $-2,497
Break-even live
Sensitivity live
| Price | -10% $-1,990 | -5% $-2,243 | +0% $-2,497 | +5% $-2,750 | +10% $-3,004 |
|---|---|---|---|---|---|
| Rent | -10% $-2,754 | -5% $-2,625 | +0% $-2,497 | +5% $-2,368 | +10% $-2,239 |
| Rate | -1.0pp $-2,127 | -0.5pp $-2,310 | base $-2,497 | +0.5pp $-2,687 | +1.0pp $-2,880 |
UW: 25.0% down · 7.5% · 30yr · 1.5% tax · 5.0% vac · 8.0% maint · 8.0% mgmt
Financing live
Cash to close
- Down payment
- $183,399
- Closing costs
- $22,008
- Reserves months
- —
- Total cash needed
- —
Loan-product check · same deal, 3 products live
Conventional
25% down · 7.5% · 30yr
- Down + closing
- —
- Monthly P&I
- —
- Monthly cashflow
- —
- DSCR
- —
- Eligible?
- —
Personal DTI + credit; lowest rate.
DSCR
20% down · 8.5% · 30yr
- Down + closing
- —
- Monthly P&I
- —
- Monthly cashflow
- —
- DSCR
- —
- Eligible?
- —
No personal income docs; deal must DSCR.
Hard money
10% down · 12.0% · 12mo
- Down + closing
- —
- Monthly P&I
- —
- Monthly cashflow
- —
- DSCR
- —
- Eligible?
- —
Short-term bridge; refi at stabilization.
Rent comps 15 comps
| Address | Beds | Baths | Sqft | Rent | $/sqft | DOM | Units | Dist |
|---|---|---|---|---|---|---|---|---|
| 12153 Coal Creek Way Rancho Cordova, CA | 3.0 | 2.5 | 1906 | $2,750 | $1.44 | 16d | 1 | 0.30mi |
| 4013 Trento Way Rancho Cordova, CA | 4.0 | 3.0 | 2371 | $3,225 | $1.36 | 18d | 1 | 0.57mi |
| 11925 Cobblebrook Dr Rancho Cordova, CA | 4.0 | 3.0 | 2786 | $3,595 | $1.29 | 45d | 1 | 0.64mi |
| 11965 Pericles Dr Rancho Cordova, CA | 4.0 | 3.0 | 2580 | $2,900 | $1.12 | 45d | 1 | 0.89mi |
| 4221 Anatolia Dr Rancho Cordova, CA | 5.0 | 3.5 | 2763 | $3,195 | $1.16 | 9d | 1 | 1.03mi |
| 4223 Anatolia Dr Rancho Cordova, CA | 5.0 | 3.5 | 2876 | $2,500 | $0.87 | 25d | 1 | 1.03mi |
| 11795 Corino Way Rancho Cordova, CA | 3.0 | 2.0 | 2000 | $2,880 | $1.44 | 0d | 1 | 1.13mi |
| 11832 Stoney Ridge Way Rancho Cordova, CA | 4.0 | 2.5 | 2019 | $2,695 | $1.33 | 12d | 1 | 1.14mi |
| 11688 Giacinta Ln Rancho Cordova, CA | 4.0 | 2.5 | 1765 | $3,499 | $1.98 | 14d | 1 | 1.22mi |
| 11684 Fiorenza Ln Rancho Cordova, CA | 4.0 | 2.5 | 1765 | $3,529 | $2.00 | 24d | 1 | 1.24mi |
| 3686 Rockdale Dr Rancho Cordova, CA | 4.0 | 2.0 | 1880 | $2,795 | $1.49 | 9d | 1 | 1.29mi |
| 4480 Arctic Tern Way Rancho Cordova, CA | 4.0 | 2.5 | 2550 | $3,000 | $1.18 | 45d | 1 | 1.35mi |
| 4328 Greenshank Cir Rancho Cordova, CA | 4.0 | 2.0 | 1800 | $3,100 | $1.72 | 45d | 1 | 1.44mi |
| 12647 Spotted Wren Way Rancho Cordova, CA | 5.0 | 3.0 | 2609 | $3,450 | $1.32 | 45d | 1 | 1.46mi |
| 4454 Greenshank Way Rancho Cordova, CA | 4.0 | 3.0 | 1900 | $2,795 | $1.47 | 0d | 1 | 1.48mi |
Listing history 16 events
-
2026-06-21days on market $615,000 Active 199 DOM
-
2026-06-18days on market $615,000 Active 196 DOM
-
2026-06-17days on market $615,000 Active 195 DOM
-
2026-06-16days on market $615,000 Active 194 DOM
-
2026-06-15days on market $615,000 Active 193 DOM
-
2026-06-13days on market $615,000 Active 191 DOM
-
2026-06-13days on market $615,000 Active 190 DOM
-
2026-06-09days on market $615,000 Active 187 DOM
-
2026-06-08days on market $615,000 Active 186 DOM
-
2026-06-07days on market $615,000 Active 185 DOM
-
2026-06-05days on market $615,000 Active 182 DOM
-
2026-06-03days on market $615,000 Active 181 DOM
-
2026-06-02days on market $615,000 Active 180 DOM
-
2026-06-01days on market $615,000 Active 179 DOM
-
2026-05-31days on market $615,000 Active 178 DOM
-
2025-12-04$615,000 Active 476-char remark
Show marketing remark (476 chars)
Residence Five: The most expansive plan in the collection at Park Haven, this home is ideal for growing families. . It includes options for a den, office, or fifth bedroom, along with an open-concept layout, walk-in closets in nearly every room, and a downstairs guest suite or bonus space. Enjoy the luxuries included in a Cresleigh Home such as hand set tiles in entry way, kitchen and wet areas, large eat-in kitchen island, ample storage, and All-Ready Smart Home package.
ⓘ Source: listings_history table (triggers on properties + properties_extension) + one-shot
backfill from property_details.listing_events for pre-trigger history.
Nearby sold comps map
Loading sold comps map…
Walkable amenities ~0.75 mi
Loading nearby amenities…
Taxation est. · year 1
- Rental income
- $39,084
- − Mortgage interest
- −$41,093
- − Property taxes
- −$11,004
- − Insurance
- −$3,668
- − Repairs & maintenance
- −$3,127
- − Management
- −$3,127
- − Depreciation
- −$21,341
- Taxable loss
- −$44,275
- Est. tax savings @ 24.0%
- +$10,626
- After-tax cash flow
- $-19,334/yr
For passive investors: Depreciation is non-cash, so a rental often shows a tax loss while cash-flowing — sheltering income. Rental losses are passive: they offset passive income freely, and up to $25,000/yr can offset ordinary (W-2) income if you actively participate and your MAGI is under $100k (phasing out to $0 by $150k); unused losses carry forward. On sale, claimed depreciation is recaptured at up to 25%, and gains may owe capital-gains tax (a 1031 exchange can defer both). Figures are a year-1 estimate at your 24.0% rate — not tax advice; consult a CPA.
Schools (NCES district)
- District
- Elk Grove Unified
- NCES district ID
- 0612330
- Math proficiency
- 40% ▼ -5.00%
- Reading proficiency
- 51% ▼ -5.00%
- Median HH income
- $67,860
- Composite
- 40.72/100
- National rank
- #3658
- State rank
- #165 of 517 in CA
Livability — Rancho Cordova
- Score
- 68/100
- State rank
- #268
- US rank
- #9126
Category grades
Schools grade is shown separately in the Schools card above.
Census & demographics
- Census place
- Rancho Cordova, CA
- County
- Sacramento County · 1,539,646 people
- City population
- 98,329
- Metro
- Sacramento-Roseville-Folsom, CA
- Population (ZIP)
- 17,768
- Household income
- $155,855
- Rent vs Own
- Severe rent burden
- 172.0
Population outlook (Sacramento County) Hauer SSP2
- Today (2025)
- 1,660,763 people
- By 2030
- 1,732,990 · +4.3%
- By 2040
- 1,855,755 · +11.7%
- By 2050
- 1,941,335 · +16.9%
- By 2075
- 2,046,162 · +23.2%
- By 2100
- 1,961,444 · +18.1%
Race, ethnicity, and origin ACS 2023
- Neighborhood character
- Highly diverse neighborhood (Simpson 0.72)
- Race & ethnicity
- White 42% Asian 28% Hispanic / Latino 15% Two or more races 13% Black 7%
- Hispanic origin (detail)
- Mexican 11% Puerto Rican 1%
- Common ancestry
- Italian 3% Slovak 2% Subsaharan African 2%
- Foreign-born
- 25% · China, South Korea, Canada
- Languages at home
- 67% English-only · Other Asian/Pacific 7% Other Indo-European 7% Tagalog/Filipino 5%
Political lean MEDSL · Sacramento
- 2024 margin
- D (+19.7) · D 58.1% · R 38.4% · Other 3.5%
- 2008→2024 swing
- +0.7pp no change · 2008: 19.0pp · 2024: 19.7pp
- All cycles
- 2024: D+19.7 2020: D+25.3 2016: D+23.7 2012: D+16.3 2008: D+19.0
Not yet ingested
- Civics
- —
Market trends
- HPI YoY
- ▲ 52.05%
- Current HPI
- 236.1388
- Rent YoY
- ▲ 2.08%
- Metro
- Sacramento-Roseville-Folsom, CA
- State GDP YoY
- ▲ 3.21%
- F500 in state
- 116
Industry mix (Fortune 500 HQ in CA)
| Industry | F500 HQs | Revenue |
|---|---|---|
| Technology | 27 | $1,492B |
|
||
| Financial Services | 3 | $174B |
|
||
| Retail | 3 | $44B |
|
||
| Insurance | 3 | $26B |
|
||
| Media / Entertainment | 2 | $115B |
|
||
| Pharmaceuticals / Biotech | 2 | $62B |
|
||
Price history
1 event — show timeline
- 2025-12-04 Listed $615,000 Zillow
Cash-flow waterfall
monthlySold comps — $/sqft
last 12 mo · ≤1 miLoading sold comps…