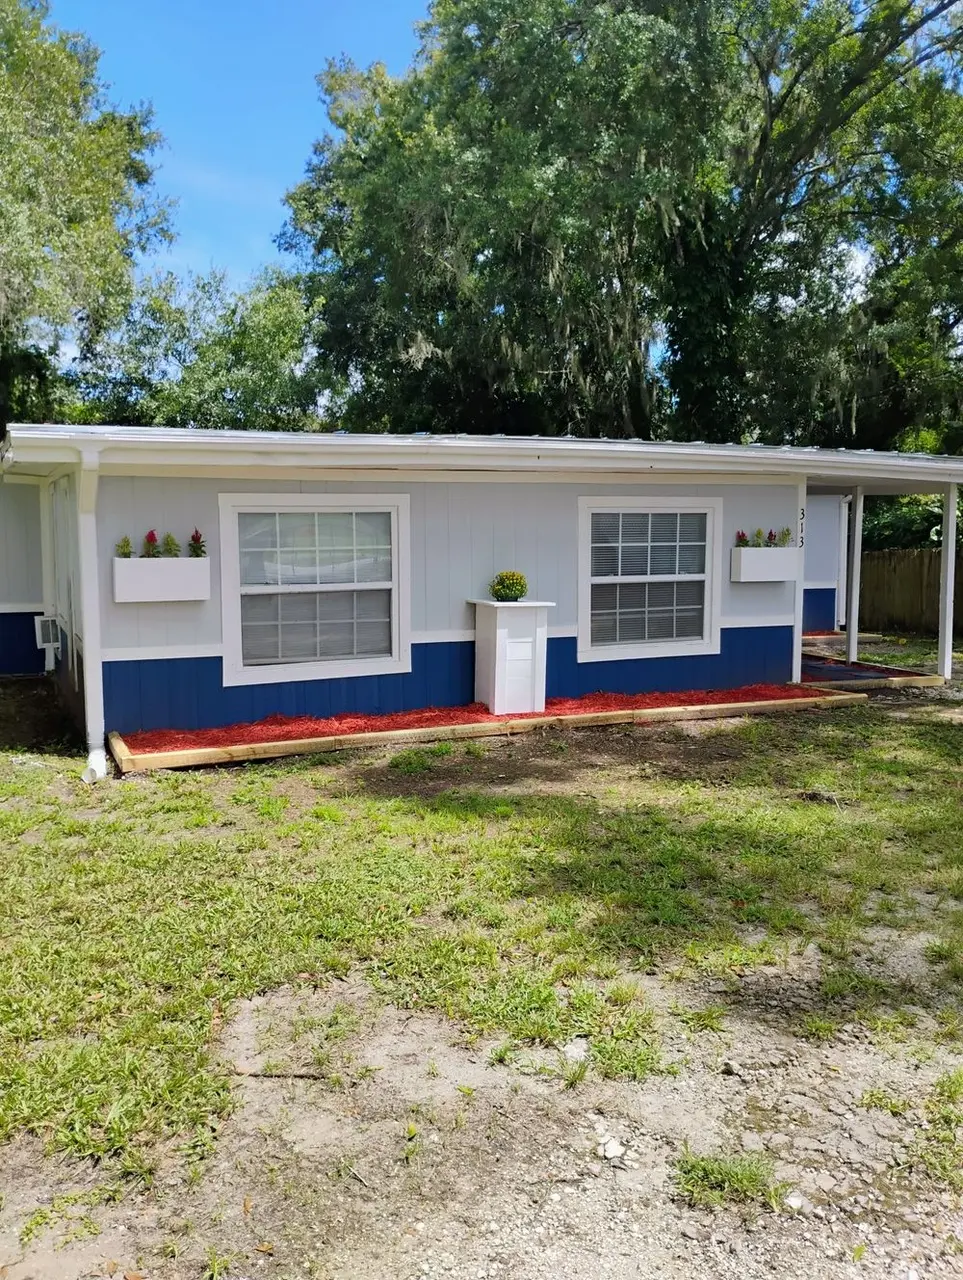
313 Story Partin Rd · Bithlo, FL
Flood risk 1/10 · Minimal
- FEMA flood zone
- X (unshaded)
- Chance of flooding over 30 yrs
- 0.0%
- Est. flood insurance / yr
- $507 – $1,088
Fire risk 3/10 · Minor
- Est. fire insurance / yr
- $947 – $1,759
Heat risk 8/10 · Major
- Hot days now (above 107°F)
- 7 days/yr
- Hot days in 30 yrs
- 20 days/yr
Wind risk 10/10 · Severe
- Chance of severe wind over 30 yrs
- 99.0%
Air-quality risk 2/10 · Minimal
- Unhealthy air days now
- 0 days/yr
- Unhealthy air days in 30 yrs
- 1 days/yr
Risk factors via First Street. Map © Google.
Why this score? — see what drove the D grade
The composite is a weighted blend of 9 inputs, each scored 0–100. Each bar is that input's sub-score; the figure is the points it added to the 100-point composite (weight × sub-score).
- Cash flow +14.2/30.0
- ARV discount +7.5/15.0
- DSCR +4.3/10.0
- 1% rule +4.1/10.0
- Schools +4.1/10.0
- Livability +3.0/5.0
- Rent growth +2.5/5.0
- Condition / age +2.5/5.0
- Appreciation +0.0/10.0
$268,200
🖨 Deal sheet (PDF) 📄 Offer letter ✓ Due diligence
Listing remarks
This beautiful remodeled home has three bedrooms , two bathrooms, Plus an office that could be used as a fourth bedroom. This manufactured home offers 1,665 sqft of high quality living space, and is move in ready. It is situated on a large . 31 acre fenced-in lot, the property provides privacy and freedom, no worries about HOA restrictions means you can truly make this home yours. This home provides central heat and AC. Brand new flooring has been put throughout the home, this home has two full bathrooms, with brand new tiled showers. The kitchen has been fully renovated with brand new cabinets, brand new range, brand new over range microwave, brand new dishwasher, and a full size stand up
Key facts
- Large fenced-in lot
- No hoa restrictions
- Central heat and ac
Tags
Property features AI
Exterior
- Home design: House
- Construction: Living area approximately 1,656
- Exterior features: Lot of approximately 13,499 sq ft
Neighborhood map
What this means for you Summary
Snapshot
- This is a 3-bed/2.0-bath single-family listed at $268k.
Deal economics
- At list price, monthly cash flow is $44 ($524/yr) — positive.
- The deal already cash-flows at list — no discount required.
- To meet the 1% rule (rent ≥ 1% of price), the offer needs to be $244k (9.1% below list).
- Recommended offer: $244k (9.1% below list) — sets the bar for 1% rule.
- Cap rate 6.5% vs local median 2.5% in Bithlo — top-decile yield for the area; either an underpriced asset or a hidden risk that comps aren't pricing in. Stress-test before assuming the spread holds.
Location & tenants
- Location reads 60/100 on livability (#808 in FL) — a middle-class / working-renter tenant base. Strengths: housing A+, crime A, employment A-; Watch: amenities F, commute F, health & safety F.
- Orange (suburban): math 46% / reading 51% proficiency, ranked #43 of 73 in FL (top 59%) — families likely to look elsewhere, expect single-tenant / working-renter base with shorter leases.
- Zoned schools: Columbia Elementary (math 62% / reading 67%, grade B, #525 of 2,144 statewide, top 26%, 509 students, 50% FRL); Corner Lake Middle (math 42% / reading 47%, grade D, #320 of 571 statewide, top 57%, 841 students, 54% FRL); East River High (math 27% / reading 47%, grade F, #340 of 667 statewide, top 52%, 2,050 students, 45% FRL).
- Market conditions: 194 active listings in the ZIP; 7 comparable units currently listed for rent nearby; rentals leasing fast (median 13d on market — plan ~1-2 weeks tenant-placement turnaround); solid renter incomes; 8,053 units permitted in Orange County in 2024 (3,133 in 5+ unit buildings).
Forward outlook
- Local home prices are declining (-3.0%/yr); year-one equity from $2k of loan paydown is wiped out by about $8k of value loss. Plan a longer hold.
- Orange County population projected at +52% by 2050 — long-run rental-demand tailwind backs the buy-and-hold thesis.
Negotiation context
- Only 10 days on market — expect competitive offers; lowballing is unlikely to land.
- 11 sale attempts since 9y ago with the ask held roughly flat each time — persistent listings suggest the price (not the market) is what's stuck; bring a comps-based counter.
- Current owner paid $165k; list at $268k implies a 63% gain — meaningful room to come down on a strong offer.
Risks & watch-outs
- Climate carrying-cost: severe wind risk, 99% chance of damaging wind over 30y; extreme-heat days projected 7→20/yr by 2055 (HVAC capex compounding) — expect insurance premiums to compound above CPI over the hold.
Questions for the listing agent
- Is there a deadline driving the sale (1031 exchange, divorce, estate, relocation)? That informs how much negotiation room exists.
- Schools are F-rated, which usually means shorter tenancies and higher turnover. Who's the typical renter profile here, and what's been the actual vacancy rate?
- The area grade is low — what's the realistic commute time and amenity access for the typical tenant pool here? Any planned neighborhood developments (good or bad) we should know about?
- What's the average days-on-market for RENTAL listings here right now (not sales)? A rising rental-DOM trend means longer vacancies and softer asking-rent achievability than the comps imply.
- What's the recent tenant-quality profile in this submarket — average credit score on applications, eviction rate, late-payment / NSF rate, and stable-employment percentage? A property-management company in the area should have these aggregated.
- How much new for-sale + rental construction is in the pipeline within 1–3 miles? Heavy new supply typically softens prices + rents 12–24 months out; constrained supply supports both.
Investment metrics
- 1% rule
- 0.91% ✗
- Cap rate
- 6.49%
- Cash-on-cash
- 0.70%
- DSCR
- 1.03
- GRM
- 9.2
CMA / ARV
No comps found within radius.
Projected returns pro-forma
-3.0% appreciation · 3.0% rent growth · sell at horizon
- IRR
- -15.2%
- Equity multiple
- 0.46×
- Total profit
- $-40,625
- Equity at exit
- $39,989
- IRR
- -6.6%
- Equity multiple
- 0.58×
- Total profit
- $-31,573
- Equity at exit
- $23,189
Cash invested: $75,096 (down + closing). Projections, not guarantees.
Landlord ↔ Tenant lean methodology
- Overall (STATE)
- 87 Strongly Landlord-Friendly
- State Florida
- 87 Strongly Landlord-Friendly · R+3
- County
- — inherits STATE
- City
- — inherits STATE
ZIP-level market 32833
- Home prices YoY
- -12.9%
- Active inventory
- 194
- Price-to-rent
- 9.2×
Monthly cashflow live
- Estimated rent
- $2,438 high interval (Pro) →
- Mortgage (P&I)
- −$1,406
- Tax from tax record
- −$364 /mo · $4,371/yr
- Insurance
- −$112
- HOA
- −$0
- Vacancy / Maint / Mgmt
- −$512
- Net cashflow
- $44
Break-even live
Sensitivity live
| Price | -10% $195 | -5% $120 | +0% $44 | +5% $-32 | +10% $-108 |
|---|---|---|---|---|---|
| Rent | -10% $-149 | -5% $-53 | +0% $44 | +5% $140 | +10% $236 |
| Rate | -1.0pp $179 | -0.5pp $112 | base $44 | +0.5pp $-26 | +1.0pp $-97 |
UW: 25.0% down · 7.5% · 30yr · 1.5% tax · 5.0% vac · 8.0% maint · 8.0% mgmt
Financing live
Cash to close
- Down payment
- $67,050
- Closing costs
- $8,046
- Reserves months
- —
- Total cash needed
- —
Loan-product check · same deal, 3 products live
Conventional
25% down · 7.5% · 30yr
- Down + closing
- —
- Monthly P&I
- —
- Monthly cashflow
- —
- DSCR
- —
- Eligible?
- —
Personal DTI + credit; lowest rate.
DSCR
20% down · 8.5% · 30yr
- Down + closing
- —
- Monthly P&I
- —
- Monthly cashflow
- —
- DSCR
- —
- Eligible?
- —
No personal income docs; deal must DSCR.
Hard money
10% down · 12.0% · 12mo
- Down + closing
- —
- Monthly P&I
- —
- Monthly cashflow
- —
- DSCR
- —
- Eligible?
- —
Short-term bridge; refi at stabilization.
Rent comps 7 comps
| Address | Beds | Baths | Sqft | Rent | $/sqft | DOM | Units | Dist |
|---|---|---|---|---|---|---|---|---|
| 17778 Caudel Rd Orlando, FL | 3.0 | 2.0 | 1104 | $1,750 | $1.59 | 26d | 1 | 0.77mi |
| 16686 Corner Cove Way Orlando, FL | 3.0 | 2.0 | 1632 | $2,400 | $1.47 | 6d | 1 | 0.82mi |
| 1845 Corner Meadow Cir Orlando, FL | 4.0 | 2.0 | 1874 | $2,245 | $1.20 | 6d | 1 | 1.13mi |
| 16918 Corner Hill Ct Orlando, FL | 3.0 | 2.0 | 1617 | $2,399 | $1.48 | 13d | 1 | 1.19mi |
| 2230 Darlin Cir Orlando, FL | 4.0 | 2.0 | 2031 | $2,550 | $1.26 | 26d | 1 | 1.23mi |
| 2351 Holly Pine Cir Orlando, FL | 4.0 | 2.0 | 1836 | $2,500 | $1.36 | 16d | 1 | 1.36mi |
| 2111 Corner Point Ct Orlando, FL | 4.0 | 2.0 | 1878 | $2,245 | $1.20 | 6d | 1 | 1.42mi |
Listing history 8 events
-
2026-06-21days on market $268,200 Active 10 DOM
-
2026-06-18days on market $268,200 Active 7 DOM
-
2026-06-17days on market $268,200 Active 6 DOM
-
2026-06-16days on market $268,200 Active 5 DOM
-
2026-06-15days on market $268,200 Active 4 DOM
-
2026-06-13days on market $268,200 Active 2 DOM
-
2026-06-13remarks 699-char remark
-
2026-06-13$268,200 Active 1 DOM
ⓘ Source: listings_history table (triggers on properties + properties_extension) + one-shot
backfill from property_details.listing_events for pre-trigger history.
Tax reassessment forecast FL · Resets to sale price
- Current annual tax
- $4,371 · $364/mo
- Projected year-2 tax
- $4,371 · $364/mo
- Expected delta
- $0/yr ($0/mo · 0.0%)
ⓘ Screening estimate from a state-policy table — verify with the county assessor before closing.
Climate risk First Street
- Flood 1/10 Low FEMA zone X (unshaded) · 0% chance over 30 yrs
- Wildfire 3/10 Moderate
- Heat 8/10 Severe 7 d/yr ≥107°F today · 20 d/yr by 30 yrs out
- Wind 10/10 Extreme 99% chance of damaging wind over 30 yrs
- Air quality 2/10 Low 0 unhealthy d/yr today · 1 by 30 yrs out
Nearby sold comps map
Loading sold comps map…
Walkable amenities ~0.75 mi
Loading nearby amenities…
Taxation est. · year 1
- Rental income
- $29,258
- − Mortgage interest
- −$15,023
- − Property taxes
- −$4,371
- − Insurance
- −$1,341
- − Repairs & maintenance
- −$2,341
- − Management
- −$2,341
- − Depreciation
- −$7,802
- Taxable loss
- −$3,961
- Est. tax savings @ 24.0%
- +$951
- After-tax cash flow
- $1,475/yr
For passive investors: Depreciation is non-cash, so a rental often shows a tax loss while cash-flowing — sheltering income. Rental losses are passive: they offset passive income freely, and up to $25,000/yr can offset ordinary (W-2) income if you actively participate and your MAGI is under $100k (phasing out to $0 by $150k); unused losses carry forward. On sale, claimed depreciation is recaptured at up to 25%, and gains may owe capital-gains tax (a 1031 exchange can defer both). Figures are a year-1 estimate at your 24.0% rate — not tax advice; consult a CPA.
Schools (NCES district)
- District
- Orange
- NCES district ID
- 1201440
- Math proficiency
- 46% ▼ -9.00%
- Reading proficiency
- 51% ▼ -2.00%
- Median HH income
- $49,350
- Composite
- 41.47/100
- National rank
- #3461
- State rank
- #43 of 73 in FL
Livability — Bithlo
- Score
- 60/100
- State rank
- #808
- US rank
- #19212
Category grades
Schools grade is shown separately in the Schools card above.
Census & demographics
- Census place
- Bithlo, FL
- County
- Orange County · 1,471,359 people
- Metro
- Orlando-Kissimmee-Sanford, FL
- Population (ZIP)
- 11,389
- Household income
- $98,733
- Rent vs Own
- Severe rent burden
- 206.0
Population outlook (Orange County) Hauer SSP2
- Today (2025)
- 1,618,226 people
- By 2030
- 1,787,404 · +10.5%
- By 2040
- 2,125,621 · +31.4%
- By 2050
- 2,454,016 · +51.6%
- By 2075
- 3,173,711 · +96.1%
- By 2100
- 3,607,781 · +122.9%
Race, ethnicity, and origin ACS 2023
- Neighborhood character
- Diverse neighborhood (Simpson 0.65)
- Race & ethnicity
- White 51% Hispanic / Latino 26% Black 11% Two or more races 10% Asian 6%
- Hispanic origin (detail)
- Mexican 2% Puerto Rican 16% Cuban 4%
- Common ancestry
- Italian 2% Hispanic 2% Lithuanian 2%
- Foreign-born
- 15% · Canada, Vietnam, Jamaica
- Languages at home
- 75% English-only · Spanish 20% Vietnamese 2% Tagalog/Filipino 2%
Political lean MEDSL · Orange
- 2024 margin
- D (+13.6) · D 56.1% · R 42.5% · Other 1.3%
- 2008→2024 swing
- -5.0pp toward R · 2008: 18.6pp · 2024: 13.6pp
- All cycles
- 2024: D+13.6 2020: D+23.1 2016: D+24.6 2012: D+18.2 2008: D+18.6
Not yet ingested
- Civics
- —
Market trends
- HPI YoY
- ▼ -47.65%
- Current HPI
- 321.412
- Rent YoY
- —
- Metro
- Orlando-Kissimmee-Sanford, FL
- State GDP YoY
- ▲ 3.28%
- F500 in state
- 36
Industry mix (Fortune 500 HQ in FL)
| Industry | F500 HQs | Revenue |
|---|---|---|
| Industrial Technology | 2 | $29B |
|
||
| Insurance | 2 | $17B |
|
||
| Retail | 1 | $60B |
|
||
| Technology Distribution | 1 | $58B |
|
||
| Homebuilding | 1 | $35B |
|
||
| Technology Manufacturing | 1 | $35B |
|
||
Price history
+2232.2% since first listed32 events — show timeline
- 2026-06-11 Listed $268,200 ForSaleByOwner.com
- 2025-12-31 Listing Removed — Stellar MLS as Distributed by MLS Grid
- 2025-10-16 Relisted — Stellar MLS as Distributed by MLS Grid
- 2025-10-02 Pending — Stellar MLS as Distributed by MLS Grid
- 2025-06-08 Relisted — Stellar MLS as Distributed by MLS Grid
- 2025-05-31 Listing Removed — Stellar MLS as Distributed by MLS Grid
- 2025-05-04 Relisted — Stellar MLS as Distributed by MLS Grid
- 2025-04-30 Listing Removed — Stellar MLS as Distributed by MLS Grid
- 2025-03-21 Price Changed $279,900 Stellar MLS as Distributed by MLS Grid
- 2025-02-02 Relisted — Stellar MLS as Distributed by MLS Grid
- 2025-01-31 Listing Removed — Stellar MLS as Distributed by MLS Grid
- 2024-12-17 Price Changed $285,900 Stellar MLS as Distributed by MLS Grid
- 2024-11-08 Relisted — Stellar MLS as Distributed by MLS Grid
- 2024-10-26 Pending — Stellar MLS as Distributed by MLS Grid
- 2024-10-24 Price Changed $289,900 Stellar MLS as Distributed by MLS Grid
- 2024-09-25 Listed $295,000 Stellar MLS as Distributed by MLS Grid
- 2024-04-15 Sold (Public Records) $165,000 Public Records
- 2024-04-10 Sold (Public Records) $145,000 Public Records
- 2022-10-08 Listing Removed — Stellar MLS as Distributed by MLS Grid
- 2022-10-05 Relisted — Stellar MLS as Distributed by MLS Grid
- 2022-09-15 Listed $289,000 Stellar MLS as Distributed by MLS Grid
- 2019-01-30 Sold (Public Records) $175,000 Public Records
- 2019-01-28 Sold (MLS) $175,000 Stellar MLS as Distributed by MLS Grid
- 2019-01-20 Pending — Stellar MLS as Distributed by MLS Grid
- 2018-10-03 Price Changed $175,000 Stellar MLS as Distributed by MLS Grid
- 2018-10-01 Listed $170,000 Stellar MLS as Distributed by MLS Grid
- 2018-04-27 Sold (Public Records) $60,000 Public Records
- 2017-02-02 Pending — Stellar MLS as Distributed by MLS Grid
- 2017-02-02 Listing Removed — Stellar MLS as Distributed by MLS Grid
- 2017-02-01 Listed $48,500 Stellar MLS as Distributed by MLS Grid
- 1993-07-08 Sold (Public Records) $35,000 Public Records
- 1981-04-01 Sold (Public Records) $11,500 Public Records
Property tax history
+10.1%/yrLatest (2025): $4,371 · +22.5% YoY. Source: county tax records.
Cash-flow waterfall
monthlySold comps — $/sqft
last 12 mo · ≤1 miLoading sold comps…