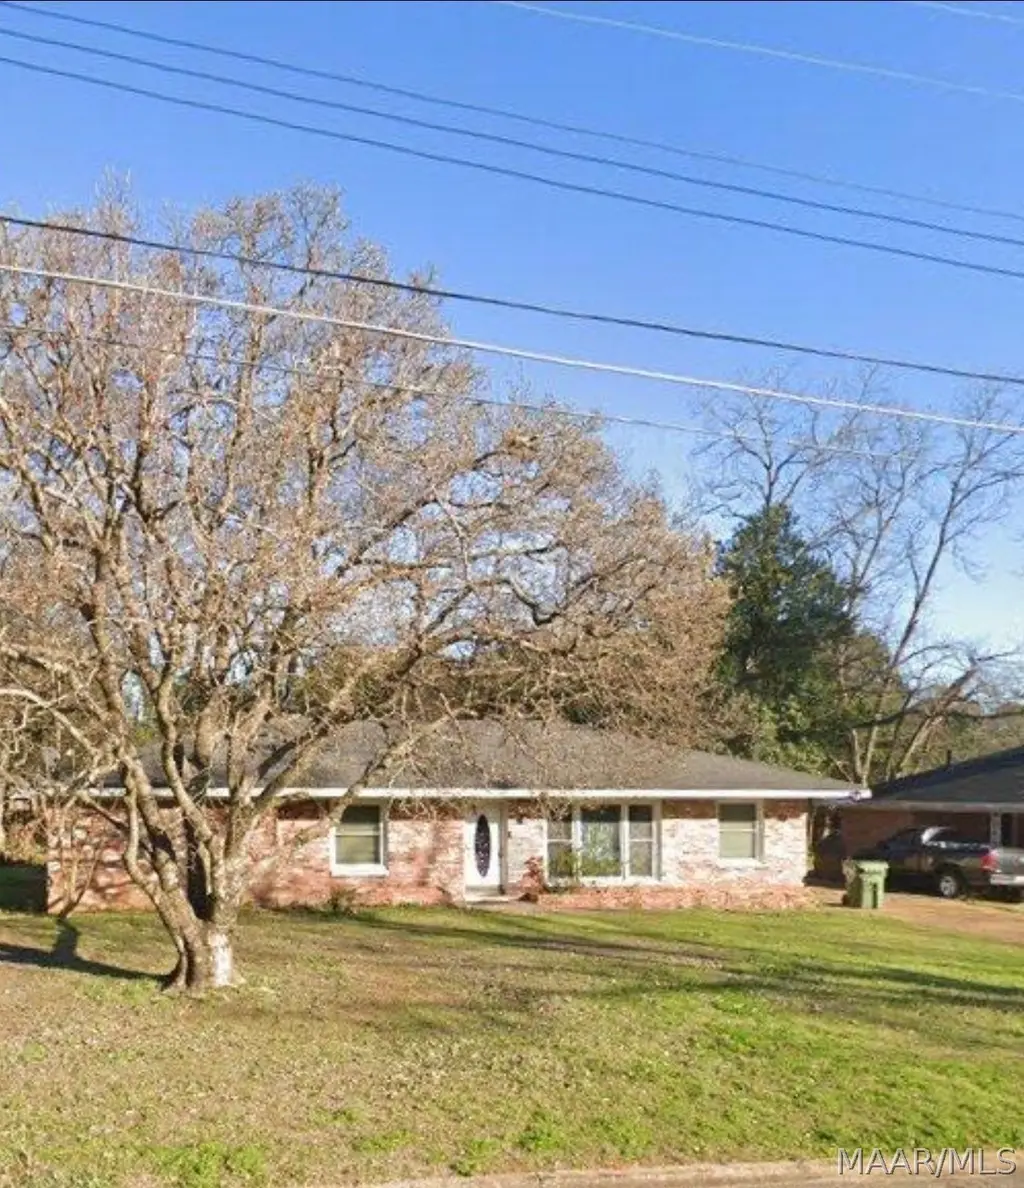
1150 Rosedale Dr · Montgomery, AL
Flood risk 1/10 · Minimal
- FEMA flood zone
- X (unshaded)
- Chance of flooding over 30 yrs
- 0.0%
- Est. flood insurance / yr
- $507 – $1,088
Fire risk 2/10 · Minimal
- Est. fire insurance / yr
- $916 – $1,700
Heat risk 7/10 · Major
- Hot days now (above 107°F)
- 7 days/yr
- Hot days in 30 yrs
- 20 days/yr
Wind risk 8/10 · Major
- Chance of severe wind over 30 yrs
- 80.0%
Air-quality risk 3/10 · Minor
- Unhealthy air days now
- 4 days/yr
- Unhealthy air days in 30 yrs
- 4 days/yr
Risk factors via First Street. Map © Google.
Why this score? — see what drove the B grade
The composite is a weighted blend of 9 inputs, each scored 0–100. Each bar is that input's sub-score; the figure is the points it added to the 100-point composite (weight × sub-score).
- Cash flow +30.0/30.0
- ARV discount +15.0/15.0
- DSCR +10.0/10.0
- 1% rule +8.1/10.0
- Rent growth +3.8/5.0
- Livability +3.2/5.0
- Condition / age +2.5/5.0
- Schools +1.7/10.0
- Appreciation +0.0/10.0
$90,000
🖨 Deal sheet 📄 Offer letter ✓ Due diligence
Listing remarks MLS
A DIAMOND IN THE ROUGH! If you are looking for a fixer upper to call your own or an investor looking to add to your portfolio, then this may be the home for you! LOCATION, LOCATION, LOCATION! Centrally located off Federal Drive, this home is close to just about everything! 3 minute drive to the Fairgrounds, 6 minute drive to Cramton Bowl, nearby shopping at the Neighborhood Market and Farmer's Market. Very close to Gunter AFB and schools. * New windows in front of home 3yrs. ago (Bedroom, Livingroom and Sunroom) * New HVAC in 2020 * Water Heater 3yrs. old Call me or your favorite REALTOR® to see this home! More pictures to come.
Key facts
- New hvac
- Centrally located
- Close to fairgrounds
Tags
Neighborhood map
What this means for you Summary
Snapshot
- This is a 3-bed/1.0-bath single-family listed at $90k.
Deal economics
- At list price, monthly cash flow is $404 ($5k/yr) — positive.
- The deal already cash-flows at list — no discount required.
- Meets the 1% rule at list price ($1k rent vs $90k).
- Recommended offer: $85k (6.0% below list) — sets the bar for market timing.
- Cap rate 11.7% vs local median 6.0% in Montgomery — top-decile yield for the area; either an underpriced asset or a hidden risk that comps aren't pricing in. Stress-test before assuming the spread holds.
Location & tenants
- Location reads 65/100 on livability (#138 in AL) — a middle-class / working-renter tenant base. Strengths: cost of living A+, housing A+; Watch: schools C-, employment D, crime F.
- Montgomery County (urban): math 9% / reading 31% proficiency, ranked #106 of 129 in AL (top 82%) — low school quality limits family demand, transient renter base, plan for 1-2y turnover; 70% free/reduced lunch — lower-income household profile, screen leases tightly.
- Market conditions: Rents rising fast (+5.0%/yr); 67 active listings in the ZIP; 40 comparable units currently listed for rent nearby; rentals at typical pace (median 21d on market — plan ~3-4 weeks tenant-placement turnaround); 48% of comp listings sitting > 30 days — soft ceiling on asking rent; lower-income renter base — watch delinquency; 460 units permitted in Montgomery County in 2024 (37 in 5+ unit buildings).
- This rent runs 44% of the median local income ($32k/yr) — at the standard rent-burdened threshold; future hikes will face affordability resistance.
Forward outlook
- Local home prices are declining (-3.0%/yr); year-one equity from $622 of loan paydown is wiped out by about $3k of value loss. Plan a longer hold.
- Montgomery County population projected to shrink 8% by 2050 — rents likely to lag national; underwrite the cash flow, not the appreciation.
- At projected returns (-3.0% appreciation + 5.0% rent growth), your $25k cash investment doubles in ~6 years — after that, you're playing with house money.
Negotiation context
- It's been on market 78 days — a 6% lower offer ($85k) is reasonable based on typical stale-listing flexibility.
- 3 sale attempts since 23y ago; this cycle's ask has dropped $30k (25%) from the opening price — seller is motivated, your offer sets the floor, not the list.
- Current owner paid $42k; list at $90k implies a 114% gain — meaningful room to come down on a strong offer.
Risks & watch-outs
- Watch-outs: built in 1957 — expect roof / HVAC / electrical / plumbing capex.
- Climate carrying-cost: severe wind risk, 80% chance of damaging wind over 30y; extreme-heat days projected 7→20/yr by 2055 (HVAC capex compounding) — expect insurance premiums to compound above CPI over the hold.
Questions for the listing agent
- It's been on market 78 days. Have you received any prior offers? Is the seller open to a 6% concession, seller financing, or rate buy-down credit?
- Built in 1957 — when were the roof, HVAC, electrical panel, plumbing, and water heater last replaced?
- Why hasn't it sold? Are there any deal-killer items the seller is aware of (foundation, flood, title, zoning, code violations)?
- Is there a deadline driving the sale (1031 exchange, divorce, estate, relocation)? That informs how much negotiation room exists.
- Crime grade is F in this area — have there been break-ins, vandalism, or insurance claims at this property in the last 3 years? What carrier currently insures it and at what premium?
- What's the average days-on-market for RENTAL listings here right now (not sales)? A rising rental-DOM trend means longer vacancies and softer asking-rent achievability than the comps imply.
- What's the recent tenant-quality profile in this submarket — average credit score on applications, eviction rate, late-payment / NSF rate, and stable-employment percentage? A property-management company in the area should have these aggregated.
- How much new for-sale + rental construction is in the pipeline within 1–3 miles? Heavy new supply typically softens prices + rents 12–24 months out; constrained supply supports both.
Investment metrics
- 1% rule
- 1.31% ✓
- Cap rate
- 11.69%
- Cash-on-cash
- 19.26%
- DSCR
- 1.86
- GRM
- 6.4
CMA / ARV
- ARV (median comp)
- $122,136
- List price
- $90,000
- Delta
- -26.31%
- Verdict
- UNDERPRICED
- Comps
- 20 within 1.0 mi
Show comp detail 12 sales within ~0.75 mi
| Address | Dist | Beds/Ba | Sqft | Sold | Price | $/sf | Match |
|---|---|---|---|---|---|---|---|
| 524 Morningview Dr | 0.55mi | 3/1.0 | 1,518 (-2%) | 5mo | $103,000 | $68 | 67 |
| 2129 Windsor Ave | 0.57mi | 3/1.0 | 1,585 (+2%) | 5mo | $135,000 | $85 | 65 |
| 20 Arden Rd | 0.74mi | 3/2.0 | 1,575 (+2%) | 1mo | $165,000 | $105 | 58 |
| 2311 Mccarter Ave | 0.41mi | 3/2.0 | 1,765 (+14%) | 0mo | $64,000 | $36 | 53 |
| 559 Capitol Parkway Ct | 0.71mi | 4/1.0 (+1) | 1,628 (+5%) | 4mo | $90,000 | $55 | 49 |
| 2200 Windsor Ave | 0.59mi | 3/2.0 | 1,400 (-10%) | 5mo | $125,000 | $89 | 48 |
| 2851 Ashley Ave | 0.47mi | 3/1.0 | 1,332 (-14%) | 9mo | $120,101 | $90 | 47 |
| 3025 Brevard Ave | 0.72mi | 3/1.0 | 1,400 (-10%) | 7mo | $136,000 | $97 | 45 |
| 1923 Mckinley Ave | 0.74mi | 3/1.5 | 1,354 (-12%) | 1mo | $111,400 | $82 | 42 |
| 1915 Mckinley Ave | 0.75mi | 3/2.0 | 1,384 (-10%) | 3mo | $148,000 | $107 | 41 |
| 533 Morningview Dr | 0.52mi | 4/2.0 (+1) | 1,726 (+12%) | 9mo | $159,900 | $93 | 40 |
| 106 Kent St | 0.75mi | 3/2.0 | 1,318 (-15%) | 11mo | $136,500 | $104 | 27 |
Match score weights: distance 35% · size 25% · config 20% · recency 20%. Top-matched comps best support the ARV.
Projected returns pro-forma
-3.0% appreciation · 5.05% rent growth · sell at horizon
- IRR
- 13.3%
- Equity multiple
- 1.54×
- Total profit
- $13,618
- Equity at exit
- $13,419
- IRR
- 23.5%
- Equity multiple
- 3.20×
- Total profit
- $55,484
- Equity at exit
- $7,782
Cash invested: $25,200 (down + closing). Projections, not guarantees.
Landlord ↔ Tenant lean methodology
- Overall (STATE)
- 90 Strongly Landlord-Friendly
- State Alabama
- 90 Strongly Landlord-Friendly · R+15
- County
- — inherits STATE
- City
- — inherits STATE
ZIP-level market 36107
- Home prices YoY
- -10.9%
- Rents YoY
- 5.0%
- Active inventory
- 67
- Price-to-rent
- 6.4×
Monthly cashflow live
- Estimated rent
- $1,179 high interval (Pro) →
- Mortgage (P&I)
- −$472
- Tax from tax record
- −$18 /mo · $212/yr
- Insurance
- −$38
- HOA
- −$0
- Vacancy / Maint / Mgmt
- −$248
- Net cashflow
- $404
Break-even live
UW: 25.0% down · 7.5% · 30yr · 1.5% tax · 5.0% vac · 8.0% maint · 8.0% mgmt
Financing live
Cash to close
- Down payment
- $22,500
- Closing costs
- $2,700
- Reserves months
- —
- Total cash needed
- —
Loan-product check · same deal, 3 products live
Conventional
25% down · 7.5% · 30yr
- Down + closing
- —
- Monthly P&I
- —
- Monthly cashflow
- —
- DSCR
- —
- Eligible?
- —
Personal DTI + credit; lowest rate.
DSCR
20% down · 8.5% · 30yr
- Down + closing
- —
- Monthly P&I
- —
- Monthly cashflow
- —
- DSCR
- —
- Eligible?
- —
No personal income docs; deal must DSCR.
Hard money
10% down · 12.0% · 12mo
- Down + closing
- —
- Monthly P&I
- —
- Monthly cashflow
- —
- DSCR
- —
- Eligible?
- —
Short-term bridge; refi at stabilization.
Rent comps 40 comps
| Address | Beds | Baths | Sqft | Rent | $/sqft | DOM | Units | Dist |
|---|---|---|---|---|---|---|---|---|
| 2822 Sumter Ave Montgomery, AL | 3.0 | 2.5 | 1617 | $1,300 | $0.80 | 21d | 1 | 0.37mi |
| 2001 Speigle St Montgomery, AL | 3.0 | 1.0 | 1260 | $1,035 | $0.82 | 43d | 1 | 0.37mi |
| 2814 Ashley Ave Montgomery, AL | 3.0 | 2.0 | 1683 | $1,350 | $0.80 | 13d | 1 | 0.42mi |
| 2769 Pelzer Ave Montgomery, AL | 3.0 | 2.0 | 1608 | $1,325 | $0.82 | 43d | 1 | 0.44mi |
| 2019 Amos St Montgomery, AL | 3.0 | 1.5 | 1134 | $985 | $0.87 | 43d | 1 | 0.52mi |
| 2122 Windsor Ave Montgomery, AL | 2.0 | 1.0 | 1052 | $725 | $0.69 | 43d | 1 | 0.60mi |
| 2076 Midway St Montgomery, AL | 3.0 | 1.0 | 1068 | $1,000 | $0.94 | 43d | 1 | 0.60mi |
| 2056 Midway St Montgomery, AL | 3.0 | 1.0 | 1110 | $985 | $0.89 | 43d | 1 | 0.61mi |
| 3008 Cabot St Montgomery, AL | 4.0 | 2.0 | 1300 | $1,150 | $0.88 | 43d | 1 | 0.67mi |
| 108 Calhoun Rd Unit 108B Montgomery, AL | 2.0 | 1.0 | 1350 | $750 | $0.56 | 43d | 1 | 0.67mi |
| 2310 Yancey Ave Montgomery, AL | 3.0 | 1.0 | 1212 | $1,250 | $1.03 | 43d | 1 | 0.70mi |
| 942 Parkwood Ct Montgomery, AL | 4.0 | 2.0 | 1752 | $1,299 | $0.74 | 13d | 1 | 0.72mi |
| 19 Calhoun Rd Unit B Montgomery, AL | 2.0 | 1.0 | 2022 | $795 | $0.39 | 43d | 1 | 0.73mi |
| 2243 Winona Ave Montgomery, AL | 3.0 | 1.0 | 1492 | $1,225 | $0.82 | 21d | 1 | 0.74mi |
| 2009 Yancey Ave Montgomery, AL | 3.0 | 1.0 | 1140 | $1,080 | $0.95 | 21d | 1 | 0.75mi |
| 3050 Willena Ave Montgomery, AL | 3.0 | 1.0 | 1466 | $985 | $0.67 | 21d | 1 | 0.76mi |
| 200 Eton Rd Montgomery, AL | 3.0 | 1.5 | 1500 | $895 | $0.60 | 13d | 1 | 0.85mi |
| 167 E Salem Dr Montgomery, AL | 3.0 | 2.0 | 1700 | $1,050 | $0.62 | 43d | 1 | 0.89mi |
| 7 Bradley Dr Montgomery, AL | 3.0 | 2.0 | 1529 | $1,500 | $0.98 | 13d | 1 | 0.91mi |
| 2229 Madison Ave Montgomery, AL | 2.0 | 1.0 | 1100 | $625 | $0.57 | 43d | 1 | 0.91mi |
| 508 Glenmore Rd Montgomery, AL | 2.0 | 1.0 | 1135 | $1,000 | $0.88 | 43d | 1 | 0.91mi |
| 3105 Pelzer Ave Montgomery, AL | 4.0 | 2.0 | 1605 | $1,425 | $0.89 | 43d | 1 | 0.92mi |
| 740 Coliseum Blvd Unit 740A Montgomery, AL | 2.0 | 1.0 | 1100 | $895 | $0.81 | 13d | 1 | 0.92mi |
| 15 Bradley Dr Montgomery, AL | 3.0 | 2.0 | 1365 | $1,500 | $1.10 | 21d | 1 | 0.95mi |
| 18 Oak Forest Dr Montgomery, AL | 3.0 | 2.0 | 1580 | $1,050 | $0.66 | 21d | 1 | 0.96mi |
| 67 Holliday Dr Montgomery, AL | 3.0 | 1.0 | 1156 | $1,200 | $1.04 | 43d | 1 | 0.98mi |
| 1024 Grenada Dr Montgomery, AL | 3.0 | 1.0 | 1144 | $1,125 | $0.98 | 43d | 1 | 1.00mi |
| 2004 Capitol Ave Unit 1043879P Montgomery, AL | 4.0 | 2.5 | 1797 | $3,518 | $1.96 | 13d | 1 | 1.08mi |
| 1827 Capitol Ave Montgomery, AL | 2.0 | 1.0 | 1068 | $1,600 | $1.50 | 43d | 1 | 1.11mi |
| 1827 Capitol Ave Montgomery, AL | 2.0 | 1.0 | 1068 | $1,600 | $1.50 | 13d | 1 | 1.11mi |
| 2113 Brewton St Montgomery, AL | 3.0 | 1.0 | 1363 | $1,150 | $0.84 | 43d | 1 | 1.12mi |
| 1501 Winona Ave Montgomery, AL | 2.0 | 1.0 | 1930 | $1,000 | $0.52 | 21d | 1 | 1.14mi |
| 1007 Highpoint Rd Montgomery, AL | 4.0 | 2.0 | 2089 | $1,581 | $0.76 | 13d | 1 | 1.14mi |
| 122 Oak Forest Dr Montgomery, AL | 3.0 | 1.0 | 1092 | $975 | $0.89 | 21d | 1 | 1.16mi |
| 3452 Harris St Montgomery, AL | 3.0 | 1.0 | 1400 | $1,150 | $0.82 | 21d | 1 | 1.20mi |
| 3462 Biltmore Ave Montgomery, AL | 3.0 | 2.0 | 1685 | $1,225 | $0.73 | 21d | 1 | 1.21mi |
| 1653 N Yarbrough Ct Montgomery, AL | 3.0 | 1.0 | 1130 | $950 | $0.84 | 21d | 1 | 1.24mi |
| 39 S Lewis St Montgomery, AL | 2.0 | 1.0 | 1209 | $950 | $0.79 | 43d | 1 | 1.24mi |
| 3329 Vermont Dr Montgomery, AL | 3.0 | 1.5 | 1465 | $1,395 | $0.95 | 13d | 1 | 1.28mi |
| 239 Forest Hills Dr Montgomery, AL | 4.0 | 1.5 | 1500 | $1,450 | $0.97 | 21d | 1 | 1.30mi |
Listing history 21 events
-
2026-06-18days on market $90,000 Active 78 DOM
-
2026-06-17days on market $90,000 Active 77 DOM
-
2026-06-16days on market $90,000 Active 76 DOM
-
2026-06-15days on market $90,000 Active 75 DOM
-
2026-06-14days on market $90,000 Active 73 DOM
-
2026-06-13pricedays on market $90,000 Active 72 DOM
-
2026-06-10days on market $110,000 Active 70 DOM
-
2026-06-09days on market $110,000 Active 69 DOM
-
2026-06-08days on market $110,000 Active 68 DOM
-
2026-06-07days on market $110,000 Active 67 DOM
-
2026-06-03days on market $110,000 Active 63 DOM
-
2026-06-02days on market $110,000 Active 62 DOM
-
2026-06-01days on market $110,000 Active 61 DOM
-
2026-05-31days on market $110,000 Active 60 DOM
-
2026-05-30days on market $110,000 Active 59 DOM
-
2026-05-11price $110,000 654-char remark
Show marketing remark (654 chars)
A DIAMOND IN THE ROUGH! If you are looking for a fixer upper to call your own or an investor looking to add to your portfolio, then this may be the home for you! LOCATION, LOCATION, LOCATION! Centrally located off Federal Drive, this home is close to just about everything! 3 minute drive to the Fairgrounds, 6 minute drive to Cramton Bowl, nearby shopping at the Neighborhood Market and Farmer's Market. Very close to Gunter AFB and schools. * New windows in front of home 3yrs. ago (Bedroom, Livingroom and Sunroom) * New HVAC in 2020 * Water Heater 3yrs. old Call me or your favorite REALTOR® to see this home! More pictures to come.
-
2026-03-31$120,000 Active 654-char remark
Show marketing remark (654 chars)
A DIAMOND IN THE ROUGH! If you are looking for a fixer upper to call your own or an investor looking to add to your portfolio, then this may be the home for you! LOCATION, LOCATION, LOCATION! Centrally located off Federal Drive, this home is close to just about everything! 3 minute drive to the Fairgrounds, 6 minute drive to Cramton Bowl, nearby shopping at the Neighborhood Market and Farmer's Market. Very close to Gunter AFB and schools. * New windows in front of home 3yrs. ago (Bedroom, Livingroom and Sunroom) * New HVAC in 2020 * Water Heater 3yrs. old Call me or your favorite REALTOR® to see this home! More pictures to come.
-
2010-05-07soldstatus $42,000 369-char remark
Show marketing remark (369 chars)
This beauty is the Best Priced Listing in this neighborhood per MLS as of 10/15/2009. It is ready for immediate occupancy. There are beautiful hardwood floors and a fenced in back yard. This property maybe purchased for as little as 3% down. It is also approved for homepath renovation mortgage financing. Please call or have your agent call for additional information.
-
2009-10-15$54,000 369-char remark
Show marketing remark (369 chars)
This beauty is the Best Priced Listing in this neighborhood per MLS as of 10/15/2009. It is ready for immediate occupancy. There are beautiful hardwood floors and a fenced in back yard. This property maybe purchased for as little as 3% down. It is also approved for homepath renovation mortgage financing. Please call or have your agent call for additional information.
-
2003-10-31soldstatus $79,000
-
2003-08-23$79,000
ⓘ Source: listings_history table (triggers on properties + properties_extension) + one-shot
backfill from property_details.listing_events for pre-trigger history.
Tax reassessment forecast AL · Resets to sale price
- Current annual tax
- $212 · $18/mo
- Projected year-2 tax
- $369 · $31/mo
- Expected delta
- +$157/yr (+$13/mo · 74.4%)
ⓘ Screening estimate from a state-policy table — verify with the county assessor before closing.
Climate risk First Street
- Flood 1/10 Low FEMA zone X (unshaded) · 0% chance over 30 yrs
- Wildfire 2/10 Low
- Heat 7/10 Severe 7 d/yr ≥107°F today · 20 d/yr by 30 yrs out
- Wind 8/10 Severe 80% chance of damaging wind over 30 yrs
- Air quality 3/10 Moderate 4 unhealthy d/yr today · 4 by 30 yrs out
Nearby sold comps map
Loading sold comps map…
Walkable amenities ~0.75 mi
Loading nearby amenities…
Taxation est. · year 1
- Rental income
- $14,150
- − Mortgage interest
- −$5,041
- − Property taxes
- −$212
- − Insurance
- −$450
- − Repairs & maintenance
- −$1,132
- − Management
- −$1,132
- − Depreciation
- −$2,618
- Taxable income
- $3,565
- Est. tax owed @ 24.0%
- −$856
- After-tax cash flow
- $3,998/yr
For passive investors: Depreciation is non-cash, so a rental often shows a tax loss while cash-flowing — sheltering income. Rental losses are passive: they offset passive income freely, and up to $25,000/yr can offset ordinary (W-2) income if you actively participate and your MAGI is under $100k (phasing out to $0 by $150k); unused losses carry forward. On sale, claimed depreciation is recaptured at up to 25%, and gains may owe capital-gains tax (a 1031 exchange can defer both). Figures are a year-1 estimate at your 24.0% rate — not tax advice; consult a CPA.
Schools (NCES district)
- District
- Montgomery County
- NCES district ID
- 0102430
- Math proficiency
- 9% ▼ -21.00%
- Reading proficiency
- 31% ▼ -1.00%
- Median HH income
- $43,902
- Composite
- 17.24/100
- National rank
- #9093
- State rank
- #106 of 129 in AL
Livability — Montgomery
- Score
- 65/100
- State rank
- #138
- US rank
- #13416
Category grades
Schools grade is shown separately in the Schools card above.
Census & demographics
- Census place
- Montgomery, AL
- County
- Montgomery County · 190,016 people
- City population
- 175,913
- Metro
- Montgomery, AL
- Population (ZIP)
- 8,001
- Household income
- $32,492
- Rent vs Own
- Severe rent burden
- 642.0
Population outlook (Montgomery County) Hauer SSP2
- Today (2025)
- 224,008 people
- By 2030
- 221,460 · -1.1%
- By 2040
- 214,179 · -4.4%
- By 2050
- 204,912 · -8.5%
- By 2075
- 177,821 · -20.6%
- By 2100
- 145,134 · -35.2%
Race, ethnicity, and origin ACS 2023
- Neighborhood character
- Diverse neighborhood (Simpson 0.69)
- Race & ethnicity
- Black 43% White 27% Hispanic / Latino 23% Two or more races 20%
- Hispanic origin (detail)
- Mexican 8% Cuban 3%
- Common ancestry
- Slovak 1% Iranian 1% Serbian 1%
- Foreign-born
- 11% · Canada
- Languages at home
- 83% English-only · Spanish 13%
Political lean MEDSL · Montgomery
- 2024 margin
- Solid D (+30.7) · D 64.8% · R 34.1% · Other 1.1%
- 2008→2024 swing
- +11.5pp toward D · 2008: 19.2pp · 2024: 30.7pp
- All cycles
- 2024: D+30.7 2020: D+31.5 2016: D+26.2 2012: D+24.3 2008: D+19.2
Not yet ingested
- Civics
- —
Market trends
- HPI YoY
- ▼ -18.16%
- Current HPI
- 147.8065
- Rent YoY
- ▲ 5.05%
- Metro
- Montgomery, AL
- State GDP YoY
- ▲ 2.94%
- F500 in state
- 4
Industry mix (Fortune 500 HQ in AL)
| Industry | F500 HQs | Revenue |
|---|---|---|
| Financial Services | 1 | $8B |
|
||
| Healthcare | 1 | $5B |
|
||
Price history
+39.2% since first listed6 events — show timeline
- 2026-05-11 Price Changed $110,000 MAAR
- 2026-03-31 Listed $120,000 MAAR
- 2010-05-07 Sold (MLS) $42,000 MAAR
- 2009-10-15 Listed $54,000 MAAR
- 2003-10-31 Sold (MLS) $79,000 MAAR
- 2003-08-23 Listed $79,000 MAAR
Property tax history
-7.2%/yrLatest (2018): $212 · -25.8% YoY. Source: county tax records.
Cash-flow waterfall
monthlySold comps — $/sqft
last 12 mo · ≤1 miLoading sold comps…