 🏗️ New Construction
The Bayou Breeze Plan · Shreveport, LA
Flood risk 1/10 · Minimal
- FEMA flood zone
- X (unshaded)
- Chance of flooding over 30 yrs
- 0.0%
- Est. flood insurance / yr
- $507 – $1,088
Fire risk 3/10 · Minor
- Est. fire insurance / yr
- $1,269 – $2,357
Heat risk 7/10 · Major
- Hot days now (above 110°F)
- 7 days/yr
- Hot days in 30 yrs
- 23 days/yr
Wind risk 6/10 · Moderate
- Chance of severe wind over 30 yrs
- 68.0%
Air-quality risk 1/10 · Minimal
- Unhealthy air days now
- 0 days/yr
- Unhealthy air days in 30 yrs
- 0 days/yr
Risk factors via First Street. Map © Google.
Why this score? — see what drove the F grade
The composite is a weighted blend of 9 inputs, each scored 0–100. Each bar is that input's sub-score; the figure is the points it added to the 100-point composite (weight × sub-score).
- ARV discount +7.5/15.0
- Cash flow +5.6/30.0
- Livability +3.0/5.0
- Rent growth +2.5/5.0
- Schools +2.2/10.0
- Condition / age +2.2/5.0
- 1% rule +1.1/10.0
- DSCR +0.1/10.0
- Appreciation +0.0/10.0
$69,999
🖨 Deal sheet (PDF) 📄 Offer letter ✓ Due diligence
Listing remarks MLS
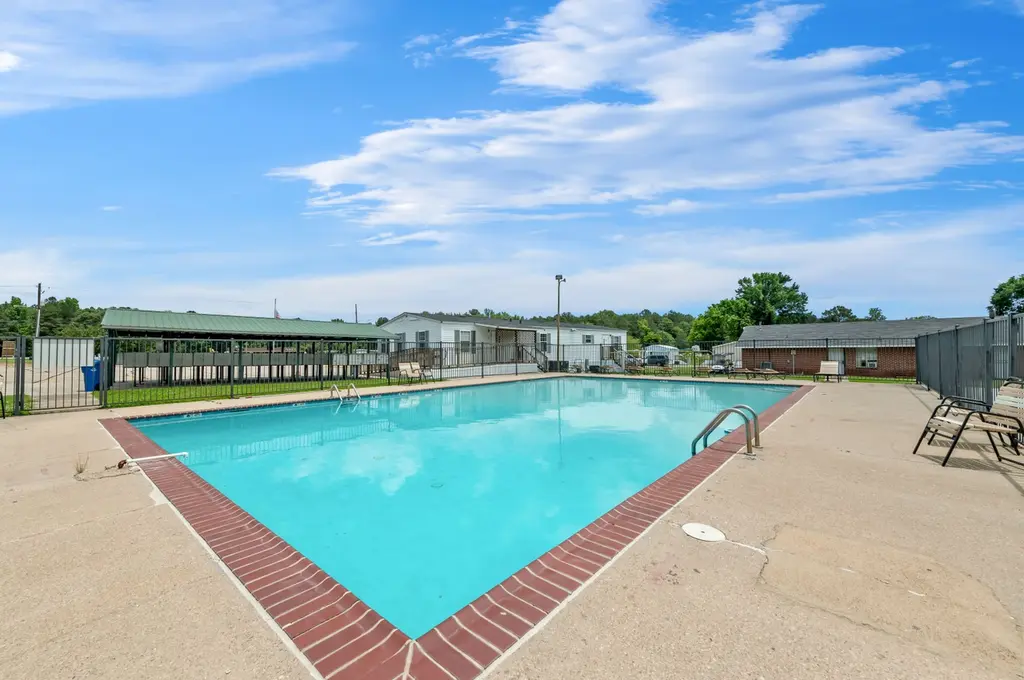
Welcome to Forest Estates, an all-age, pet-friendly community designed for comfort, fun, and convenience. Our neighborhood features a refreshing pool and a vibrant playground, creating the perfect setting for relaxation and family activities. Located near shopping, dining, and essential services, everything you need is just moments away. Discover a welcoming community where families thrive and neighbors become friends.
Key facts
- Vibrant playground
- Near dining
- Refreshing pool
Tags
Neighborhood map
What this means for you Summary
Snapshot
- This is a 4-bed/2.5-bath single-family listed at $70k. Condition is rated fair.
Deal economics
- At list price, monthly cash flow is $-491 ($-6k/yr) — negative.
- The deal already cash-flows at list — no discount required.
- Meets the 1% rule at list price ($1k rent vs $70k).
- Recommended offer: $62k (12.0% below list) — sets the bar for market timing.
- Cap rate 3.8% vs local median 5.7% in Shreveport — below-typical yield; the buyer is paying a premium for something (appreciation thesis, condition, location) that the cap rate doesn't capture.
Location & tenants
- Location reads 59/100 on livability (#270 in LA) — a working-class tenant base; expect higher turnover. Strengths: cost of living A+, housing A; Watch: crime F, amenities F, commute F.
- Caddo Parish (urban): math 21% / reading 32% proficiency, ranked #53 of 98 in LA (top 54%) — low school quality limits family demand, transient renter base, plan for 1-2y turnover; 64% free/reduced lunch — lower-income household profile, screen leases tightly.
- Zoned schools: Walnut Hill Elementary/Middle School (math 11% / reading 32%, grade F, #434 of 646 statewide, top 68%, 1,509 students, 66% FRL); Caddo Parish Middle Magnet School (math 79% / reading 93%, grade A+, #1 of 218 statewide, top 0%, 1,003 students, 23% FRL); Huntington High School (math 6% / reading 34%, grade F, #183 of 265 statewide, top 70%, 1,228 students, 72% FRL).
- Zoned-school proficiency averages 42% at this address vs 26% district-wide (+16 pts) — the actual schools serving this property are materially stronger than the Caddo Parish average implies; a family-tenant draw the district grade alone would hide.
- Market conditions: 77 active listings in the ZIP; 221 units permitted in Caddo Parish in 2024 (0 in 5+ unit buildings).
Forward outlook
- Local home prices are declining (-3.0%/yr); year-one equity from $2k of loan paydown is wiped out by about $7k of value loss. Plan a longer hold.
- Caddo County population projected at -15% by 2050 — secular population decline; favor cash flow + early exit over multi-decade hold.
Negotiation context
- It's been on market 424 days — a 12% lower offer ($62k) is reasonable based on typical stale-listing flexibility.
Risks & watch-outs
- Watch-outs: property tax is 5.1% of price.
- Climate carrying-cost: major wind risk, 68% chance of damaging wind over 30y; extreme-heat days projected 7→23/yr by 2055 (HVAC capex compounding) — expect insurance premiums to compound above CPI over the hold.
Questions for the listing agent
- What do current leases actually rent for vs. the listed asking? Can we see a recent rent roll and the last 12 months of T-12 income?
- It's been on market 424 days. Have you received any prior offers? Is the seller open to a 12% concession, seller financing, or rate buy-down credit?
- Have any recent inspections been done? Can we get a copy of the seller's disclosures and any deferred-maintenance estimates?
- Property tax is high relative to price — has the assessment been appealed recently, and will the sale trigger a re-assessment?
- Why hasn't it sold? Are there any deal-killer items the seller is aware of (foundation, flood, title, zoning, code violations)?
- Is there a deadline driving the sale (1031 exchange, divorce, estate, relocation)? That informs how much negotiation room exists.
- Schools are D-rated, which usually means shorter tenancies and higher turnover. Who's the typical renter profile here, and what's been the actual vacancy rate?
- Crime grade is F in this area — have there been break-ins, vandalism, or insurance claims at this property in the last 3 years? What carrier currently insures it and at what premium?
- The area grade is low — what's the realistic commute time and amenity access for the typical tenant pool here? Any planned neighborhood developments (good or bad) we should know about?
- What's the average days-on-market for RENTAL listings here right now (not sales)? A rising rental-DOM trend means longer vacancies and softer asking-rent achievability than the comps imply.
- What's the recent tenant-quality profile in this submarket — average credit score on applications, eviction rate, late-payment / NSF rate, and stable-employment percentage? A property-management company in the area should have these aggregated.
- How much new for-sale + rental construction is in the pipeline within 1–3 miles? Heavy new supply typically softens prices + rents 12–24 months out; constrained supply supports both.
Investment metrics
- 1% rule
- 0.61% ✗
- Cap rate
- 3.81%
- Cash-on-cash
- -8.86%
- DSCR
- 0.61
- GRM
- 13.6
CMA / ARV
- ARV (median comp)
- $237,508
- List price
- $69,999
- Delta
- -70.53%
- Verdict
- UNDERPRICED
- Comps
- 7 within 1.0 mi
Projected returns pro-forma
-3.0% appreciation · 3.0% rent growth · sell at horizon
- IRR
- -32.0%
- Equity multiple
- -0.05×
- Total profit
- $-69,738
- Equity at exit
- $35,413
- IRR
- -36.7%
- Equity multiple
- -0.52×
- Total profit
- $-100,907
- Equity at exit
- $20,535
Cash invested: $66,502 (down + closing). Projections, not guarantees.
Landlord ↔ Tenant lean methodology
- Overall (STATE)
- 90 Strongly Landlord-Friendly
- State Louisiana
- 90 Strongly Landlord-Friendly · R+12
- County
- — inherits STATE
- City
- — inherits STATE
ZIP-level market 71129
- Home prices YoY
- -27.2%
- Active inventory
- 77
- Price-to-rent
- 4.0×
Monthly cashflow live
- Estimated rent
- $1,456 medium interval (Pro) →
- Mortgage (P&I)
- −$1,246
- Tax est. 1.5%
- −$297 /mo · $3,563/yr
- Insurance
- −$99
- HOA
- −$0
- Vacancy / Maint / Mgmt
- −$306
- Net cashflow
- $-491
Break-even live
Sensitivity live
| Price | -10% $-327 | -5% $-409 | +0% $-491 | +5% $-573 | +10% $-655 |
|---|---|---|---|---|---|
| Rent | -10% $-606 | -5% $-549 | +0% $-491 | +5% $-434 | +10% $-376 |
| Rate | -1.0pp $-371 | -0.5pp $-431 | base $-491 | +0.5pp $-553 | +1.0pp $-615 |
UW: 25.0% down · 7.5% · 30yr · 1.5% tax · 5.0% vac · 8.0% maint · 8.0% mgmt
Financing live
Cash to close
- Down payment
- $59,377
- Closing costs
- $7,125
- Reserves months
- —
- Total cash needed
- —
Loan-product check · same deal, 3 products live
Conventional
25% down · 7.5% · 30yr
- Down + closing
- —
- Monthly P&I
- —
- Monthly cashflow
- —
- DSCR
- —
- Eligible?
- —
Personal DTI + credit; lowest rate.
DSCR
20% down · 8.5% · 30yr
- Down + closing
- —
- Monthly P&I
- —
- Monthly cashflow
- —
- DSCR
- —
- Eligible?
- —
No personal income docs; deal must DSCR.
Hard money
10% down · 12.0% · 12mo
- Down + closing
- —
- Monthly P&I
- —
- Monthly cashflow
- —
- DSCR
- —
- Eligible?
- —
Short-term bridge; refi at stabilization.
Listing history 18 events
-
2026-06-21days on market $69,999 Active 424 DOM
-
2026-06-18days on market $69,999 Active 421 DOM
-
2026-06-17days on market $69,999 Active 420 DOM
-
2026-06-16days on market $69,999 Active 419 DOM
-
2026-06-15days on market $69,999 Active 418 DOM
-
2026-06-14days on market $69,999 Active 416 DOM
-
2026-06-13days on market $69,999 Active 415 DOM
-
2026-06-10days on market $69,999 Active 413 DOM
-
2026-06-09days on market $69,999 Active 412 DOM
-
2026-06-08days on market $69,999 Active 411 DOM
-
2026-06-07days on market $69,999 Active 410 DOM
-
2026-06-05days on market $69,999 Active 407 DOM
-
2026-06-03days on market $69,999 Active 406 DOM
-
2026-06-02days on market $69,999 Active 405 DOM
-
2026-06-01days on market $69,999 Active 404 DOM
-
2026-05-31days on market $69,999 Active 403 DOM
-
2026-05-30days on market $69,999 Active 402 DOM
-
2025-04-23$69,999 Active 422-char remark
Show marketing remark (422 chars)
Welcome to Forest Estates, an all-age, pet-friendly community designed for comfort, fun, and convenience. Our neighborhood features a refreshing pool and a vibrant playground, creating the perfect setting for relaxation and family activities. Located near shopping, dining, and essential services, everything you need is just moments away. Discover a welcoming community where families thrive and neighbors become friends.
ⓘ Source: listings_history table (triggers on properties + properties_extension) + one-shot
backfill from property_details.listing_events for pre-trigger history.
Climate risk First Street
- Flood 1/10 Low FEMA zone X (unshaded) · 0% chance over 30 yrs
- Wildfire 3/10 Moderate
- Heat 7/10 Severe 7 d/yr ≥110°F today · 23 d/yr by 30 yrs out
- Wind 6/10 Major 68% chance of damaging wind over 30 yrs
- Air quality 1/10 Low 0 unhealthy d/yr today · 0 by 30 yrs out
Nearby sold comps map
Loading sold comps map…
Walkable amenities ~0.75 mi
Loading nearby amenities…
Taxation est. · year 1
- Rental income
- $17,474
- − Mortgage interest
- −$13,304
- − Property taxes
- −$3,563
- − Insurance
- −$1,188
- − Repairs & maintenance
- −$1,398
- − Management
- −$1,398
- − Depreciation
- −$6,909
- Taxable loss
- −$10,286
- Est. tax savings @ 24.0%
- +$2,469
- After-tax cash flow
- $-3,424/yr
For passive investors: Depreciation is non-cash, so a rental often shows a tax loss while cash-flowing — sheltering income. Rental losses are passive: they offset passive income freely, and up to $25,000/yr can offset ordinary (W-2) income if you actively participate and your MAGI is under $100k (phasing out to $0 by $150k); unused losses carry forward. On sale, claimed depreciation is recaptured at up to 25%, and gains may owe capital-gains tax (a 1031 exchange can defer both). Figures are a year-1 estimate at your 24.0% rate — not tax advice; consult a CPA.
Condition & rehab AI · 2 photos
The home is in fair condition with moderate rehabilitation needs, primarily focusing on exterior maintenance and minor repairs.
Repairs flagged
- Minor Landscaping — Some areas of grass appear patchy
- Minor Driveway — Some cracks visible
Value-add opportunities
- Resale Paint exterior — Fresh paint can significantly improve curb appeal
- Rental Seal cracks in driveway — A sealed driveway is more durable and less prone to cracking
Renovation cost estimate screening
| Repair item | Severity | Est. cost |
|---|---|---|
| Landscaping · Some areas of grass appear patchy | Minor | $500–3,000 |
| Driveway · Some cracks visible | Minor | $500–3,000 |
| Total estimated repair cost · 2 items | $1,000–6,000 |
Value-add ROI direction
- Resale Paint exterior — Fresh paint can significantly improve curb appeal ↑
- Rental Seal cracks in driveway — A sealed driveway is more durable and less prone to cracking ↑
ⓘ Cost ranges are severity-bucket heuristics (US national rule-of-thumb). Get contractor quotes + a written scope before underwriting a rehab budget.
Schools (NCES district)
- District
- Caddo Parish
- NCES district ID
- 2200300
- Math proficiency
- 21% ▼ -33.00%
- Reading proficiency
- 32% ▼ -30.00%
- Median HH income
- $39,227
- Composite
- 22.23/100
- National rank
- #8148
- State rank
- #53 of 98 in LA
Livability — Shreveport
- Score
- 59/100
- State rank
- #270
- US rank
- #19730
Category grades
Schools grade is shown separately in the Schools card above.
Census & demographics
- Census place
- Shreveport, LA
- City population
- 164,123
- Population (ZIP)
- 12,395
Population outlook (Caddo County) Hauer SSP2
- Today (2025)
- 243,190 people
- By 2030
- 237,231 · -2.5%
- By 2040
- 222,502 · -8.5%
- By 2050
- 206,516 · -15.1%
- By 2075
- 165,706 · -31.9%
- By 2100
- 122,262 · -49.7%
Race, ethnicity, and origin ACS 2023
- Neighborhood character
- Majority Black (60%)
- Race & ethnicity
- Black 60% White 30% Two or more races 6% Hispanic / Latino 3%
- Common ancestry
- Lithuanian 1% Slovak 1% Italian 1%
- Foreign-born
- 1% · Canada, Guatemala
- Languages at home
- 96% English-only · Spanish 3%
Political lean MEDSL · Caddo
- 2024 margin
- Toss-up / Even · D 51.6% · R 47.0% · Other 1.4%
- 2008→2024 swing
- +1.6pp toward D · 2008: 3.0pp · 2024: 4.6pp
- All cycles
- 2024: D+4.6 2020: D+6.8 2016: D+4.2 2012: D+4.9 2008: D+3.0
Not yet ingested
- Civics
- —
Market trends
- HPI YoY
- ▼ -52.87%
- Current HPI
- 141.6996
- Rent YoY
- —
- Metro
- —
- State GDP YoY
- ▲ 3.29%
- F500 in state
- 10
Industry mix (Fortune 500 HQ in LA)
| Industry | F500 HQs | Revenue |
|---|---|---|
| Telecommunications | 2 | $23B |
|
||
| Utilities | 1 | $12B |
|
||
| Wholesale / Distribution | 1 | $5B |
|
||
| Advertising | 1 | $2B |
|
||
Price history
1 event — show timeline
- 2025-04-23 Listed $69,999 Zillow
Cash-flow waterfall
monthlySold comps — $/sqft
last 12 mo · ≤1 miLoading sold comps…