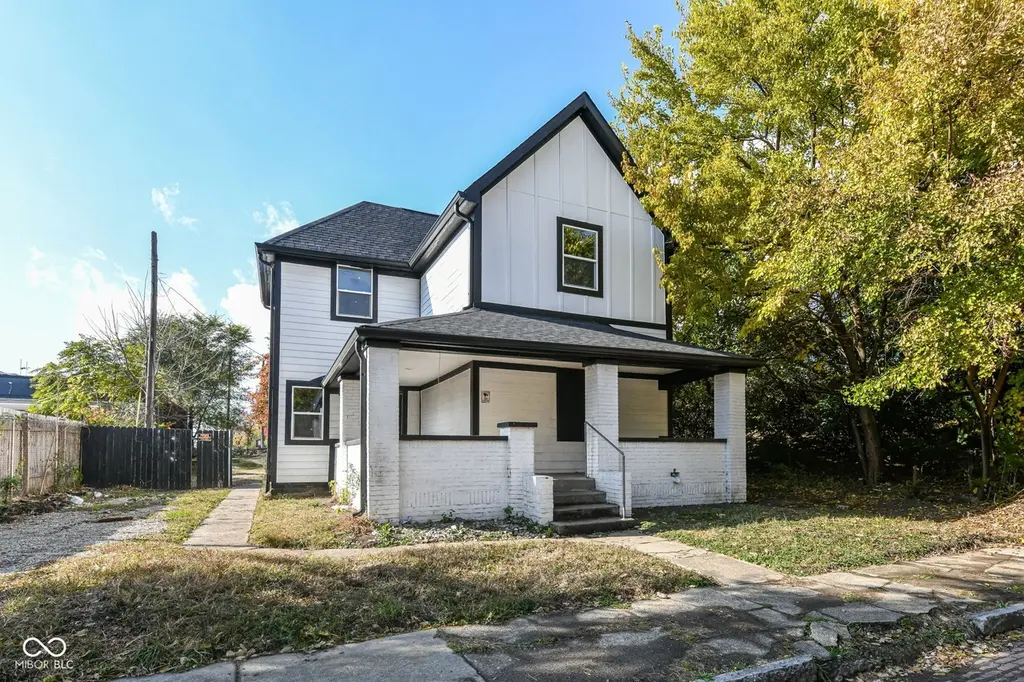
1126 Union St · Indianapolis city (balance), IN
Flood risk 4/10 · Minor
- FEMA flood zone
- X (unshaded)
- Chance of flooding over 30 yrs
- 0.13%
- Est. flood insurance / yr
- $473 – $860
Fire risk 1/10 · Minimal
- Est. fire insurance / yr
- $717 – $1,331
Heat risk 4/10 · Minor
- Hot days now (above 101°F)
- 7 days/yr
- Hot days in 30 yrs
- 19 days/yr
Wind risk 2/10 · Minimal
- Chance of severe wind over 30 yrs
- —
Air-quality risk 4/10 · Minor
- Unhealthy air days now
- 5 days/yr
- Unhealthy air days in 30 yrs
- 7 days/yr
Risk factors via First Street. Map © Google.
Why this score? — see what drove the C grade
The composite is a weighted blend of 9 inputs, each scored 0–100. Each bar is that input's sub-score; the figure is the points it added to the 100-point composite (weight × sub-score).
- Cash flow +19.5/30.0
- ARV discount +15.0/15.0
- 1% rule +7.5/10.0
- DSCR +6.2/10.0
- Rent growth +5.0/5.0
- Livability +2.5/5.0
- Condition / age +2.5/5.0
- Schools +1.4/10.0
- Appreciation +0.0/10.0
$199,900
🖨 Deal sheet (PDF) 📄 Offer letter ✓ Due diligence
Listing remarks MLS
1126 Union St presents an excellent investment opportunity in the rapidly revitalizing Old Southside neighborhood. Just moments from Lucas Oil Stadium and downtown Indy, this 4 bed, 3.5 bath home (2,000 sq ft + 414 sq ft unfinished daylight basement) offers strong potential as a fix & flip, long-term hold, BRRRR strategy, or high-performing STR (projected $70k+ annual revenue). The home was taken to the studs and rebuilt a few years ago, but it was recently vandalized and now needs a full cosmetic renovation. Repairs needed include paint, flooring, kitchen, baths, fixtures, WH/HVAC, and exterior cleanup. The roof and composition cement siding appear to have been replaced within the past few years, so most of the heavy lifting is interior. ARV estimated at $350k+. The floorplan is ideal for renters or guests, featuring raised ceilings, open living/dining/kitchen layout, a main-level bedroom and full bath, plus a laundry room with adjacent half bath. Upstairs offers a primary suite with walk-in closet and full bath, along with two additional bedrooms and a shared full bath. Large covered front porch, deep lot that runs street-to-street, with gravel parking in the front and rear. No neighbors directly to the north, and revitalization is happening all around. Cash or hard money only. Sold as-is. A prime project in one of Indy's fastest developing urban districts-bring your vision and unlock big upside!
Key facts
- Raised ceilings
- Main level bedroom
- Gravel parking
Tags
Neighborhood map
What this means for you Summary
Snapshot
- This is a 4-bed/3.5-bath single-family listed at $200k.
Deal economics
- At list price, monthly cash flow is $227 ($3k/yr) — positive.
- The deal already cash-flows at list — no discount required.
- Meets the 1% rule at list price ($3k rent vs $200k).
- Recommended offer: $176k (12.0% below list) — sets the bar for market timing.
- Cap rate 7.7% vs local median 4.4% in Indianapolis city (balance) — top-decile yield for the area; either an underpriced asset or a hidden risk that comps aren't pricing in. Stress-test before assuming the spread holds.
Location & tenants
- Location reads: area grade C — affects rentability + tenant quality, not the cash-flow math above.
- Indianapolis Public Schools (urban): math 14% / reading 20% proficiency, ranked #286 of 301 in IN (top 95%) — low school quality limits family demand, transient renter base, plan for 1-2y turnover; 77% free/reduced lunch — lower-income household profile, screen leases tightly.
- Zoned schools: Frederick Douglass School 19 (math 9% / reading 13%, grade F, #909 of 994 statewide, top 92%, 444 students, 81% FRL); H L Harshman Middle School (math 3% / reading 16%, grade F, #316 of 330 statewide, top 96%, 549 students, 84% FRL); Arsenal Technical High School (math 6% / reading 27%, grade F, #353 of 369 statewide, top 96%, 2,366 students, 74% FRL) — zoned schools at 80% FRL track the district average.
- Market conditions: Rents rising fast (+11.0%/yr); 131 active listings in the ZIP; 40 comparable units currently listed for rent nearby; rentals at typical pace (median 23d on market — plan ~3-4 weeks tenant-placement turnaround); 1,906 units permitted in Marion County in 2024 (621 in 5+ unit buildings).
- At $2,508/mo this rent would consume 55% of the median local household income ($55k/yr) (locally 311% of renters already pay >50% of income on rent) — very limited rent-growth headroom before tenants either downsize or default.
Forward outlook
- Local home prices are declining (-3.0%/yr); year-one equity from $1k of loan paydown is wiped out by about $6k of value loss. Plan a longer hold.
- Marion County population projected at +18% by 2050 — long-run rental-demand tailwind backs the buy-and-hold thesis.
- At projected returns (-3.0% appreciation + 8.0% rent growth), your $56k cash investment doubles in ~9 years — after that, you're playing with house money.
Negotiation context
- It's been on market 217 days — a 12% lower offer ($176k) is reasonable based on typical stale-listing flexibility.
- 10 sale attempts since 5y ago; this cycle's ask has dropped $30k (13%) from the opening price — seller is motivated, your offer sets the floor, not the list.
Risks & watch-outs
- Watch-outs: property tax is 3.7% of price; built in 1920 — expect roof / HVAC / electrical / plumbing capex.
Questions for the listing agent
- It's been on market 217 days. Have you received any prior offers? Is the seller open to a 12% concession, seller financing, or rate buy-down credit?
- Built in 1920 — when were the roof, HVAC, electrical panel, plumbing, and water heater last replaced?
- Property tax is high relative to price — has the assessment been appealed recently, and will the sale trigger a re-assessment?
- Why hasn't it sold? Are there any deal-killer items the seller is aware of (foundation, flood, title, zoning, code violations)?
- Is there a deadline driving the sale (1031 exchange, divorce, estate, relocation)? That informs how much negotiation room exists.
- What's the average days-on-market for RENTAL listings here right now (not sales)? A rising rental-DOM trend means longer vacancies and softer asking-rent achievability than the comps imply.
- What's the recent tenant-quality profile in this submarket — average credit score on applications, eviction rate, late-payment / NSF rate, and stable-employment percentage? A property-management company in the area should have these aggregated.
- How much new for-sale + rental construction is in the pipeline within 1–3 miles? Heavy new supply typically softens prices + rents 12–24 months out; constrained supply supports both.
Investment metrics
- 1% rule
- 1.25% ✓
- Cap rate
- 7.65%
- Cash-on-cash
- 4.86%
- DSCR
- 1.22
- GRM
- 6.6
CMA / ARV
- ARV (median comp)
- $312,618
- List price
- $199,900
- Delta
- -36.06%
- Verdict
- UNDERPRICED
- Comps
- 20 within 1.0 mi
Show comp detail 12 sales within ~0.75 mi
| Address | Dist | Beds/Ba | Sqft | Sold | Price | $/sf | Match |
|---|---|---|---|---|---|---|---|
| 325 Sanders St | 0.31mi | 3/2.5 (-1) | 2,042 (+2%) | 1mo | $359,000 | $176 | 72 |
| 1334 Union St | 0.18mi | 3/2.0 (-1) | 2,080 (+4%) | 3mo | $294,000 | $141 | 71 |
| 1415 Union St | 0.25mi | 4/2.5 | 2,177 (+9%) | 1mo | $439,000 | $202 | 69 |
| 219 E Morris St | 0.23mi | 4/3.5 | 2,256 (+13%) | 2mo | $432,500 | $192 | 66 |
| 227 Sanders St | 0.26mi | 3/3.5 (-1) | 1,819 (-9%) | 2mo | $335,000 | $184 | 66 |
| 1433 S Talbott St | 0.31mi | 4/2.5 | 2,177 (+9%) | 3mo | $404,750 | $186 | 65 |
| 717 S Illinois St | 0.36mi | 3/1.0 (-1) | 1,948 (-3%) | 1mo | $416,250 | $214 | 63 |
| 518 Terrace Ave | 0.54mi | 3/2.5 (-1) | 1,869 (-7%) | 2mo | $335,000 | $179 | 54 |
| 1666 Union St | 0.52mi | 3/2.0 (-1) | 2,157 (+8%) | 4mo | $270,000 | $125 | 49 |
| 1918 Union St | 0.70mi | 4/2.0 | 1,848 (-8%) | 0mo | $230,000 | $124 | 48 |
| 410 Sanders St | 0.38mi | 3/2.0 (-1) | 2,285 (+14%) | 3mo | $239,500 | $105 | 46 |
| 747 E Mccarty St | 0.71mi | 3/2.0 (-1) | 2,215 (+11%) | 2mo | $235,000 | $106 | 36 |
Match score weights: distance 35% · size 25% · config 20% · recency 20%. Top-matched comps best support the ARV.
Projected returns pro-forma
-3.0% appreciation · 8.0% rent growth · sell at horizon
- IRR
- -2.0%
- Equity multiple
- 0.92×
- Total profit
- $-4,443
- Equity at exit
- $29,806
- IRR
- 13.3%
- Equity multiple
- 2.36×
- Total profit
- $76,124
- Equity at exit
- $17,284
Cash invested: $55,972 (down + closing). Projections, not guarantees.
Landlord ↔ Tenant lean methodology
- Overall (STATE)
- 90 Strongly Landlord-Friendly
- State Indiana
- 90 Strongly Landlord-Friendly · R+11
- County
- — inherits STATE
- City
- — inherits STATE
ZIP-level market 46225
- Home prices YoY
- -8.2%
- Rents YoY
- 11.0%
- Active inventory
- 131
- Price-to-rent
- 6.6×
Monthly cashflow live
- Estimated rent
- $2,508 high interval (Pro) →
- Mortgage (P&I)
- −$1,048
- Tax from tax record
- −$623 /mo · $7,480/yr
- Insurance
- −$83
- HOA
- −$0
- Vacancy / Maint / Mgmt
- −$527
- Net cashflow
- $227
Break-even live
Sensitivity live
| Price | -10% $340 | -5% $283 | +0% $227 | +5% $170 | +10% $113 |
|---|---|---|---|---|---|
| Rent | -10% $28 | -5% $127 | +0% $227 | +5% $326 | +10% $425 |
| Rate | -1.0pp $327 | -0.5pp $277 | base $227 | +0.5pp $175 | +1.0pp $122 |
UW: 25.0% down · 7.5% · 30yr · 1.5% tax · 5.0% vac · 8.0% maint · 8.0% mgmt
Financing live
Cash to close
- Down payment
- $49,975
- Closing costs
- $5,997
- Reserves months
- —
- Total cash needed
- —
Loan-product check · same deal, 3 products live
Conventional
25% down · 7.5% · 30yr
- Down + closing
- —
- Monthly P&I
- —
- Monthly cashflow
- —
- DSCR
- —
- Eligible?
- —
Personal DTI + credit; lowest rate.
DSCR
20% down · 8.5% · 30yr
- Down + closing
- —
- Monthly P&I
- —
- Monthly cashflow
- —
- DSCR
- —
- Eligible?
- —
No personal income docs; deal must DSCR.
Hard money
10% down · 12.0% · 12mo
- Down + closing
- —
- Monthly P&I
- —
- Monthly cashflow
- —
- DSCR
- —
- Eligible?
- —
Short-term bridge; refi at stabilization.
Rent comps 40 comps
| Address | Beds | Baths | Sqft | Rent | $/sqft | DOM | Units | Dist |
|---|---|---|---|---|---|---|---|---|
| 822 Union St Indianapolis, IN | 3.0 | 3.0 | 2384 | $3,700 | $1.55 | 25d | 1 | 0.26mi |
| 818 Union St Indianapolis, IN | 4.0 | 4.0 | 2624 | $3,900 | $1.49 | 25d | 1 | 0.27mi |
| 406 Orange St Indianapolis, IN | 3.0 | 2.5 | 1820 | $2,250 | $1.24 | 45d | 1 | 0.40mi |
| 243 Terrace Ave Indianapolis, IN | 4.0 | 2.0 | 1669 | $2,700 | $1.62 | 19d | 1 | 0.40mi |
| 406 Parkway Ave Indianapolis, IN | 4.0 | 2.5 | 2481 | $2,250 | $0.91 | 25d | 1 | 0.42mi |
| 350 Terrace Ave Indianapolis, IN | 4.0 | 2.5 | 2552 | $3,000 | $1.18 | 25d | 1 | 0.42mi |
| 350 Terrace Ave Indianapolis, IN | 4.0 | 2.5 | 2552 | $3,000 | $1.18 | 6d | 1 | 0.42mi |
| 518 Prospect St Unit 1357365P Indianapolis, IN | 3.0 | 2.0 | 1614 | $2,594 | $1.61 | 9d | 1 | 0.47mi |
| 518 Prospect St Unit 1353834P Indianapolis, IN | 3.0 | 2.0 | 1603 | $2,442 | $1.52 | 16d | 1 | 0.47mi |
| 350 E Minnesota St Unit 1 Indianapolis, IN | 4.0 | 2.5 | 2500 | $3,000 | $1.20 | 0d | 1 | 0.64mi |
| 734 Parkway Ave Indianapolis, IN | 3.0 | 2.0 | 2110 | $2,299 | $1.09 | 25d | 1 | 0.65mi |
| 728 Cottage Ave Indianapolis, IN | 3.0 | 2.5 | 1831 | $2,550 | $1.39 | 25d | 1 | 0.68mi |
| 1247 Wright St Indianapolis, IN | 3.0 | 1.5 | 1809 | $1,750 | $0.97 | 45d | 1 | 0.69mi |
| 743 Cottage Ave Indianapolis, IN | 5.0 | 2.0 | 2233 | $1,995 | $0.89 | 45d | 1 | 0.71mi |
| 752 Cottage Ave Indianapolis, IN | 3.0 | 2.0 | 1548 | $1,750 | $1.13 | 16d | 1 | 0.72mi |
| 229 S Delaware St Indianapolis, IN | 3.0 | 1.0–3.5 | 1207 | $4,743 | $3.93 | 0d | 54 | 0.80mi |
| 835 Weghorst St Unit 837 Indianapolis, IN | 3.0 | 1.5 | 1500 | $1,399 | $0.93 | 25d | 1 | 0.80mi |
| 438 E Beecher St Indianapolis, IN | 3.0 | 2.5 | 1500 | $1,450 | $0.97 | 25d | 1 | 0.83mi |
| 1830 Orleans St Indianapolis, IN | 3.0 | 2.5 | 1586 | $1,995 | $1.26 | 45d | 1 | 0.84mi |
| 1301 Ringgold Ave Unit 1303750P Indianapolis, IN | 3.0 | 3.0 | 2884 | $6,514 | $2.26 | 45d | 1 | 0.88mi |
| 1835 Applegate St Indianapolis, IN | 4.0 | 3.0 | 2024 | $2,300 | $1.14 | 45d | 1 | 0.91mi |
| 1337 Barth Ave Unit NA Indianapolis, IN | 3.0 | 1.0 | 2468 | $1,700 | $0.69 | 6d | 1 | 0.93mi |
| 1337 Barth Ave Indianapolis, IN | 3.0 | 1.0 | 2468 | $1,700 | $0.69 | 9d | 1 | 0.93mi |
| 1337 Barth Ave Indianapolis, IN | 3.0 | 1.0 | 2468 | $1,700 | $0.69 | 12d | 1 | 0.93mi |
| 1337 Barth Ave Indianapolis, IN | 3.0 | 1.0 | 2468 | $1,700 | $0.69 | 18d | 1 | 0.93mi |
| 1703 Ringgold Ave Indianapolis, IN | 3.0 | 2.0 | 1712 | $1,700 | $0.99 | 0d | 1 | 0.98mi |
| 1140 Hoyt Ave Indianapolis, IN | 4.0 | 1.5 | 1831 | $1,895 | $1.03 | 45d | 1 | 1.09mi |
| 1205 Cottage Ave Unit 1372938P Indianapolis, IN | 4.0 | 3.5 | 2680 | $6,638 | $2.48 | 45d | 1 | 1.10mi |
| 1135 Spann Ave Indianapolis, IN | 4.0 | 2.5 | 1836 | $2,495 | $1.36 | 19d | 1 | 1.12mi |
| 50 N Illinois St Unit 1534468P Indianapolis, IN | 1.0–5.0 | 1.5–4.0 | 1770 | $6,658 | $3.76 | 0d | 5 | 1.12mi |
| 50 N Illinois St Unit 1534466P Indianapolis, IN | 3.0 | 2.0 | 1593 | $4,136 | $2.60 | 16d | 1 | 1.12mi |
| 2283 Union St Indianapolis, IN | 3.0 | 2.0 | 1824 | $1,820 | $1.00 | 25d | 1 | 1.18mi |
| 114 W Market St Indianapolis, IN | 1.0–3.0 | 1.0–2.0 | 1193 | $2,879 | $2.41 | 46d | 9 | 1.18mi |
| 1409 Linden St Unit 1028898P Indianapolis, IN | 5.0 | 6.0 | 2895 | $14,651 | $5.06 | 25d | 1 | 1.18mi |
| 1330 Laurel St Indianapolis, IN | 3.0 | 2.0 | 1911 | $2,250 | $1.18 | 22d | 1 | 1.21mi |
| 220 N Meridian St Indianapolis, IN | 3.0 | 1.0–3.0 | 1038 | $3,995 | $3.85 | 21d | 28 | 1.28mi |
| 1258 E Naomi St Indianapolis, IN | 3.0 | 2.0 | 1608 | $1,450 | $0.90 | 9d | 1 | 1.30mi |
| 307 N Pennsylvania St Indianapolis, IN | 3.0 | 1.0–2.5 | 1172 | $3,258 | $2.78 | 0d | 22 | 1.37mi |
| 233 N East St Indianapolis, IN | 4.0 | 1.5 | 1700 | $2,300 | $1.35 | 0d | 1 | 1.38mi |
| 233 N East St Indianapolis, IN | 4.0 | 1.5 | 1700 | $2,370 | $1.39 | 5d | 1 | 1.38mi |
Listing history 45 events
-
2026-06-21days on market $199,900 Active 217 DOM
-
2026-06-18days on market $199,900 Active 214 DOM
-
2026-06-17days on market $199,900 Active 213 DOM
-
2026-06-16days on market $199,900 Active 212 DOM
-
2026-06-15days on market $199,900 Active 211 DOM
-
2026-06-13days on market $199,900 Active 209 DOM
-
2026-06-13days on market $199,900 Active 208 DOM
-
2026-06-09days on market $199,900 Active 205 DOM
-
2026-06-08days on market $199,900 Active 204 DOM
-
2026-06-07days on market $199,900 Active 203 DOM
-
2026-06-03days on market $199,900 Active 199 DOM
-
2026-06-02days on market $199,900 Active 198 DOM
-
2026-06-01days on market $199,900 Active 197 DOM
-
2026-05-31days on market $199,900 Active 196 DOM
-
2026-03-27price $209,900 1425-char remark
Show marketing remark (1425 chars)
1126 Union St presents an excellent investment opportunity in the rapidly revitalizing Old Southside neighborhood. Just moments from Lucas Oil Stadium and downtown Indy, this 4 bed, 3.5 bath home (2,000 sq ft + 414 sq ft unfinished daylight basement) offers strong potential as a fix & flip, long-term hold, BRRRR strategy, or high-performing STR (projected $70k+ annual revenue). The home was taken to the studs and rebuilt a few years ago, but it was recently vandalized and now needs a full cosmetic renovation. Repairs needed include paint, flooring, kitchen, baths, fixtures, WH/HVAC, and exterior cleanup. The roof and composition cement siding appear to have been replaced within the past few years, so most of the heavy lifting is interior. ARV estimated at $350k+. The floorplan is ideal for renters or guests, featuring raised ceilings, open living/dining/kitchen layout, a main-level bedroom and full bath, plus a laundry room with adjacent half bath. Upstairs offers a primary suite with walk-in closet and full bath, along with two additional bedrooms and a shared full bath. Large covered front porch, deep lot that runs street-to-street, with gravel parking in the front and rear. No neighbors directly to the north, and revitalization is happening all around. Cash or hard money only. Sold as-is. A prime project in one of Indy's fastest developing urban districts-bring your vision and unlock big upside!
-
2026-02-19status Active 1425-char remark
Show marketing remark (1425 chars)
1126 Union St presents an excellent investment opportunity in the rapidly revitalizing Old Southside neighborhood. Just moments from Lucas Oil Stadium and downtown Indy, this 4 bed, 3.5 bath home (2,000 sq ft + 414 sq ft unfinished daylight basement) offers strong potential as a fix & flip, long-term hold, BRRRR strategy, or high-performing STR (projected $70k+ annual revenue). The home was taken to the studs and rebuilt a few years ago, but it was recently vandalized and now needs a full cosmetic renovation. Repairs needed include paint, flooring, kitchen, baths, fixtures, WH/HVAC, and exterior cleanup. The roof and composition cement siding appear to have been replaced within the past few years, so most of the heavy lifting is interior. ARV estimated at $350k+. The floorplan is ideal for renters or guests, featuring raised ceilings, open living/dining/kitchen layout, a main-level bedroom and full bath, plus a laundry room with adjacent half bath. Upstairs offers a primary suite with walk-in closet and full bath, along with two additional bedrooms and a shared full bath. Large covered front porch, deep lot that runs street-to-street, with gravel parking in the front and rear. No neighbors directly to the north, and revitalization is happening all around. Cash or hard money only. Sold as-is. A prime project in one of Indy's fastest developing urban districts-bring your vision and unlock big upside!
-
2026-02-13status Pending 1425-char remark
Show marketing remark (1425 chars)
1126 Union St presents an excellent investment opportunity in the rapidly revitalizing Old Southside neighborhood. Just moments from Lucas Oil Stadium and downtown Indy, this 4 bed, 3.5 bath home (2,000 sq ft + 414 sq ft unfinished daylight basement) offers strong potential as a fix & flip, long-term hold, BRRRR strategy, or high-performing STR (projected $70k+ annual revenue). The home was taken to the studs and rebuilt a few years ago, but it was recently vandalized and now needs a full cosmetic renovation. Repairs needed include paint, flooring, kitchen, baths, fixtures, WH/HVAC, and exterior cleanup. The roof and composition cement siding appear to have been replaced within the past few years, so most of the heavy lifting is interior. ARV estimated at $350k+. The floorplan is ideal for renters or guests, featuring raised ceilings, open living/dining/kitchen layout, a main-level bedroom and full bath, plus a laundry room with adjacent half bath. Upstairs offers a primary suite with walk-in closet and full bath, along with two additional bedrooms and a shared full bath. Large covered front porch, deep lot that runs street-to-street, with gravel parking in the front and rear. No neighbors directly to the north, and revitalization is happening all around. Cash or hard money only. Sold as-is. A prime project in one of Indy's fastest developing urban districts-bring your vision and unlock big upside!
-
2026-01-22price $219,900 1425-char remark
Show marketing remark (1425 chars)
1126 Union St presents an excellent investment opportunity in the rapidly revitalizing Old Southside neighborhood. Just moments from Lucas Oil Stadium and downtown Indy, this 4 bed, 3.5 bath home (2,000 sq ft + 414 sq ft unfinished daylight basement) offers strong potential as a fix & flip, long-term hold, BRRRR strategy, or high-performing STR (projected $70k+ annual revenue). The home was taken to the studs and rebuilt a few years ago, but it was recently vandalized and now needs a full cosmetic renovation. Repairs needed include paint, flooring, kitchen, baths, fixtures, WH/HVAC, and exterior cleanup. The roof and composition cement siding appear to have been replaced within the past few years, so most of the heavy lifting is interior. ARV estimated at $350k+. The floorplan is ideal for renters or guests, featuring raised ceilings, open living/dining/kitchen layout, a main-level bedroom and full bath, plus a laundry room with adjacent half bath. Upstairs offers a primary suite with walk-in closet and full bath, along with two additional bedrooms and a shared full bath. Large covered front porch, deep lot that runs street-to-street, with gravel parking in the front and rear. No neighbors directly to the north, and revitalization is happening all around. Cash or hard money only. Sold as-is. A prime project in one of Indy's fastest developing urban districts-bring your vision and unlock big upside!
-
2025-11-10$229,900 Active 1425-char remark
Show marketing remark (1425 chars)
1126 Union St presents an excellent investment opportunity in the rapidly revitalizing Old Southside neighborhood. Just moments from Lucas Oil Stadium and downtown Indy, this 4 bed, 3.5 bath home (2,000 sq ft + 414 sq ft unfinished daylight basement) offers strong potential as a fix & flip, long-term hold, BRRRR strategy, or high-performing STR (projected $70k+ annual revenue). The home was taken to the studs and rebuilt a few years ago, but it was recently vandalized and now needs a full cosmetic renovation. Repairs needed include paint, flooring, kitchen, baths, fixtures, WH/HVAC, and exterior cleanup. The roof and composition cement siding appear to have been replaced within the past few years, so most of the heavy lifting is interior. ARV estimated at $350k+. The floorplan is ideal for renters or guests, featuring raised ceilings, open living/dining/kitchen layout, a main-level bedroom and full bath, plus a laundry room with adjacent half bath. Upstairs offers a primary suite with walk-in closet and full bath, along with two additional bedrooms and a shared full bath. Large covered front porch, deep lot that runs street-to-street, with gravel parking in the front and rear. No neighbors directly to the north, and revitalization is happening all around. Cash or hard money only. Sold as-is. A prime project in one of Indy's fastest developing urban districts-bring your vision and unlock big upside!
-
2024-11-04price $304,900
-
2024-09-03price $314,900
-
2024-08-05$324,900 Active
-
2024-06-06historical
-
2024-05-08price $330,000
-
2024-04-02price $340,000
-
2024-02-20price $350,000
-
2023-12-12price $370,000
-
2023-11-29price $380,000
-
2023-10-18status Active
-
2023-09-06status Active
-
2023-09-05historical
-
2023-09-05historical
-
2023-07-25price $390,000
-
2023-07-05$395,000 Active
-
2023-03-27historical
-
2023-02-17price $439,000
-
2022-11-15$449,000 Active
-
2021-06-16historical
-
2021-06-12status Active
-
2021-04-26status Pending
-
2021-04-20status Active
-
2021-04-20price $99,900
-
2021-03-25status Pending
-
2021-03-12price $125,000
-
2021-02-12$150,000 Active
ⓘ Source: listings_history table (triggers on properties + properties_extension) + one-shot
backfill from property_details.listing_events for pre-trigger history.
Tax reassessment forecast IN · Partial reset (capped growth)
- Current annual tax
- $7,480 · $623/mo
- Projected year-2 tax
- $7,480 · $623/mo
- Expected delta
- $0/yr ($0/mo · 0.0%)
ⓘ Screening estimate from a state-policy table — verify with the county assessor before closing.
Climate risk First Street
- Flood 4/10 Moderate FEMA zone X (unshaded) · 13% chance over 30 yrs
- Wildfire 1/10 Low
- Heat 4/10 Moderate 7 d/yr ≥101°F today · 19 d/yr by 30 yrs out
- Wind 2/10 Low
- Air quality 4/10 Moderate 5 unhealthy d/yr today · 7 by 30 yrs out
Nearby sold comps map
Loading sold comps map…
Walkable amenities ~0.75 mi
Loading nearby amenities…
Taxation est. · year 1
- Rental income
- $30,098
- − Mortgage interest
- −$11,198
- − Property taxes
- −$7,480
- − Insurance
- −$1,000
- − Repairs & maintenance
- −$2,408
- − Management
- −$2,408
- − Depreciation
- −$5,815
- Taxable loss
- −$210
- Est. tax savings @ 24.0%
- +$50
- After-tax cash flow
- $2,769/yr
For passive investors: Depreciation is non-cash, so a rental often shows a tax loss while cash-flowing — sheltering income. Rental losses are passive: they offset passive income freely, and up to $25,000/yr can offset ordinary (W-2) income if you actively participate and your MAGI is under $100k (phasing out to $0 by $150k); unused losses carry forward. On sale, claimed depreciation is recaptured at up to 25%, and gains may owe capital-gains tax (a 1031 exchange can defer both). Figures are a year-1 estimate at your 24.0% rate — not tax advice; consult a CPA.
Schools (NCES district)
- District
- Indianapolis Public Schools
- NCES district ID
- 1804770
- Math proficiency
- 14% ▼ -7.00%
- Reading proficiency
- 20% ▼ -3.00%
- Median HH income
- $32,034
- Composite
- 13.69/100
- National rank
- #9499
- State rank
- #286 of 301 in IN
Livability — Indianapolis city (balance)
No livability data for this city. (Only ~50 U.S. cities are tracked.)
Census & demographics
- Census place
- Indianapolis city (balance), IN
- County
- Marion County · 998,460 people
- City population
- 881,119
- Metro
- Indianapolis-Carmel-Anderson, IN
- Population (ZIP)
- 6,037
- Household income
- $55,190
- Rent vs Own
- Severe rent burden
- 311.0
Population outlook (Marion County) Hauer SSP2
- Today (2025)
- 1,025,572 people
- By 2030
- 1,065,727 · +3.9%
- By 2040
- 1,141,577 · +11.3%
- By 2050
- 1,208,920 · +17.9%
- By 2075
- 1,367,288 · +33.3%
- By 2100
- 1,438,201 · +40.2%
Race, ethnicity, and origin ACS 2023
- Neighborhood character
- Predominantly White (68%)
- Race & ethnicity
- White 68% Two or more races 12% Black 11% Hispanic / Latino 10% Asian 2%
- Hispanic origin (detail)
- Mexican 6%
- Common ancestry
- Romanian 2% Italian 2% Slovak 1%
- Foreign-born
- 9% · Canada
- Languages at home
- 88% English-only · Spanish 10% German/W. Germanic 1%
Political lean MEDSL · Marion
- 2024 margin
- Strong D (+27.7) · D 63.0% · R 35.3% · Other 1.7%
- 2008→2024 swing
- -0.7pp no change · 2008: 28.4pp · 2024: 27.7pp
- All cycles
- 2024: D+27.7 2020: D+29.1 2016: D+22.8 2012: D+22.2 2008: D+28.4
Not yet ingested
- Civics
- —
Market trends
- HPI YoY
- ▼ -36.19%
- Current HPI
- 403.9271
- Rent YoY
- ▲ 10.98%
- Metro
- Indianapolis-Carmel-Anderson, IN
- State GDP YoY
- ▲ 2.90%
- F500 in state
- 18
Industry mix (Fortune 500 HQ in IN)
| Industry | F500 HQs | Revenue |
|---|---|---|
| Industrial Machinery | 2 | $37B |
|
||
| Healthcare | 1 | $177B |
|
||
| Pharmaceuticals | 1 | $45B |
|
||
| Metals / Steel | 1 | $18B |
|
||
| Agriculture | 1 | $17B |
|
||
| Packaging | 1 | $12B |
|
||
Price history
+39.9% since first listed31 events — show timeline
- 2026-03-27 Price Changed $209,900 MIBOR as Distributed by MLS Grid
- 2026-02-19 Relisted — MIBOR as Distributed by MLS Grid
- 2026-02-13 Pending — MIBOR as Distributed by MLS Grid
- 2026-01-22 Price Changed $219,900 MIBOR as Distributed by MLS Grid
- 2025-11-10 Listed $229,900 MIBOR as Distributed by MLS Grid
- 2024-11-04 Price Changed $304,900 IRMLS
- 2024-09-03 Price Changed $314,900 IRMLS
- 2024-08-05 Listed $324,900 IRMLS
- 2024-06-06 Listing Removed — MIBOR as Distributed by MLS Grid
- 2024-05-08 Price Changed $330,000 MIBOR as Distributed by MLS Grid
- 2024-04-02 Price Changed $340,000 MIBOR as Distributed by MLS Grid
- 2024-02-20 Price Changed $350,000 MIBOR as Distributed by MLS Grid
- 2023-12-12 Price Changed $370,000 MIBOR as Distributed by MLS Grid
- 2023-11-29 Price Changed $380,000 MIBOR as Distributed by MLS Grid
- 2023-10-18 Relisted — MIBOR as Distributed by MLS Grid
- 2023-09-06 Relisted — MIBOR as Distributed by MLS Grid
- 2023-09-05 Listing Removed — MIBOR as Distributed by MLS Grid
- 2023-09-05 Listing Removed — MIBOR as Distributed by MLS Grid
- 2023-07-25 Price Changed $390,000 MIBOR as Distributed by MLS Grid
- 2023-07-05 Listed $395,000 MIBOR as Distributed by MLS Grid
- 2023-03-27 Listing Removed — MIBOR as Distributed by MLS Grid
- 2023-02-17 Price Changed $439,000 MIBOR as Distributed by MLS Grid
- 2022-11-15 Listed $449,000 MIBOR as Distributed by MLS Grid
- 2021-06-16 Listing Removed — MIBOR as Distributed by MLS Grid
- 2021-06-12 Relisted — MIBOR as Distributed by MLS Grid
- 2021-04-26 Pending — MIBOR as Distributed by MLS Grid
- 2021-04-20 Relisted — MIBOR as Distributed by MLS Grid
- 2021-04-20 Price Changed $99,900 MIBOR as Distributed by MLS Grid
- 2021-03-25 Pending — MIBOR as Distributed by MLS Grid
- 2021-03-12 Price Changed $125,000 MIBOR as Distributed by MLS Grid
- 2021-02-12 Listed $150,000 MIBOR as Distributed by MLS Grid
Property tax history
+15.9%/yrLatest (2025): $7,480 · +2.4% YoY. Source: county tax records.
Cash-flow waterfall
monthlySold comps — $/sqft
last 12 mo · ≤1 miLoading sold comps…