 Fourplex
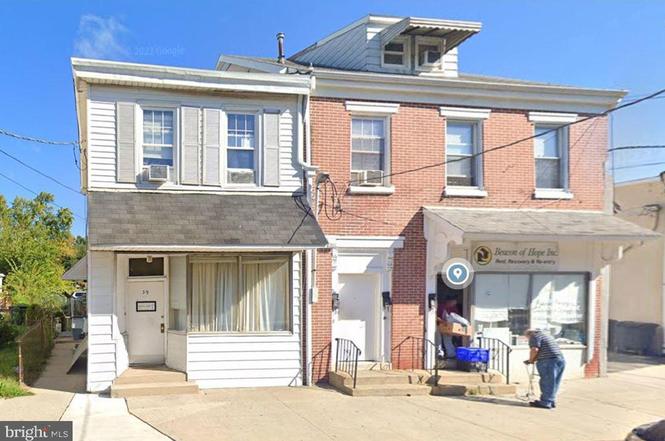
39-41 Mill St · Vincentown, NJ
Flood risk No data
- FEMA flood zone
- —
- Chance of flooding over 30 yrs
- —
- Est. flood insurance / yr
- —
Fire risk No data
- Est. fire insurance / yr
- —
Heat risk No data
- Hot days now (above threshold)
- —
- Hot days in 30 yrs
- —
Wind risk No data
- Chance of severe wind over 30 yrs
- —
Air-quality risk No data
- Unhealthy air days now
- —
- Unhealthy air days in 30 yrs
- —
Risk factors via First Street. Map © Google.
Why this score? — see what drove the B- grade
The composite is a weighted blend of 9 inputs, each scored 0–100. Each bar is that input's sub-score; the figure is the points it added to the 100-point composite (weight × sub-score).
- Cash flow +30.0/30.0
- 1% rule +10.0/10.0
- DSCR +10.0/10.0
- ARV discount +7.5/15.0
- Schools +3.4/10.0
- Rent growth +2.9/5.0
- Livability +2.5/5.0
- Condition / age +2.5/5.0
- Appreciation +0.0/10.0
$399,000
🖨 Deal sheet 📄 Offer letter ✓ Due diligence
Multi-family units
County records classify this as Multi-Family (2-4 Unit). Listing-text estimate: 4 units. confirmed
Listing remarks
* * * Property is completely tenant occupied. Listing agent will be working with tenants to identify several dates in February 2026 for group showings. If interested in attending one of the group showings, please reach out to the listing agent for more information * * * Fully occupied 4-unit mixed-use property at 39-41 Mill St, Mount Holly, NJ, is listed for $399,000. It includes three residential apartments and one commercial space, boasting a strong rental history with long-term tenants and a CAP Rate exceeding 10%. Detailed P & L information for rental income and expenses is available. The property is sold "As-is" with tenants in place, making it a solid investment oppo
Key facts
- Built 1920
- Listed 148 days
Property features AI
Exterior
- Parking: On-street parking
- Utilities: Public water; Public sewer
- Home design: Multifamily property with a total of 4 units; Fee simple ownership
- Construction: Frame construction; Year built is estimated
- Exterior features: No tidal water on the lot; Other structures above grade
Interior
- Bedrooms: Two 1-bedroom units; One 2-bedroom unit
- Heating & cooling: Baseboard hot water heating; Natural gas heating and hot water
- Interior features: Estimated living area
Neighborhood map
What this means for you Summary
Snapshot
- This is a 4 × 4-bed/?-bath units multifamily listed at $399k.
Deal economics
- At list price, monthly cash flow is $6k ($77k/yr) — positive. Per door: $2k/mo.
- The deal already cash-flows at list — no discount required.
- Meets the 1% rule at list price ($12k rent vs $399k).
- Recommended offer: $351k (12.0% below list) — sets the bar for market timing.
- Cap rate 25.6% vs local median 4.5% in Vincentown — top-decile yield for the area; either an underpriced asset or a hidden risk that comps aren't pricing in. Stress-test before assuming the spread holds.
Location & tenants
- Location reads: area grade B — affects rentability + tenant quality, not the cash-flow math above.
- Rancocas Valley Regional High School District (suburban): math 29% / reading 49% proficiency, ranked #236 of 472 in NJ (top 50%) — families likely to look elsewhere, expect single-tenant / working-renter base with shorter leases.
- Market conditions: Rents rising (+1.4%/yr); 134 active listings in the ZIP; solid renter incomes; 2,161 units permitted in Burlington County in 2024 (988 in 5+ unit buildings).
- At $11,606/mo this rent would consume 127% of the median local household income ($109k/yr) (locally 562% of renters already pay >50% of income on rent) — very limited rent-growth headroom before tenants either downsize or default.
Forward outlook
- Local home prices are declining (-3.0%/yr); year-one equity from $3k of loan paydown is wiped out by about $12k of value loss. Plan a longer hold.
- Burlington County population projected to shrink 5% by 2050 — rents likely to lag national; underwrite the cash flow, not the appreciation.
- At projected returns (-3.0% appreciation + 1.4% rent growth), your $112k cash investment doubles in ~2 years — after that, you're playing with house money.
Negotiation context
- It's been on market 149 days — a 12% lower offer ($351k) is reasonable based on typical stale-listing flexibility.
- 7 sale attempts since 20y ago with the ask held roughly flat each time — persistent listings suggest the price (not the market) is what's stuck; bring a comps-based counter.
- Current owner paid $75k; list at $399k implies a 432% gain — meaningful room to come down on a strong offer.
Risks & watch-outs
- Watch-outs: built in 1920 — expect roof / HVAC / electrical / plumbing capex.
Questions for the listing agent
- It's been on market 149 days. Have you received any prior offers? Is the seller open to a 12% concession, seller financing, or rate buy-down credit?
- Can we see the unit-by-unit rent roll, current vacancy, and any below-market leases? What's the average tenancy length?
- What capital expenditures (roof, boiler, parking lot, exteriors) have been made in the last 5 years, and what's planned in the next 2?
- Built in 1920 — when were the roof, HVAC, electrical panel, plumbing, and water heater last replaced?
- Why hasn't it sold? Are there any deal-killer items the seller is aware of (foundation, flood, title, zoning, code violations)?
- Is there a deadline driving the sale (1031 exchange, divorce, estate, relocation)? That informs how much negotiation room exists.
- What's the average days-on-market for RENTAL listings here right now (not sales)? A rising rental-DOM trend means longer vacancies and softer asking-rent achievability than the comps imply.
- What's the recent tenant-quality profile in this submarket — average credit score on applications, eviction rate, late-payment / NSF rate, and stable-employment percentage? A property-management company in the area should have these aggregated.
- How much new apartment / multifamily construction is in the pipeline within 1–3 miles? Heavy new supply (>2% of stock underway) typically softens rents 12–24 months out; light construction supports rent growth.
Investment metrics
- 1% rule
- 2.91% ✓
- Cap rate
- 25.58%
- Cash-on-cash
- 68.87%
- DSCR
- 4.06
- GRM
- 2.9
CMA / ARV
No comps found within radius.
Projected returns pro-forma
-3.0% appreciation · 1.42% rent growth · sell at horizon
- IRR
- 66.5%
- Equity multiple
- 3.92×
- Total profit
- $325,696
- Equity at exit
- $59,492
- IRR
- 70.3%
- Equity multiple
- 7.61×
- Total profit
- $737,918
- Equity at exit
- $34,498
Cash invested: $111,720 (down + closing). Projections, not guarantees.
Landlord ↔ Tenant lean methodology
- Overall (STATE)
- 21 Tenant-Leaning
- State New Jersey
- 21 Tenant-Leaning · D+6
- County
- — inherits STATE
- City
- — inherits STATE
ZIP-level market 08060
- Home prices YoY
- -34.5%
- Rents YoY
- 1.4%
- Active inventory
- 134
- Price-to-rent
- 11.5×
Monthly cashflow live
- Estimated rent
- $11,606 high interval (Pro) →
- Mortgage (P&I)
- −$2,092
- Tax est. 1.5%
- −$499 /mo · $5,985/yr
- Insurance
- −$166
- HOA
- −$0
- Vacancy / Maint / Mgmt
- −$2,437
- Net cashflow
- $6,411
Break-even live
4-unit breakdown (identical units grouped — click to expand)
| Units | Beds | Baths | Est. rent |
|---|---|---|---|
| 4× units | 4 | — | $11,604 |
| #1 | 4 | — | $2,901 |
| #2 | 4 | — | $2,901 |
| #3 | 4 | — | $2,901 |
| #4 | 4 | — | $2,901 |
| Total (4 units) | $11,606 | ||
UW: 25.0% down · 7.5% · 30yr · 1.5% tax · 5.0% vac · 8.0% maint · 8.0% mgmt
Financing live
Cash to close
- Down payment
- $99,750
- Closing costs
- $11,970
- Reserves months
- —
- Total cash needed
- —
Loan-product check · same deal, 3 products live
Conventional
25% down · 7.5% · 30yr
- Down + closing
- —
- Monthly P&I
- —
- Monthly cashflow
- —
- DSCR
- —
- Eligible?
- —
Personal DTI + credit; lowest rate.
DSCR
20% down · 8.5% · 30yr
- Down + closing
- —
- Monthly P&I
- —
- Monthly cashflow
- —
- DSCR
- —
- Eligible?
- —
No personal income docs; deal must DSCR.
Hard money
10% down · 12.0% · 12mo
- Down + closing
- —
- Monthly P&I
- —
- Monthly cashflow
- —
- DSCR
- —
- Eligible?
- —
Short-term bridge; refi at stabilization.
Listing history 28 events
-
2026-06-18days on market $399,000 Active 149 DOM
-
2026-06-17days on market $399,000 Active 148 DOM
-
2026-06-16days on market $399,000 Active 147 DOM
-
2026-06-15days on market $399,000 Active 146 DOM
-
2026-06-13days on market $399,000 Active 144 DOM
-
2026-06-13days on market $399,000 Active 143 DOM
-
2026-06-09days on market $399,000 Active 140 DOM
-
2026-06-08days on market $399,000 Active 139 DOM
-
2026-06-07days on market $399,000 Active 138 DOM
-
2026-06-04days on market $399,000 Active 135 DOM
-
2026-06-03days on market $399,000 Active 134 DOM
-
2026-06-02days on market $399,000 Active 133 DOM
-
2026-06-01days on market $399,000 Active 132 DOM
-
2026-05-31days on market $399,000 Active 131 DOM
-
2026-01-20$399,000 Active
-
2013-06-29historical
-
2012-06-29$279,000
-
2011-06-06historical
-
2010-04-04$299,000
-
2009-12-12historical
-
2008-09-12$274,900
-
2008-08-26historical
-
2008-02-26$375,000
-
2008-01-30historical
-
2007-03-05$299,000
-
2006-11-01soldstatus $75,000
-
2006-08-01historical
-
2006-08-01$75,000
ⓘ Source: listings_history table (triggers on properties + properties_extension) + one-shot
backfill from property_details.listing_events for pre-trigger history.
Nearby sold comps map
Loading sold comps map…
Walkable amenities ~0.75 mi
Loading nearby amenities…
Taxation est. · year 1
- Rental income
- $139,272
- − Mortgage interest
- −$22,350
- − Property taxes
- −$5,985
- − Insurance
- −$1,995
- − Repairs & maintenance
- −$11,142
- − Management
- −$11,142
- − Depreciation
- −$11,607
- Taxable income
- $75,051
- Est. tax owed @ 24.0%
- −$18,012
- After-tax cash flow
- $58,924/yr
For passive investors: Depreciation is non-cash, so a rental often shows a tax loss while cash-flowing — sheltering income. Rental losses are passive: they offset passive income freely, and up to $25,000/yr can offset ordinary (W-2) income if you actively participate and your MAGI is under $100k (phasing out to $0 by $150k); unused losses carry forward. On sale, claimed depreciation is recaptured at up to 25%, and gains may owe capital-gains tax (a 1031 exchange can defer both). Figures are a year-1 estimate at your 24.0% rate — not tax advice; consult a CPA.
Schools (NCES district)
- District
- Rancocas Valley Regional High School District
- NCES district ID
- 3413620
- Math proficiency
- 29% ▼ -18.00%
- Reading proficiency
- 49% ▼ -4.00%
- Median HH income
- $58,992
- Composite
- 34.45/100
- National rank
- #5195
- State rank
- #236 of 472 in NJ
Livability — Vincentown
No livability data for this city. (Only ~50 U.S. cities are tracked.)
Census & demographics
- County
- Burlington County · 323,710 people
- Metro
- Philadelphia-Camden-Wilmington, PA-NJ-DE-MD
- Population (ZIP)
- 25,835
- Household income
- $109,292
- Rent vs Own
- Severe rent burden
- 562.0
Population outlook (Burlington County) Hauer SSP2
- Today (2025)
- 453,425 people
- By 2030
- 452,359 · -0.2%
- By 2040
- 445,033 · -1.9%
- By 2050
- 431,760 · -4.8%
- By 2075
- 406,277 · -10.4%
- By 2100
- 364,732 · -19.6%
Race, ethnicity, and origin ACS 2023
- Neighborhood character
- Diverse neighborhood (Simpson 0.68)
- Race & ethnicity
- White 49% Black 25% Two or more races 15% Hispanic / Latino 13% Asian 4%
- Hispanic origin (detail)
- Mexican 2% Puerto Rican 7%
- Common ancestry
- Romanian 4% Lithuanian 2% Italian 1%
- Foreign-born
- 11% · Canada, Dominican Republic, China
- Languages at home
- 87% English-only · Spanish 7% Other Indo-European 2% French/Haitian/Cajun 1%
Political lean MEDSL · Burlington
- 2024 margin
- D (+16.6) · D 57.6% · R 41.0% · Other 1.3%
- 2008→2024 swing
- -2.0pp toward R · 2008: 18.6pp · 2024: 16.6pp
- All cycles
- 2024: D+16.6 2020: D+19.5 2016: D+14.8 2012: D+18.7 2008: D+18.6
Not yet ingested
- Civics
- —
Market trends
- HPI YoY
- ▼ -156.50%
- Current HPI
- 296.564
- Rent YoY
- ▲ 1.42%
- Metro
- Philadelphia-Camden-Wilmington, PA-NJ-DE-MD
- State GDP YoY
- ▲ 2.05%
- F500 in state
- 34
Industry mix (Fortune 500 HQ in NJ)
| Industry | F500 HQs | Revenue |
|---|---|---|
| Consumer Goods | 3 | $31B |
|
||
| Pharmaceuticals | 2 | $153B |
|
||
| Technology | 2 | $21B |
|
||
| Insurance | 2 | $20B |
|
||
| Healthcare | 2 | $19B |
|
||
| Financial Services | 1 | $70B |
|
||
Price history
+432.0% since first listed14 events — show timeline
- 2026-01-20 Listed $399,000 BRIGHT MLS
- 2013-06-29 Listing Removed — BRIGHT MLS
- 2012-06-29 Listed $279,000 BRIGHT MLS
- 2011-06-06 Listing Removed — BRIGHT MLS
- 2010-04-04 Listed $299,000 BRIGHT MLS
- 2009-12-12 Listing Removed — BRIGHT MLS
- 2008-09-12 Listed $274,900 BRIGHT MLS
- 2008-08-26 Listing Removed — BRIGHT MLS
- 2008-02-26 Listed $375,000 BRIGHT MLS
- 2008-01-30 Listing Removed — BRIGHT MLS
- 2007-03-05 Listed $299,000 BRIGHT MLS
- 2006-11-01 Sold (MLS) $75,000 BRIGHT MLS
- 2006-08-01 Listed $75,000 BRIGHT MLS
- 2006-08-01 Listing Removed — BRIGHT MLS
Cash-flow waterfall
monthlySold comps — $/sqft
last 12 mo · ≤1 miLoading sold comps…