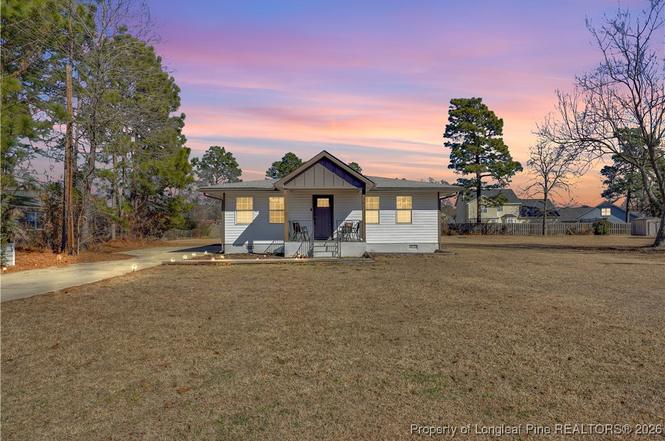
3632 Pine Cone Ln · Hope Mills, NC
Flood risk 1/10 · Minimal
- FEMA flood zone
- X (unshaded)
- Chance of flooding over 30 yrs
- 0.0%
- Est. flood insurance / yr
- $507 – $1,088
Fire risk 7/10 · Major
- Est. fire insurance / yr
- $906 – $1,684
Heat risk 7/10 · Major
- Hot days now (above 106°F)
- 7 days/yr
- Hot days in 30 yrs
- 16 days/yr
Wind risk 7/10 · Major
- Chance of severe wind over 30 yrs
- 78.0%
Air-quality risk 1/10 · Minimal
- Unhealthy air days now
- 0 days/yr
- Unhealthy air days in 30 yrs
- 0 days/yr
Risk factors via First Street. Map © Google.
Why this score? — see what drove the D+ grade
The composite is a weighted blend of 9 inputs, each scored 0–100. Each bar is that input's sub-score; the figure is the points it added to the 100-point composite (weight × sub-score).
- Cash flow +14.6/30.0
- ARV discount +14.0/15.0
- DSCR +4.4/10.0
- Livability +3.4/5.0
- 1% rule +3.1/10.0
- Schools +3.1/10.0
- Rent growth +2.7/5.0
- Condition / age +2.5/5.0
- Appreciation +0.0/10.0
$245,000
🖨 Deal sheet 📄 Offer letter ✓ Due diligence
Listing remarks
Fully remodeled in 2021, this light-filled 3-bedroom, 2-bath home in the Jack Britt School District is giving modern comfort, space, and serious main-character energy. The open layout flows into a gorgeous kitchen with granite countertops, tons of cabinet space, stainless appliances, and a massive island that’s perfect for hosting, meal prepping, or late-night snacks. The primary suite feels like your own private retreat with dual granite vanities and a sleek walk-in shower, while the extra bedrooms flex for guests, work-from-home life, or your next creative project. Outside, the covered porch and spacious backyard are made for cookouts, chill nights, and core memories. With a new roo
Key facts
- Massive island
- Gorgeous kitchen
- Primary suite
Tags
Property features AI
Finance
- Other:
- Financial info:
- HOA & community:
Exterior
- Parking:
- Security:
- Utilities: Water from spring and well; Sewer via holding tank and septic tank
- Home design: Single family residence; One story
- Construction: Vinyl siding
- Exterior features: Subdivision: PEARTREE; Zoned R10 - Residential District
Interior
- Kitchen: Electric range
- Bedrooms: Total rooms: 5
- Flooring: Wood flooring
- Bathrooms: 2 full bathrooms
- Heating & cooling: Central air conditioning; Electric cooling
- Interior features: Eat-in kitchen; Granite counters; Kitchen island; Walk-in closet(s)
- Laundry & utility: Washer hookup
Neighborhood map
What this means for you Summary
Snapshot
- This is a 3-bed/3.0-bath single-family listed at $245k.
Deal economics
- At list price, monthly cash flow is $57 ($681/yr) — positive.
- The deal already cash-flows at list — no discount required.
- To meet the 1% rule (rent ≥ 1% of price), the offer needs to be $198k (19.1% below list).
- Recommended offer: $198k (19.1% below list) — sets the bar for 1% rule.
- Cap rate 6.6% vs local median 4.8% in Hope Mills — top-decile yield for the area; either an underpriced asset or a hidden risk that comps aren't pricing in. Stress-test before assuming the spread holds.
Location & tenants
- Location reads 67/100 on livability (#234 in NC) — a middle-class / working-renter tenant base. Strengths: cost of living A+, housing A+, health & safety B+; Watch: crime D-, amenities F, commute F.
- Cumberland County Schools (urban): math 32% / reading 41% proficiency, ranked #126 of 178 in NC (top 71%) — families likely to look elsewhere, expect single-tenant / working-renter base with shorter leases.
- Zoned schools: Stoney Point Elementary (math 53% / reading 55%, grade C, #328 of 1,410 statewide, top 24%, 879 students, 37% FRL); John R Griffin Middle (math 43% / reading 53%, grade C-, #134 of 475 statewide, top 29%, 1,091 students, 40% FRL); Jack Britt High (math 58% / reading 72%, grade B, #161 of 535 statewide, top 30%, 1,890 students, 38% FRL) — zoned schools average 38% FRL vs 55% district-wide (16 pts lower); this property's tenant base skews higher-income than the district average.
- Zoned-school proficiency averages 56% at this address vs 36% district-wide (+19 pts) — the actual schools serving this property are materially stronger than the Cumberland County Schools average implies; a family-tenant draw the district grade alone would hide.
- Market conditions: Rents flat; 401 active listings in the ZIP; 10 comparable units currently listed for rent nearby; rentals at typical pace (median 24d on market — plan ~3-4 weeks tenant-placement turnaround); 1,125 units permitted in Cumberland County in 2024 (104 in 5+ unit buildings).
- This rent runs 35% of the median local income ($68k/yr) — at the standard rent-burdened threshold; future hikes will face affordability resistance.
Forward outlook
- Local home prices are declining (-3.0%/yr); year-one equity from $2k of loan paydown is wiped out by about $7k of value loss. Plan a longer hold.
Negotiation context
- It's been on market 140 days — a 12% lower offer ($216k) is reasonable based on typical stale-listing flexibility.
- 9 sale attempts since 5y ago; this cycle's ask has dropped $23k (9%) from the opening price — seller is motivated, your offer sets the floor, not the list.
Risks & watch-outs
- Climate carrying-cost: major wind risk, 78% chance of damaging wind over 30y; major wildfire risk; extreme-heat days projected 7→16/yr by 2055 (HVAC capex compounding) — expect insurance premiums to compound above CPI over the hold.
Questions for the listing agent
- It's been on market 140 days. Have you received any prior offers? Is the seller open to a 19% concession, seller financing, or rate buy-down credit?
- Built in 1968 — when were the roof, HVAC, electrical panel, plumbing, and water heater last replaced?
- Why hasn't it sold? Are there any deal-killer items the seller is aware of (foundation, flood, title, zoning, code violations)?
- Is there a deadline driving the sale (1031 exchange, divorce, estate, relocation)? That informs how much negotiation room exists.
- Schools are D-rated, which usually means shorter tenancies and higher turnover. Who's the typical renter profile here, and what's been the actual vacancy rate?
- Crime grade is D in this area — have there been break-ins, vandalism, or insurance claims at this property in the last 3 years? What carrier currently insures it and at what premium?
- The area grade is low — what's the realistic commute time and amenity access for the typical tenant pool here? Any planned neighborhood developments (good or bad) we should know about?
- What's the average days-on-market for RENTAL listings here right now (not sales)? A rising rental-DOM trend means longer vacancies and softer asking-rent achievability than the comps imply.
- What's the recent tenant-quality profile in this submarket — average credit score on applications, eviction rate, late-payment / NSF rate, and stable-employment percentage? A property-management company in the area should have these aggregated.
- How much new for-sale + rental construction is in the pipeline within 1–3 miles? Heavy new supply typically softens prices + rents 12–24 months out; constrained supply supports both.
Investment metrics
- 1% rule
- 0.81% ✗
- Cap rate
- 6.57%
- Cash-on-cash
- 0.99%
- DSCR
- 1.04
- GRM
- 10.3
CMA / ARV
- ARV (on-the-fly)
- $286,404
- Comps found
- 6
Show comp detail 6 sales within ~0.75 mi
| Address | Dist | Beds/Ba | Sqft | Sold | Price | $/sf | Match |
|---|---|---|---|---|---|---|---|
| 2863 Aristocrat Ln | 0.27mi | 3/2.5 | 1,725 (+5%) | 5mo | $300,000 | $174 | 73 |
| 2843 Aristocrat Ln | 0.21mi | 3/2.5 | 1,746 (+6%) | 8mo | $300,000 | $172 | 71 |
| 4236 Redspire Ln | 0.11mi | 3/2.5 | 1,826 (+11%) | 22mo | $289,900 | $159 | 56 |
| 6906 Harvest Ct | 0.55mi | 3/2.5 | 1,714 (+4%) | 19mo | $311,000 | $181 | 50 |
| 6580 Windy Creek Way | 0.73mi | 3/2.5 | 1,866 (+13%) | 10mo | $330,000 | $177 | 33 |
| 4640 Ritson Ln | 0.44mi | 4/2.0 (+1) | 1,831 (+11%) | 24mo | $310,500 | $170 | 32 |
Match score weights: distance 35% · size 25% · config 20% · recency 20%. Top-matched comps best support the ARV.
Projected returns pro-forma
-3.0% appreciation · 0.9% rent growth · sell at horizon
- IRR
- -16.9%
- Equity multiple
- 0.41×
- Total profit
- $-40,270
- Equity at exit
- $36,530
- IRR
- -12.7%
- Equity multiple
- 0.32×
- Total profit
- $-46,884
- Equity at exit
- $21,183
Cash invested: $68,600 (down + closing). Projections, not guarantees.
Landlord ↔ Tenant lean methodology
- Overall (STATE)
- 85 Strongly Landlord-Friendly
- State North Carolina
- 85 Strongly Landlord-Friendly · R+3
- County
- — inherits STATE
- City
- — inherits STATE
ZIP-level market 28306
- Home prices YoY
- -17.7%
- Rents YoY
- 0.9%
- Active inventory
- 401
- Price-to-rent
- 10.3×
Monthly cashflow live
- Estimated rent
- $1,981 high interval (Pro) →
- Mortgage (P&I)
- −$1,285
- Tax from tax record
- −$122 /mo · $1,460/yr
- Insurance
- −$102
- HOA
- −$0
- Vacancy / Maint / Mgmt
- −$416
- Net cashflow
- $57
Break-even live
UW: 25.0% down · 7.5% · 30yr · 1.5% tax · 5.0% vac · 8.0% maint · 8.0% mgmt
Financing live
Cash to close
- Down payment
- $61,250
- Closing costs
- $7,350
- Reserves months
- —
- Total cash needed
- —
Loan-product check · same deal, 3 products live
Conventional
25% down · 7.5% · 30yr
- Down + closing
- —
- Monthly P&I
- —
- Monthly cashflow
- —
- DSCR
- —
- Eligible?
- —
Personal DTI + credit; lowest rate.
DSCR
20% down · 8.5% · 30yr
- Down + closing
- —
- Monthly P&I
- —
- Monthly cashflow
- —
- DSCR
- —
- Eligible?
- —
No personal income docs; deal must DSCR.
Hard money
10% down · 12.0% · 12mo
- Down + closing
- —
- Monthly P&I
- —
- Monthly cashflow
- —
- DSCR
- —
- Eligible?
- —
Short-term bridge; refi at stabilization.
Rent comps 10 comps
| Address | Beds | Baths | Sqft | Rent | $/sqft | DOM | Units | Dist |
|---|---|---|---|---|---|---|---|---|
| 2827 Aristocrat Ln Fayetteville, NC | 3.0 | 2.0 | 1837 | $1,950 | $1.06 | 23d | 1 | 0.15mi |
| 3831 Queen Anne Loop Fayetteville, NC | 2.0–3.0 | 2.0 | 1274 | $1,743 | $1.37 | 14d | 7 | 0.77mi |
| 7143 Stoney Point Rd Fayetteville, NC | 3.0 | 2.0 | 1700 | $1,545 | $0.91 | 23d | 1 | 0.84mi |
| 8107 King Rd Fayetteville, NC | 3.0 | 2.5 | 1700 | $1,950 | $1.15 | 23d | 1 | 0.86mi |
| 8103 King Rd Fayetteville, NC | 3.0 | 2.5 | 1700 | $1,950 | $1.15 | 23d | 1 | 0.90mi |
| 8103 King Rd Fayetteville, NC | 3.0 | 2.5 | 1700 | $1,950 | $1.15 | 14d | 1 | 0.90mi |
| 4032 Newgate St Fayetteville, NC | 4.0 | 2.5 | 2209 | $2,750 | $1.24 | 23d | 1 | 0.98mi |
| 3507 Dundle Rd Fayetteville, NC | 3.0 | 2.0 | 1500 | $1,650 | $1.10 | 14d | 1 | 1.03mi |
| 3264 Alforodo St Fayetteville, NC | 4.0 | 2.5 | 2059 | $1,875 | $0.91 | 23d | 1 | 1.16mi |
| 101 Bayview Cir Parkton, NC | 3.0 | 2.0 | 1875 | $2,750 | $1.47 | 23d | 1 | 1.18mi |
Listing history 37 events
-
2026-06-18days on market $245,000 Active 140 DOM
-
2026-06-17days on market $245,000 Active 139 DOM
-
2026-06-16days on market $245,000 Active 138 DOM
-
2026-06-15days on market $245,000 Active 137 DOM
-
2026-06-14days on market $245,000 Active 135 DOM
-
2026-06-13days on market $245,000 Active 134 DOM
-
2026-06-10days on market $245,000 Active 132 DOM
-
2026-06-09days on market $245,000 Active 131 DOM
-
2026-06-08days on market $245,000 Active 130 DOM
-
2026-06-07pricedays on market $245,000 Active 129 DOM
-
2026-06-03days on market $250,000 Active 125 DOM
-
2026-06-02days on market $250,000 Active 124 DOM
-
2026-06-01days on market $250,000 Active 123 DOM
-
2026-05-31days on market $250,000 Active 122 DOM
-
2026-05-30days on market $250,000 Active 121 DOM
-
2026-02-23price $250,000
-
2026-01-29$268,000 Active
-
2025-10-13price $261,000
-
2025-10-04$271,000 Active
-
2023-10-09status Active
-
2023-09-28status Pending
-
2023-08-30price $240,000
-
2023-08-21price $245,000
-
2023-08-18status Active
-
2023-08-10historical
-
2023-08-07status Active
-
2023-08-06historical
-
2023-08-04status Active
-
2023-08-01historical
-
2023-07-27price $250,000
-
2023-06-26$255,000 Active
-
2021-11-10soldstatus $215,000
-
2021-11-10soldstatus $215,000
-
2021-09-07$209,900
-
2021-05-10soldstatus $65,000
-
2021-05-10soldstatus $65,000
-
2021-01-07$95,000
ⓘ Source: listings_history table (triggers on properties + properties_extension) + one-shot
backfill from property_details.listing_events for pre-trigger history.
Tax reassessment forecast NC · Resets to sale price
- Current annual tax
- $1,460 · $122/mo
- Projected year-2 tax
- $2,009 · $167/mo
- Expected delta
- +$549/yr (+$46/mo · 37.6%)
ⓘ Screening estimate from a state-policy table — verify with the county assessor before closing.
Climate risk First Street
- Flood 1/10 Low FEMA zone X (unshaded) · 0% chance over 30 yrs
- Wildfire 7/10 Severe
- Heat 7/10 Severe 7 d/yr ≥106°F today · 16 d/yr by 30 yrs out
- Wind 7/10 Severe 78% chance of damaging wind over 30 yrs
- Air quality 1/10 Low 0 unhealthy d/yr today · 0 by 30 yrs out
Nearby sold comps map
Loading sold comps map…
Walkable amenities ~0.75 mi
Loading nearby amenities…
Taxation est. · year 1
- Rental income
- $23,777
- − Mortgage interest
- −$13,724
- − Property taxes
- −$1,460
- − Insurance
- −$1,225
- − Repairs & maintenance
- −$1,902
- − Management
- −$1,902
- − Depreciation
- −$7,127
- Taxable loss
- −$3,563
- Est. tax savings @ 24.0%
- +$855
- After-tax cash flow
- $1,536/yr
For passive investors: Depreciation is non-cash, so a rental often shows a tax loss while cash-flowing — sheltering income. Rental losses are passive: they offset passive income freely, and up to $25,000/yr can offset ordinary (W-2) income if you actively participate and your MAGI is under $100k (phasing out to $0 by $150k); unused losses carry forward. On sale, claimed depreciation is recaptured at up to 25%, and gains may owe capital-gains tax (a 1031 exchange can defer both). Figures are a year-1 estimate at your 24.0% rate — not tax advice; consult a CPA.
Schools (NCES district)
- District
- Cumberland County Schools
- NCES district ID
- 3700011
- Math proficiency
- 32% ▼ -2.00%
- Reading proficiency
- 41% ▼ -1.00%
- Median HH income
- $44,168
- Composite
- 31.0/100
- National rank
- #6096
- State rank
- #126 of 178 in NC
Livability — Hope Mills
- Score
- 67/100
- State rank
- #234
- US rank
- #10761
Category grades
Schools grade is shown separately in the Schools card above.
Census & demographics
- County
- Cumberland County · 265,314 people
- City population
- 39,196
- Metro
- Fayetteville, NC
- Population (ZIP)
- 43,042
- Household income
- $67,544
- Rent vs Own
- Severe rent burden
- 1386.0
Population outlook (Cumberland County) Hauer SSP2
- Today (2025)
- 330,855 people
- By 2030
- 333,523 · +0.8%
- By 2040
- 335,583 · +1.4%
- By 2050
- 335,325 · +1.4%
- By 2075
- 342,853 · +3.6%
- By 2100
- 340,698 · +3.0%
Race, ethnicity, and origin ACS 2023
- Neighborhood character
- Diverse neighborhood (Simpson 0.68)
- Race & ethnicity
- White 44% Black 33% Hispanic / Latino 13% Two or more races 8% Asian 4% Native American 2%
- Hispanic origin (detail)
- Mexican 5% Puerto Rican 5%
- Common ancestry
- Italian 2% Slovak 1% Serbian 1%
- Foreign-born
- 8% · Canada, South Korea, Jamaica
- Languages at home
- 87% English-only · Spanish 9% Other Indo-European 1% French/Haitian/Cajun 1%
Political lean MEDSL · Cumberland
- 2024 margin
- D (+13.4) · D 56.1% · R 42.7% · Other 1.2%
- 2008→2024 swing
- -4.3pp toward R · 2008: 17.7pp · 2024: 13.4pp
- All cycles
- 2024: D+13.4 2020: D+16.6 2016: D+16.0 2012: D+19.7 2008: D+17.7
Not yet ingested
- Civics
- —
Market trends
- HPI YoY
- ▼ -51.69%
- Current HPI
- 239.7281
- Rent YoY
- ▲ 0.90%
- Metro
- Fayetteville, NC
- State GDP YoY
- ▲ 3.28%
- F500 in state
- 26
Industry mix (Fortune 500 HQ in NC)
| Industry | F500 HQs | Revenue |
|---|---|---|
| Financial Services | 2 | $213B |
|
||
| Retail | 2 | $95B |
|
||
| Industrial Conglomerate | 1 | $38B |
|
||
| Metals / Steel | 1 | $35B |
|
||
| Utilities | 1 | $30B |
|
||
| Industrial Machinery | 1 | $19B |
|
||
Price history
+163.2% since first listed22 events — show timeline
- 2026-02-23 Price Changed $250,000 LPRMLS
- 2026-01-29 Listed $268,000 LPRMLS
- 2025-10-13 Price Changed $261,000 LPRMLS
- 2025-10-04 Listed $271,000 LPRMLS
- 2023-10-09 Relisted — LPRMLS
- 2023-09-28 Pending — LPRMLS
- 2023-08-30 Price Changed $240,000 LPRMLS
- 2023-08-21 Price Changed $245,000 LPRMLS
- 2023-08-18 Relisted — LPRMLS
- 2023-08-10 Delisted — LPRMLS
- 2023-08-07 Relisted — LPRMLS
- 2023-08-06 Delisted — LPRMLS
- 2023-08-04 Relisted — LPRMLS
- 2023-08-01 Delisted — LPRMLS
- 2023-07-27 Price Changed $250,000 LPRMLS
- 2023-06-26 Listed $255,000 LPRMLS
- 2021-11-10 Sold (Public Records) $215,000 Public Records
- 2021-11-10 Sold (MLS) $215,000 LPRMLS
- 2021-09-07 Listed $209,900 LPRMLS
- 2021-05-10 Sold (Public Records) $65,000 Public Records
- 2021-05-10 Sold (MLS) $65,000 LPRMLS
- 2021-01-07 Listed $95,000 LPRMLS
Property tax history
+4.8%/yrLatest (2025): $1,460 · +40.5% YoY. Source: county tax records.
Cash-flow waterfall
monthlySold comps — $/sqft
last 12 mo · ≤1 miLoading sold comps…