 Multi-family
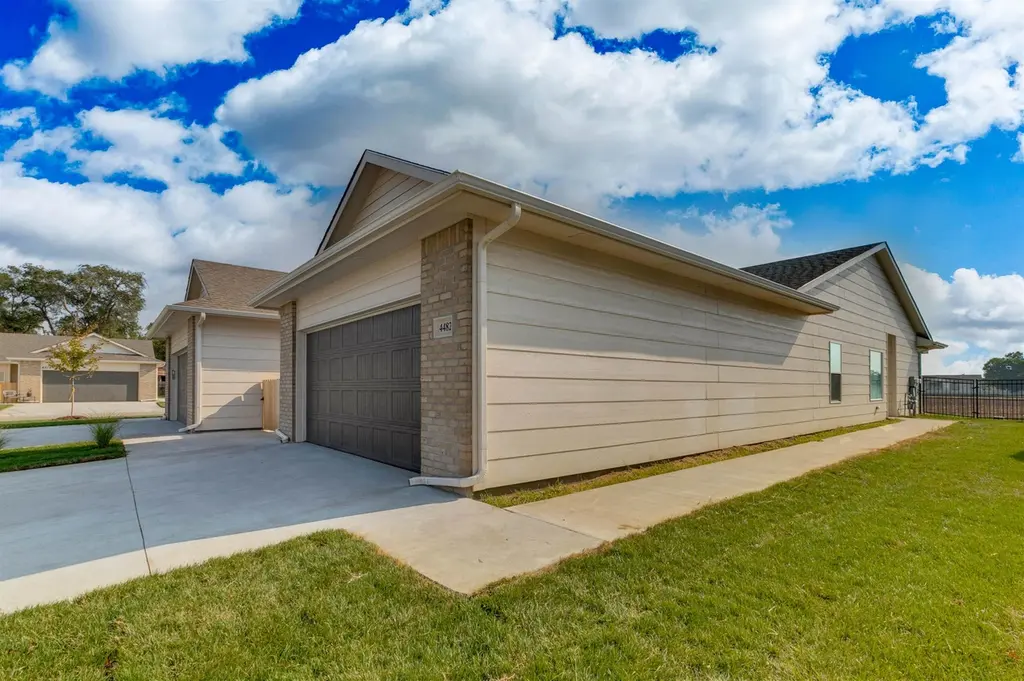
5408 N Sandkey · Wichita, KS
Flood risk 1/10 · Minimal
- FEMA flood zone
- X (shaded)
- Chance of flooding over 30 yrs
- 0.0%
- Est. flood insurance / yr
- $507 – $1,088
Fire risk 4/10 · Minor
- Est. fire insurance / yr
- $1,154 – $2,142
Heat risk 5/10 · Moderate
- Hot days now (above 106°F)
- 7 days/yr
- Hot days in 30 yrs
- 18 days/yr
Wind risk 2/10 · Minimal
- Chance of severe wind over 30 yrs
- 1.0%
Air-quality risk 2/10 · Minimal
- Unhealthy air days now
- 2 days/yr
- Unhealthy air days in 30 yrs
- 2 days/yr
Risk factors via First Street. Map © Google.
Why this score? — see what drove the B- grade
The composite is a weighted blend of 9 inputs, each scored 0–100. Each bar is that input's sub-score; the figure is the points it added to the 100-point composite (weight × sub-score).
- Cash flow +26.9/30.0
- 1% rule +9.3/10.0
- DSCR +9.3/10.0
- ARV discount +7.5/15.0
- Condition / age +4.0/5.0
- Livability +3.6/5.0
- Schools +3.1/10.0
- Rent growth +2.5/5.0
- Appreciation +0.0/10.0
$205,000
🖨 Deal sheet (PDF) 📄 Offer letter ✓ Due diligence
Multi-family units
County records classify this as Multi-Family (2-4 Unit). Listing-text estimate: 1 unit. estimate disagrees with records
Key facts
- Quartz countertops
- Fenced yard
- Walk in closet
Tags
Property features AI
Finance
- HOA & community: Has association; Association fee $900; One-time HOA initiation fee $250; Association includes lawn service
Exterior
- Parking: 2-car garage
- Utilities: Natural gas available; Public utilities
- Home design: One-level duplex
- Construction: Composition roof; Slab foundation
- Exterior features: Covered patio/porch
Interior
- Kitchen: Dishwasher; Disposal; Microwave; Range; Refrigerator
- Flooring: Laminate
- Bathrooms: 2 full bathrooms
- Heating & cooling: Central air conditioning; Electric heating
- Interior features: Dishwasher, Disposal, Microwave, Range, Refrigerator; Laminate flooring; Laundry in a separate room; No basement
- Laundry & utility: Laundry located in a separate room
Neighborhood map
What this means for you Summary
Snapshot
- This is a 8-bed/4.0-bath multifamily listed at $205k. Condition is rated good.
Deal economics
- At list price, monthly cash flow is $568 ($7k/yr) — positive.
- The deal already cash-flows at list — no discount required.
- Meets the 1% rule at list price ($3k rent vs $205k).
- Recommended offer: $199k (3.0% below list) — sets the bar for market timing.
Location & tenants
- Location reads 72/100 on livability (#100 in KS) — a middle-class / working-renter tenant base. Strengths: amenities A+, cost of living A+, housing A+; Watch: employment D+, crime F, commute F.
- Valley Center Pub Schools (suburban): math 30% / reading 37% proficiency, ranked #57 of 169 in KS (top 34%) — families likely to look elsewhere, expect single-tenant / working-renter base with shorter leases.
- Zoned schools: Valley Center Intermediate School (math 33% / reading 54%, grade F, #268 of 684 statewide, top 39%, 480 students, 41% FRL); Valley Center Middle School (math 23% / reading 28%, grade F, #104 of 219 statewide, top 49%, 761 students, 42% FRL); Valley Center High (math 22% / reading 22%, grade F, #165 of 327 statewide, top 55%, 995 students, 34% FRL).
- Market conditions: 60 active listings in the ZIP; 2,613 units permitted in Sedgwick County in 2024 (258 in 5+ unit buildings).
- At $2,934/mo this rent would consume 49% of the median local household income ($72k/yr) (locally 267% of renters already pay >50% of income on rent) — very limited rent-growth headroom before tenants either downsize or default.
Forward outlook
- Local home prices are declining (-3.0%/yr); year-one equity from $1k of loan paydown is wiped out by about $6k of value loss. Plan a longer hold.
- Sedgwick County population projected at +5% by 2050 — modest demand growth; plan on rents tracking national, not racing it.
- At projected returns (-3.0% appreciation + 3.0% rent growth), your $57k cash investment doubles in ~10 years — after that, you're playing with house money.
Negotiation context
- It's been on market 39 days — a 3% lower offer ($199k) is reasonable based on typical stale-listing flexibility.
- 2 sale attempts with the ask held roughly flat each time — persistent listings suggest the price (not the market) is what's stuck; bring a comps-based counter.
Risks & watch-outs
- Watch-outs: property tax is 3.0% of price.
- Climate carrying-cost: extreme-heat days projected 7→18/yr by 2055 (HVAC capex compounding) — expect insurance premiums to compound above CPI over the hold.
Questions for the listing agent
- It's been on market 39 days. Have you received any prior offers? Is the seller open to a 3% concession, seller financing, or rate buy-down credit?
- Property tax is high relative to price — has the assessment been appealed recently, and will the sale trigger a re-assessment?
- What does the HOA fee cover, when was the last increase, and are there any pending special assessments or reserve-fund shortfalls?
- Is there a deadline driving the sale (1031 exchange, divorce, estate, relocation)? That informs how much negotiation room exists.
- Schools are F-rated, which usually means shorter tenancies and higher turnover. Who's the typical renter profile here, and what's been the actual vacancy rate?
- Crime grade is F in this area — have there been break-ins, vandalism, or insurance claims at this property in the last 3 years? What carrier currently insures it and at what premium?
- What's the average days-on-market for RENTAL listings here right now (not sales)? A rising rental-DOM trend means longer vacancies and softer asking-rent achievability than the comps imply.
- What's the recent tenant-quality profile in this submarket — average credit score on applications, eviction rate, late-payment / NSF rate, and stable-employment percentage? A property-management company in the area should have these aggregated.
- How much new apartment / multifamily construction is in the pipeline within 1–3 miles? Heavy new supply (>2% of stock underway) typically softens rents 12–24 months out; light construction supports rent growth.
Investment metrics
- 1% rule
- 1.43% ✓
- Cap rate
- 9.62%
- Cash-on-cash
- 11.87%
- DSCR
- 1.53
- GRM
- 5.8
CMA / ARV
No comps found within radius.
Projected returns pro-forma
-3.0% appreciation · 3.0% rent growth · sell at horizon
- IRR
- 1.5%
- Equity multiple
- 1.06×
- Total profit
- $3,196
- Equity at exit
- $30,566
- IRR
- 11.2%
- Equity multiple
- 1.88×
- Total profit
- $50,364
- Equity at exit
- $17,725
Cash invested: $57,400 (down + closing). Projections, not guarantees.
Landlord ↔ Tenant lean methodology
- Overall (STATE)
- 83 Strongly Landlord-Friendly
- State Kansas
- 83 Strongly Landlord-Friendly · R+10
- County
- — inherits STATE
- City
- — inherits STATE
ZIP-level market 67204
- Active inventory
- 60
- Price-to-rent
- 11.6×
Monthly cashflow live
- Estimated rent
- $2,934 medium interval (Pro) →
- Mortgage (P&I)
- −$1,075
- Tax from tax record
- −$515 /mo · $6,175/yr
- Insurance
- −$85
- HOA
- −$75
- Vacancy / Maint / Mgmt
- −$616
- Net cashflow
- $568
Break-even live
Sensitivity live
| Price | -10% $684 | -5% $626 | +0% $568 | +5% $510 | +10% $452 |
|---|---|---|---|---|---|
| Rent | -10% $336 | -5% $452 | +0% $568 | +5% $684 | +10% $800 |
| Rate | -1.0pp $671 | -0.5pp $620 | base $568 | +0.5pp $515 | +1.0pp $461 |
2-unit breakdown (identical units grouped — click to expand)
| Units | Beds | Baths | Est. rent |
|---|---|---|---|
| 2× units | 2 | 1 | $2,934 |
| #1 | 2 | 1 | $1,467 |
| #2 | 2 | 1 | $1,467 |
| Total (2 units) | $2,934 | ||
UW: 25.0% down · 7.5% · 30yr · 1.5% tax · 5.0% vac · 8.0% maint · 8.0% mgmt
Financing live
Cash to close
- Down payment
- $51,250
- Closing costs
- $6,150
- Reserves months
- —
- Total cash needed
- —
Loan-product check · same deal, 3 products live
Conventional
25% down · 7.5% · 30yr
- Down + closing
- —
- Monthly P&I
- —
- Monthly cashflow
- —
- DSCR
- —
- Eligible?
- —
Personal DTI + credit; lowest rate.
DSCR
20% down · 8.5% · 30yr
- Down + closing
- —
- Monthly P&I
- —
- Monthly cashflow
- —
- DSCR
- —
- Eligible?
- —
No personal income docs; deal must DSCR.
Hard money
10% down · 12.0% · 12mo
- Down + closing
- —
- Monthly P&I
- —
- Monthly cashflow
- —
- DSCR
- —
- Eligible?
- —
Short-term bridge; refi at stabilization.
HOA detail
- Monthly dues
- $75 · $900/yr
Listing history 20 events
-
2026-06-22days on market $205,000 Active 39 DOM
-
2026-06-18days on market $205,000 Active 36 DOM
-
2026-06-17days on market $205,000 Active 35 DOM
-
2026-06-16days on market $205,000 Active 34 DOM
-
2026-06-15days on market $205,000 Active 33 DOM
-
2026-06-14days on market $205,000 Active 31 DOM
-
2026-06-13days on market $205,000 Active 30 DOM
-
2026-06-10days on market $205,000 Active 28 DOM
-
2026-06-09days on market $205,000 Active 27 DOM
-
2026-06-08days on market $205,000 Active 26 DOM
-
2026-06-07days on market $205,000 Active 25 DOM
-
2026-06-05days on market $205,000 Active 22 DOM
-
2026-06-03days on market $205,000 Active 21 DOM
-
2026-06-02days on market $205,000 Active 20 DOM
-
2026-06-01days on market $205,000 Active 19 DOM
-
2026-05-31days on market $205,000 Active 18 DOM
-
2026-05-30days on market $205,000 Active 17 DOM
-
2026-05-13$205,000 Active
-
2026-03-27historical $1,650
-
2026-02-25$1,650
ⓘ Source: listings_history table (triggers on properties + properties_extension) + one-shot
backfill from property_details.listing_events for pre-trigger history.
Tax reassessment forecast KS · Resets to sale price
- Current annual tax
- $6,175 · $515/mo
- Projected year-2 tax
- $6,175 · $515/mo
- Expected delta
- $0/yr ($0/mo · 0.0%)
ⓘ Screening estimate from a state-policy table — verify with the county assessor before closing.
Climate risk First Street
- Flood 1/10 Low FEMA zone X (shaded) · 0% chance over 30 yrs
- Wildfire 4/10 Moderate
- Heat 5/10 Major 7 d/yr ≥106°F today · 18 d/yr by 30 yrs out
- Wind 2/10 Low 100% chance of damaging wind over 30 yrs
- Air quality 2/10 Low 2 unhealthy d/yr today · 2 by 30 yrs out
Nearby sold comps map
Loading sold comps map…
Walkable amenities ~0.75 mi
Loading nearby amenities…
Taxation est. · year 1
- Rental income
- $35,208
- − Mortgage interest
- −$11,483
- − Property taxes
- −$6,175
- − Insurance
- −$1,025
- − Repairs & maintenance
- −$2,817
- − Management
- −$2,817
- − HOA
- −$900
- − Depreciation
- −$5,964
- Taxable income
- $4,028
- Est. tax owed @ 24.0%
- −$967
- After-tax cash flow
- $5,847/yr
For passive investors: Depreciation is non-cash, so a rental often shows a tax loss while cash-flowing — sheltering income. Rental losses are passive: they offset passive income freely, and up to $25,000/yr can offset ordinary (W-2) income if you actively participate and your MAGI is under $100k (phasing out to $0 by $150k); unused losses carry forward. On sale, claimed depreciation is recaptured at up to 25%, and gains may owe capital-gains tax (a 1031 exchange can defer both). Figures are a year-1 estimate at your 24.0% rate — not tax advice; consult a CPA.
Condition & rehab AI · 12 photos
This multi-family home is in excellent condition with modern amenities and a well-maintained exterior. It is move-in ready and has the potential for further value increases through minor updates.
Value-add opportunities
- Both Painting the exterior and interior walls — Fresh paint can enhance curb appeal and interior aesthetics.
- Both Landscaping improvements — A well-maintained yard can increase both resale and rental value.
- Both Adding smart home features — Smart home features can attract tech-savvy buyers and renters.
- Both Upgrading the kitchen appliances — Modern appliances can make the kitchen more functional and appealing to potential buyers and renters.
Renovation cost estimate screening
Value-add ROI direction
- Both Painting the exterior and interior walls — Fresh paint can enhance curb appeal and interior aesthetics. ↑
- Both Landscaping improvements — A well-maintained yard can increase both resale and rental value. ↑
- Both Adding smart home features — Smart home features can attract tech-savvy buyers and renters. ↑
- Both Upgrading the kitchen appliances — Modern appliances can make the kitchen more functional and appealing to potential buyers and renters. ↑
ⓘ Cost ranges are severity-bucket heuristics (US national rule-of-thumb). Get contractor quotes + a written scope before underwriting a rehab budget.
Schools (NCES district)
- District
- Valley Center Pub Schools
- NCES district ID
- 2012510
- Math proficiency
- 30% ▼ -9.00%
- Reading proficiency
- 37% ▼ -6.00%
- Median HH income
- $66,689
- Composite
- 30.68/100
- National rank
- #6178
- State rank
- #57 of 169 in KS
Livability — Wichita
- Score
- 72/100
- State rank
- #100
- US rank
- #5730
Category grades
Schools grade is shown separately in the Schools card above.
Census & demographics
- Census place
- Wichita, KS
- County
- Sedgwick County · 432,957 people
- City population
- 365,168
- Metro
- Wichita, KS
- Population (ZIP)
- 22,538
- Household income
- $71,999
- Rent vs Own
- Severe rent burden
- 267.0
Population outlook (Sedgwick County) Hauer SSP2
- Today (2025)
- 537,014 people
- By 2030
- 546,984 · +1.9%
- By 2040
- 559,141 · +4.1%
- By 2050
- 562,027 · +4.7%
- By 2075
- 557,255 · +3.8%
- By 2100
- 513,383 · -4.4%
Race, ethnicity, and origin ACS 2023
- Neighborhood character
- Diverse neighborhood (Simpson 0.58)
- Race & ethnicity
- White 49% Hispanic / Latino 42% Two or more races 19% Black 3% Asian 1%
- Hispanic origin (detail)
- Mexican 41%
- Common ancestry
- Lithuanian 3% Italian 2% Serbian 1%
- Foreign-born
- 17% · Canada, Vietnam
- Languages at home
- 63% English-only · Spanish 35%
Political lean MEDSL · Sedgwick
- 2024 margin
- R (+13.8) · D 42.3% · R 56.1% · Other 1.6%
- 2008→2024 swing
- -1.1pp toward R · 2008: -12.7pp · 2024: -13.8pp
- All cycles
- 2024: R+13.8 2020: R+12.6 2016: R+19.1 2012: R+19.7 2008: R+12.7
Not yet ingested
- Civics
- —
Market trends
- HPI YoY
- ▼ -162.52%
- Current HPI
- 246.2816
- Rent YoY
- —
- Metro
- Wichita, KS
- State GDP YoY
- —
- F500 in state
- 0
Price history
+12324.2% since first listed3 events — show timeline
- 2026-05-13 Listed $205,000 SCKMLS as Distributed by MLS Grid
- 2026-03-27 Rental Removed $1,650 APPFOLIO
- 2026-02-25 Listed for Rent $1,650 APPFOLIO
Property tax history
+131.4%/yrLatest (2025): $6,175 · +110.6% YoY. Source: county tax records.
Cash-flow waterfall
monthlySold comps — $/sqft
last 12 mo · ≤1 miLoading sold comps…